. 2022 Nov 5;5(1):1189.
doi: 10.1038/s42003-022-04140-y.

The P. aeruginosa effector Tse5 forms membrane pores disrupting the membrane potential of intoxicated bacteria

Affiliations

The P. aeruginosa effector Tse5 forms membrane pores disrupting the membrane potential of intoxicated bacteria

Amaia González-Magaña et al. Commun Biol. .

Abstract

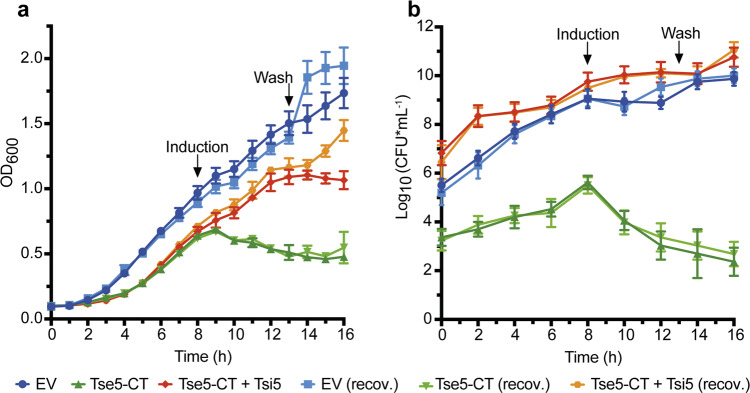
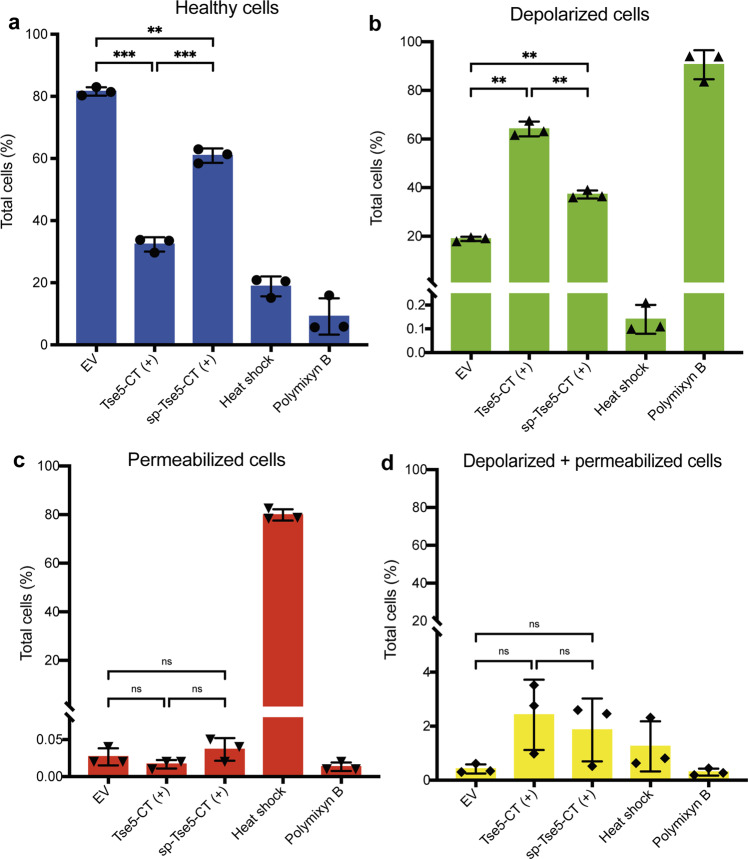
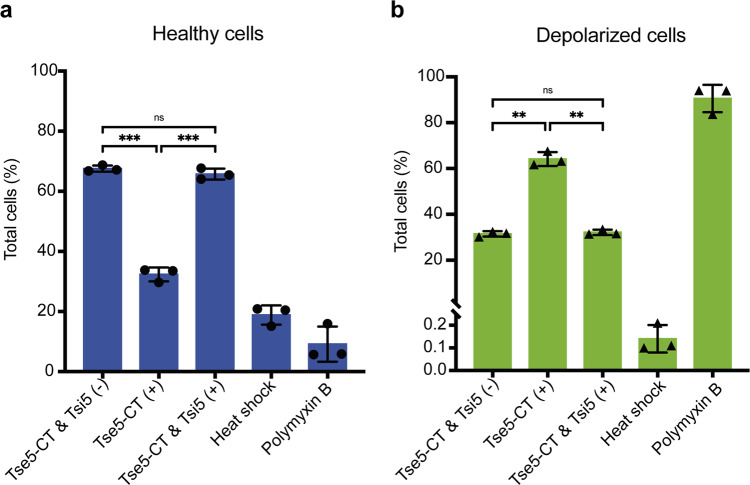
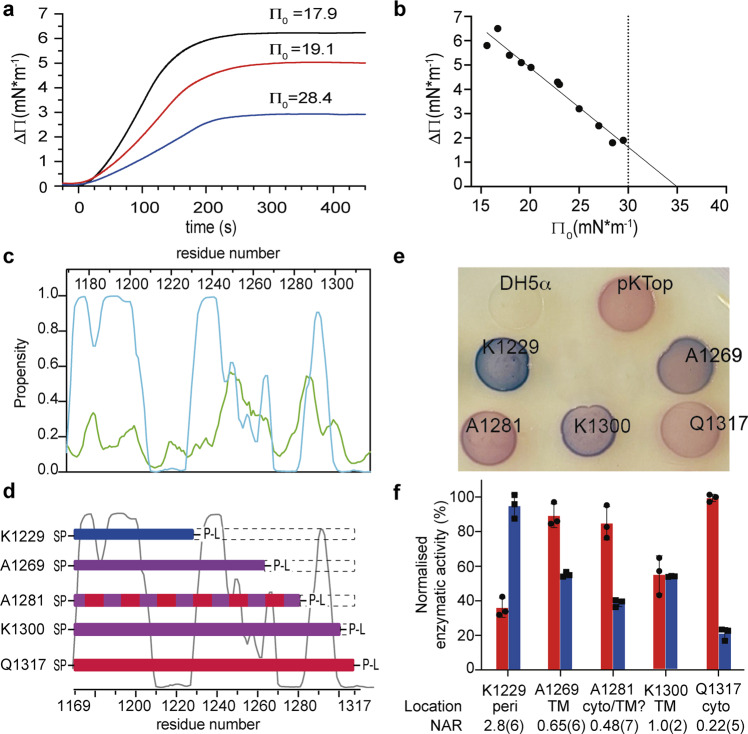
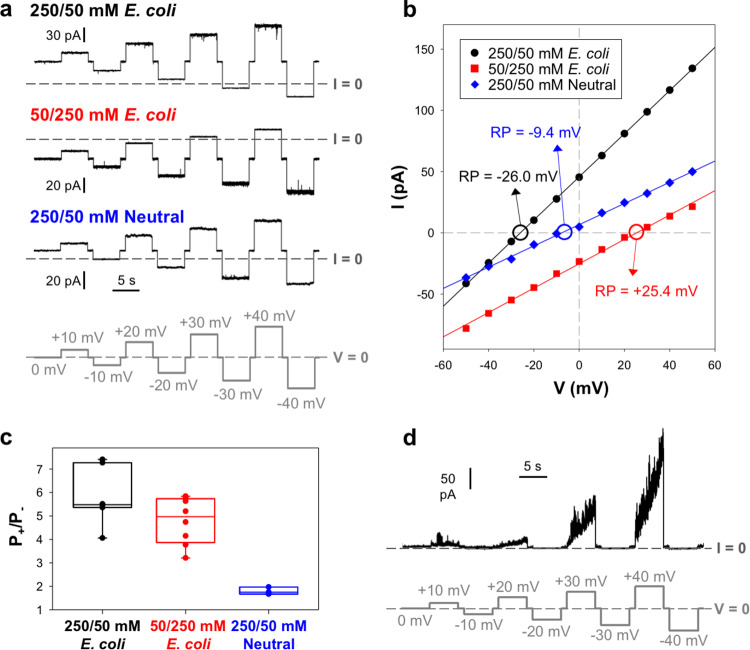
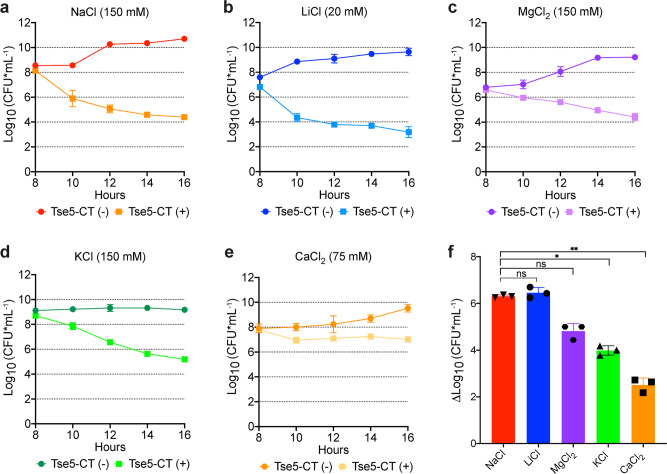
The type VI secretion system (T6SS) of Pseudomonas aeruginosa injects effector proteins into neighbouring competitors and host cells, providing a fitness advantage that allows this opportunistic nosocomial pathogen to persist and prevail during the onset of infections. However, despite the high clinical relevance of P. aeruginosa, the identity and mode of action of most P. aeruginosa T6SS-dependent effectors remain to be discovered. Here, we report the molecular mechanism of Tse5-CT, the toxic auto-proteolytic product of the P. aeruginosa T6SS exported effector Tse5. Our results demonstrate that Tse5-CT is a pore-forming toxin that can transport ions across the membrane, causing membrane depolarisation and bacterial death. The membrane potential regulates a wide range of essential cellular functions; therefore, membrane depolarisation is an efficient strategy to compete with other microorganisms in polymicrobial environments.


Conflict of interest statement

The authors declare no competing interests.

Figures

Fig. 1
Fig. 1. Tse5-CT has a bacteriolytic effect when expressed in P. putida.
a Monitoring growth (OD600) in LB medium of P. putida cells harbouring pS238D1 empty vector (EV) as a negative control or plasmids directing the expression of Tse5-CT, or Tse5-CT and Tsi5 together. Expression of Tse5-CT and Tsi5 was induced after 8 h of bacterial growth (see the arrow) with 1 mM m-Toluic acid (TA) and 0.1 mM isopropyl 1-thio-β-d-galactopyranoside (IPTG), respectively. Co-expression of Tse5-CT and Tsi5 was induced by adding to the media both TA and IPTG. To stop the induction, the recovered cells (recov.) were washed and resuspended in fresh LB without inductors (see the arrow). Expression of Tse5-CT caused inhibition of bacterial growth, and cells did not recover the capacity to duplicate after washing. Tsi5 confers cell protection from Tse5 expression. b Monitoring growth on solid medium. Samples of P. putida growing cells were taken every 2 h, and dilutions were spotted on LB agar plates. Colony-forming units (CFU) were counted 24 h later. All measurements were made in triplicate (n = 3 biological replicates). The graphs show the mean values and ± standard deviations (SD). Some error bars are not visible due to overlaps with symbols.
Fig. 2
Fig. 2. Tse5-CT causes membrane depolarisation when expressed in P. putida.
Flow cytometry experiments were performed with P. putida cells harbouring pS238D1 empty vector (EV) as a negative control and plasmids directing the expression of Tse5-CT or sp-Tse5-CT. Each graph includes two positive controls: cells treated with a heat shock that results in cell permeabilization and cells treated with polymyxin B, which results in cell depolarisation. a Flow cytometry results showing healthy cell populations. Healthy cells are not marked by any fluorophore. b Flow cytometry data show depolarised cell populations. Depolarised cells are stained with DiBAC4(3). c Flow cytometry results show permeabilized cell populations. Permeabilized cells are stained with Sytox™ Deep Red. d Flow cytometry results show permeabilized and depolarised cell populations. All measurements were made in triplicate (n = 3 biological replicates). The graphs show the mean values and ±standard deviations (SD). The one-way ANOVA (Brown–Forsythe ANOVA test) with Dunnett´s T3 multiple comparisons test was used to determine whether there is a significant difference between the mean values of our independent groups (non-significant [ns] if p > 0.05, * if p ≤ 0.05, ** if p ≤ 0.01, *** if p ≤ 0.001).
Fig. 3
Fig. 3. Tsi5 can protect from Tse5-induced membrane depolarisation.
Flow cytometry experiments were performed with P. putida cells harbouring plasmids directing the expression of Tse5-CT (Tse5-CT+) or Tse5-CT and Tsi5 (Tse5-CT+ and Tsi5+). As a negative control, the graphs include the flow cytometry results of cells transformed with pS238D1::tse5-CT and pSEVA424::tsi5 plasmids and without inducing the expression of the proteins (Tse5-CT and Tsi5). Each graph includes two positive controls: cells treated with a heat shock that results in cell permeabilization and cells treated with polymyxin B, which results in cell depolarisation. a Flow cytometry results showing healthy cell populations. Healthy cells are not marked with any fluorophore. b Flow cytometry data show depolarised cell populations. Depolarised cells stain with DiBAC4(3). All measurements were made in triplicate (n = 3 biological replicates). The graphs show the mean values and ± standard deviations (SD). The one-way ANOVA (Brown–Forsythe ANOVA test) with Dunnett´s T3 multiple comparisons test was used to determine whether there is a significant difference between the mean values of our independent groups (non-significant [ns] if p > 0,05, * if p ≤ 0.05, ** if p ≤ 0.01, *** if p ≤ 0.001).
Fig. 4
Fig. 4. Tse5-CT contains transmembrane regions that allow it to insert into lipid monolayers and the cytoplasmic membrane of E. coli cells.
a Representative Langmuir–Blodgett balance experiment showing the lateral pressure increase on lipid monolayers after the addition of Tse5-CT at time 0. Initial lateral pressures (Π0) in mN m−1 for representative experiments are indicated above each curve. b The plot of lateral pressure increases as a function of initial lateral pressure for every single experiment (n = 11). A maximal insertion pressure (MIP) of 34.99 mN m−1 has been determined by extrapolating the fitted curve to ΔΠ = 0. The dotted line indicates the threshold value of lateral pressure consistent with unstressed biological membranes. The equation obtained from the linear regression analysis is y = −0.3258x + 11,401 with an R-squared of 0.96. c Tse5-CT propensity to contain transmembrane (blue) and amphipathic (green) helices as predicted by MemBrain 3.1. d Representation not to scale of constructs containing the dual reporter PhoA-LacZα (abbreviated P-L in the figure) at different C-terminal fusion points of Tse5-CT: K1229, A1269, A1281, K1300 and Q1317 (full-length Tse5-CT). All constructs start at Ile1169, and the truncation points are indicated by the length of the coloured bars and the residue number shown below. The dotted boxes indicate the regions that have been deleted. The predicted transmembrane propensity of Tse5-CT residues is also shown in the background. All fusion constructs contain a signal peptide (SP) at the N-terminal. Bars are colour coded based on the experimental results. Thus, a blue bar corresponds to periplasmic localisation of PhoA-LacZα; a red bar corresponds to a cytoplasmic localisation; a purple bar corresponds to localisation in a TM region; and a red and purple bar (A1281) corresponds to a borderline result, where it is not clear if it localises in the cytosol or a TM region. e E. coli DH5α cells transformed with spTse5-CT-PhoA-LacZα fusion proteins growing on dual reporter agar plates. f Measures of the PhoA-LacZ enzymatic activities for each spTse5-CT-PhoA-LacZα fusion protein. Red and blue bars indicate LacZ and PhoA enzymatic activities, respectively. Calculated NAR values and the location of the dual reporter fusion points are indicated below the graph. All enzymatic activities were measured in triplicate (n = 3), and the graph shows the mean values and standard deviations (SD).
Fig. 5
Fig. 5. Tse5-CT forms stable pores with ohmic behaviour and preference for cations, and some pores with noisy currents and strong voltage dependence.
a Representative Tse5-CT-induced stable current traces were obtained in a 250/50 mM (upper panel) or 50/250 mM (middle panel) KCl gradient using a polar lipid extract from E. coli to form the membrane. The lower panel shows a representative trace in 250/50 mM KCl gradient when a neutral DOPE membrane was used. The applied voltages are shown at the bottom in light grey. b I/V curves corresponding to the traces shown in (a). Linear regressions (solid lines) allow calculation of the conductance (1.76 nS (black), 0.99 nS (red) and 0.95 nS (blue)) and reversal potential (RP, indicated by circles and arrows). A negative (positive) RP corresponds to a cation (anion) selectivity. c Permeability ratios, PK+/PCl, calculated from corresponding reversal potentials using the GHK equation. Solid circles correspond to the individual data points. Data are means of 7 (black), 8 (red), and 4 (blue) independent experiments. d Representative Tse5-CT-induced noisy current trace was obtained in a 250/50 mM KCl gradient using the E. coli polar lipid extract to form the membrane. The applied voltage is shown at the bottom in light grey. Current records in (a) and (d) were digitally filtered with 500 Hz using a low-pass 8-pole Bessel filter for better visualisation.
Fig. 6
Fig. 6. Tse5-CT toxicity is accentuated in the presence of NaCl and LiCl.
P. putida growth curves expressed in CFU mL−1 with and without m-Toluic acid (TA) induction (Tse5-CT+/Tse5-CT−). Each panel shows bacterial growth in liquid medium supplemented with a different salt: 150 mM NaCl (a), 20 mM LiCl (b), 150 mM MgCl2 (c), 150 mM KCl (d), and 75 mM MgCl2 (e). The differential growth with and without Tse5-CT expression in each liquid medium is indicated in panel (f). Bars show mean ± SD (n = 3 independent experiments; ns if p > 0,05, * if p < 0.05, ** if p ≤ 0.01, one-way ANOVA (Brown–Forsythe ANOVA test) with Dunnett´s T3 multiple comparisons test). Some error bars in ae are not visible due to overlap with symbols. Source data are provided as a Source Data file.

Similar articles

Cited by

References

    1. Sibley CD, et al. A polymicrobial perspective of pulmonary infections exposes an enigmatic pathogen in cystic fibrosis patients. Proc. Natl Acad. Sci. USA. 2008;105:15070–15075. - PMC - PubMed
    1. Peters BM, Jabra-Rizk MA, O’May GA, William Costerton J, Shirtliff ME. Polymicrobial interactions: impact on pathogenesis and human disease. Clin. Microbiol. Rev. 2012;25:193–213. - PMC - PubMed
    1. Bingle LE, Bailey CM, Pallen MJ. Type VI secretion: a beginner’s guide. Curr. Opin. Microbiol. 2008;11:3–8. - PubMed
    1. Pukatzki S, McAuley SB, Miyata ST. The type VI secretion system: translocation of effectors and effector-domains. Curr. Opin. Microbiol. 2009;12:11–17. - PubMed
    1. Cianfanelli FR, Monlezun L, Coulthurst SJ. Aim, load, fire: the Type VI secretion system, a bacterial nanoweapon. Trends Microbiol. 2016;24:51–62. - PubMed

Publication types

MeSH terms

Substances