

Anthocyanin improves kidney function in diabetic kidney disease by regulating amino acid metabolism
- PMID: 36335368
- PMCID: PMC9636632
- DOI: 10.1186/s12967-022-03717-9
Anthocyanin improves kidney function in diabetic kidney disease by regulating amino acid metabolism
Abstract
Background: Diabetic kidney disease (DKD) is among the most important causes for chronic kidney disease. Anthocyanins (ANT) are polyphenolic compounds present in various food and play an important role in ameliorating hyperglycemia and insulin sensitivity. However, the effects of ANT in DKD are still poorly understood. This study aimed to investigate the effect of ANT (cyanidin-3-O-glucoside [C3G]) on the renal function of DKD, and whether the anti-DKD effect of ANT is related to metabolic pathways.
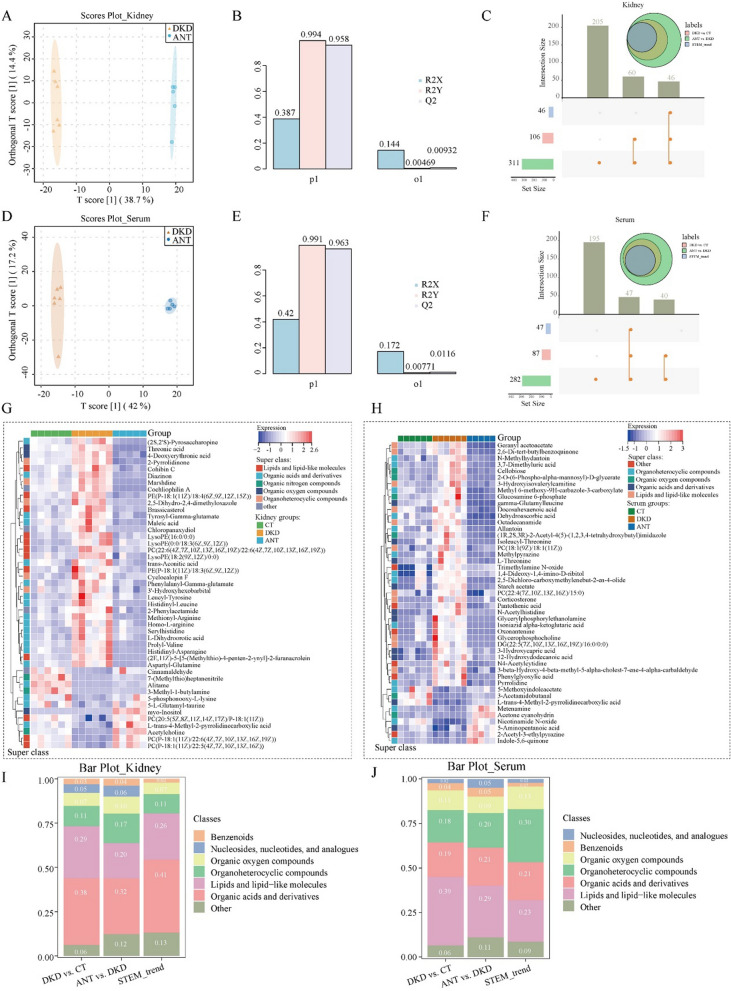
Methods: To explore the role of ANT in DKD, we performed the examination of blood glucose, renal function, and histopathology. As for the mechanism, we designed the label-free quantification proteomics and nontargeted metabolomics analysis for kidney and serum. Subsequently, we revealed the anti-DKD effect of ANT through the bioinformatic analysis.
Results: We showed that the fasting blood glucose level (- 6.1 mmol/L, P = 0.037), perimeter of glomerular lesions (- 24.1 μm, P = 0.030), fibrosis score of glomerular (- 8.8%, P = 0.002), and kidney function (Cystatin C: - 701.4 pg/mL, P = 0.043; urine creatinine: - 701.4 mmol/L, P = 0.032) were significantly alleviated in DKD mice after ANT treatment compared to untreated in the 20th week. Further, proteins and metabolites in the kidneys of DKD mice were observed to be dramatically altered due to changes in amino acid metabolism with ANT treatment; mainly, taurine and hypotaurine metabolism pathway was upregulated (P = 0.0001, t value = 5.97). Furthermore, upregulated tryptophan metabolism (P < 0.0001, t value = 5.94) and tyrosine metabolism (P = 0.0037, t value = 2.91) pathways had effects on serum of DKD mice as responsed ANT regulating.
Conclusions: Our results suggested that prevention of the progression of DKD by ANT could be related to the regulation of amino acid metabolism. The use of dietary ANT may be one of the dietary strategies to prevent and treat DKD.
Keywords: Amino acid metabolism; Chronic kidney disease; Diabetic nephropathy; Metabolomics; Proteomics.
© 2022. The Author(s).
Conflict of interest statement
The authors declare that they have no competing interests.
Figures


Similar articles
-
Cyanidin-3-O-glucoside ameliorates diabetic nephropathy through regulation of glutathione pool.Biomed Pharmacother. 2018 Jul;103:1223-1230. doi: 10.1016/j.biopha.2018.04.137. Epub 2018 May 7. Biomed Pharmacother. 2018. PMID: 29864902
-
SGLT2 inhibitor improves kidney function and morphology by regulating renal metabolism in mice with diabetic kidney disease.J Diabetes Complications. 2024 Feb;38(2):108652. doi: 10.1016/j.jdiacomp.2023.108652. Epub 2023 Nov 21. J Diabetes Complications. 2024. PMID: 38190779
-
Tangshen Formula alleviates inflammatory injury against aged diabetic kidney disease through modulating gut microbiota composition and related amino acid metabolism.Exp Gerontol. 2024 Apr;188:112393. doi: 10.1016/j.exger.2024.112393. Epub 2024 Mar 10. Exp Gerontol. 2024. PMID: 38458480
-
Probiotics improve renal function, glucose, lipids, inflammation and oxidative stress in diabetic kidney disease: a systematic review and meta-analysis.Ren Fail. 2022 Dec;44(1):862-880. doi: 10.1080/0886022X.2022.2079522. Ren Fail. 2022. PMID: 35611435 Free PMC article.
-
Metabolic Homeostasis of Amino Acids and Diabetic Kidney Disease.Nutrients. 2022 Dec 30;15(1):184. doi: 10.3390/nu15010184. Nutrients. 2022. PMID: 36615841 Free PMC article. Review.
Cited by
-
The neuromodulatory effects of flavonoids and gut Microbiota through the gut-brain axis.Front Cell Infect Microbiol. 2023 Jun 23;13:1197646. doi: 10.3389/fcimb.2023.1197646. eCollection 2023. Front Cell Infect Microbiol. 2023. PMID: 37424784 Free PMC article. Review.
-
Integrative analysis of mitochondrial and immune pathways in diabetic kidney disease: identification of AASS and CASP3 as key predictors and therapeutic targets.Ren Fail. 2025 Dec;47(1):2465811. doi: 10.1080/0886022X.2025.2465811. Epub 2025 Feb 23. Ren Fail. 2025. PMID: 39988817 Free PMC article.
-
The Mechanism Underlying the Hypoglycemic Effect of Epimedin C on Mice with Type 2 Diabetes Mellitus Based on Proteomic Analysis.Nutrients. 2023 Dec 21;16(1):25. doi: 10.3390/nu16010025. Nutrients. 2023. PMID: 38201855 Free PMC article.
-
Clinical efficacy and safety of Xuefu Zhuyu decoction in the treatment of diabetic kidney disease: A protocol for systematic review and meta-analysis.Medicine (Baltimore). 2022 Dec 23;101(51):e32359. doi: 10.1097/MD.0000000000032359. Medicine (Baltimore). 2022. PMID: 36595809 Free PMC article.
-
Cyanidin-3-O-glucoside ameliorates hydrogen peroxide-induced oxidative stress by regulating HMGCR-mediated cholesterol anabolism in HEK-293T cells.Food Sci Nutr. 2024 Jul 1;12(9):6673-6689. doi: 10.1002/fsn3.4231. eCollection 2024 Sep. Food Sci Nutr. 2024. PMID: 39554373 Free PMC article.
References
Publication types
MeSH terms
Substances
LinkOut - more resources
Full Text Sources
Medical
Research Materials
