. 2022 Dec;37(12):1233-1250.
doi: 10.1007/s10654-022-00932-y. Epub 2022 Nov 6.

How well do covariates perform when adjusting for sampling bias in online COVID-19 research? Insights from multiverse analyses

Collaborators, Affiliations

How well do covariates perform when adjusting for sampling bias in online COVID-19 research? Insights from multiverse analyses

Keven Joyal-Desmarais et al. Eur J Epidemiol. 2022 Dec.

Abstract

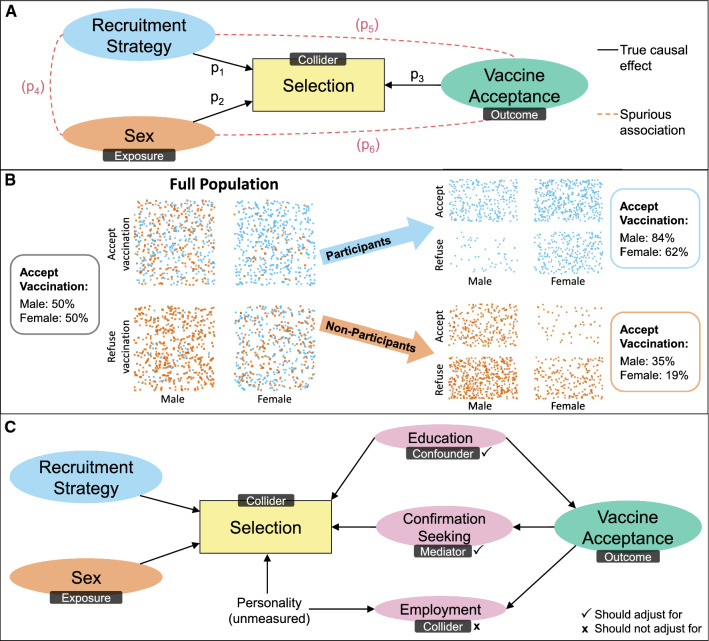
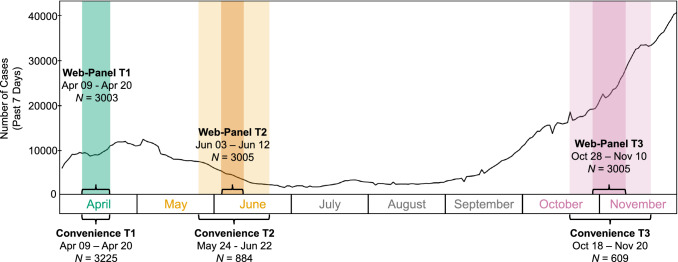
COVID-19 research has relied heavily on convenience-based samples, which-though often necessary-are susceptible to important sampling biases. We begin with a theoretical overview and introduction to the dynamics that underlie sampling bias. We then empirically examine sampling bias in online COVID-19 surveys and evaluate the degree to which common statistical adjustments for demographic covariates successfully attenuate such bias. This registered study analysed responses to identical questions from three convenience and three largely representative samples (total N = 13,731) collected online in Canada within the International COVID-19 Awareness and Responses Evaluation Study ( www.icarestudy.com ). We compared samples on 11 behavioural and psychological outcomes (e.g., adherence to COVID-19 prevention measures, vaccine intentions) across three time points and employed multiverse-style analyses to examine how 512 combinations of demographic covariates (e.g., sex, age, education, income, ethnicity) impacted sampling discrepancies on these outcomes. Significant discrepancies emerged between samples on 73% of outcomes. Participants in the convenience samples held more positive thoughts towards and engaged in more COVID-19 prevention behaviours. Covariates attenuated sampling differences in only 55% of cases and increased differences in 45%. No covariate performed reliably well. Our results suggest that online convenience samples may display more positive dispositions towards COVID-19 prevention behaviours being studied than would samples drawn using more representative means. Adjusting results for demographic covariates frequently increased rather than decreased bias, suggesting that researchers should be cautious when interpreting adjusted findings. Using multiverse-style analyses as extended sensitivity analyses is recommended.

Keywords: COVID-19; Collider bias; Covariate adjustment; Multiverse analysis; Sampling bias; Selection bias.


Conflict of interest statement

Kim Lavoie has served on the advisory board for Schering‐Plough, Takeda, AbbVie, Almirall, Janssen, GSK, Novartis, Boehringer Ingelheim (BI), and Sojecci Inc, and has received sponsorship for investigator‐generated research grants from GlaxoSmithKline (GSK) and AbbVie, speaker fees from GSK, Astra‐Zeneca, Astellas, Novartis, Takeda, AbbVie, Merck, Boehringer Ingelheim, Bayer, Pfizer, Xfacto, and Air Liquide, and support for educational materials from Merck. Urška Košir has received speaker fees from Merck. None of these engagements are related to the current article.

Figures

Fig. 1
Fig. 1
Examples of sampling bias and the roles of covariates. The black square around selection indicates that analyses are limited to individuals who participated (either through selection by a study’s design or through self-selection). Selection is a collider, a common effect of other variables. Panel A is an example of sampling bias shown through a causal diagram. Here, recruitment strategy (convenience vs. probability), along with an exposure (sex) and an outcome (vaccine acceptance) each influence a person’s selection into a study. Though the three variables are not causally linked, conditioning on selection (a collider) leads them to be associated through a process known as collider bias. Panel B is a simulated example of the dynamic in Panel A where 50% of a population is accepting of vaccination, and this ratio is equivalent for male and female individuals. However, both vaccine acceptance and sex predict selection. Having data only from people who participate will lead an analyst to overestimate vaccine acceptance and see a spurious association between sex and vaccine acceptance such that female (vs. male) participants show lower levels of acceptance (also see Box 1). Panel C provides example roles covariates can play in an association between an outcome (vaccine acceptance) and selection. Adjusting analyses for a mediator (confirmation seeking) or a confounder (education) can both reduce sampling bias. However, adjusting for another collider (employment) can introduce further collider bias. Thus, analysts must be mindful of the causal role of covariates in relation to their exposure-outcome links of interest
Fig. 2
Fig. 2
Contextualized timeline for our six samples, describing date (x-axis) and the number of COVID-19 cases detected in Canada (y-axis). T1 = Time 1; T2 = Time 2; T3 = Time 3. Surveys were conducted in 2020. Survey distribution began during the first wave of COVID-19 infections in Canada, and the third set of surveys occurred during an early portion of the second wave. Data to plot cases were obtained from the Government of Canada’s Public Health Infobase
Fig. 3
Fig. 3
Inferential results (unadjusted regression models) evaluating sampling discrepancies between the convenience and web-panel surveys on each outcome (reference group is the web panel). N = Sample size; Est = unstandardized estimate; CI = confidence interval; d = Cohen’s d; R2 = R2 coefficient of determination; T1 = Time 1; T2 = Time 2; T3 = Time 3; C = concerns; B = Behaviour. Plot created using the forestplot package in R [72]
Fig. 4
Fig. 4
Ordered caterpillar plots summarizing specification curve analyses. Plots were created using the specr package in R [54]. Instructions for reading the plots are provided at the bottom
Fig. 5
Fig. 5
Ordered caterpillar plots summarizing specification curve analyses (continued). Plots were created using the specr package in R [54]. Figure 4 provides instructions for reading the plots

References

    1. Tyrer S, Heyman B. Sampling in epidemiological research: issues, hazards and pitfalls. BJPsych Bulletin. 2016;40:57–60. doi: 10.1192/pb.bp.114.050203. - DOI - PMC - PubMed
    1. Sarstedt M, Bengart P, Shaltoni AM, Lehmann S. The use of sampling methods in advertising research: A gap between theory and practice. Int J Advert. 2018;37:650–663. doi: 10.1080/02650487.2017.1348329. - DOI
    1. Kennedy EB, Jensen EA, Jensen AM. Methodological considerations for survey-based research during emergencies and public health crises: Improving the quality of evidence & science communication. Front Commun. 2021;6:226.
    1. Elwert F, Winship C. Endogenous selection bias: the problem of conditioning on a collider variable. Ann Rev Sociol. 2014;40:31–53. doi: 10.1146/annurev-soc-071913-043455. - DOI - PMC - PubMed
    1. Griffith GJ, Morris TT, Tudball MJ, et al. Collider bias undermines our understanding of COVID-19 disease risk and severity. Nat Commun. 2020;11:1–12. doi: 10.1038/s41467-020-19478-2. - DOI - PMC - PubMed