Randomized Controlled Trial
. 2023 Jan 3;147(1):8-19.
doi: 10.1161/CIRCULATIONAHA.122.062714. Epub 2022 Nov 6.

Survival After Invasive or Conservative Management of Stable Coronary Disease

Collaborators, Affiliations
Randomized Controlled Trial

Survival After Invasive or Conservative Management of Stable Coronary Disease

Judith S Hochman et al. Circulation. .

Abstract

Background: The ISCHEMIA trial (International Study of Comparative Health Effectiveness With Medical and Invasive Approaches) compared an initial invasive versus an initial conservative management strategy for patients with chronic coronary disease and moderate or severe ischemia, with no major difference in most outcomes during a median of 3.2 years. Extended follow-up for mortality is ongoing.

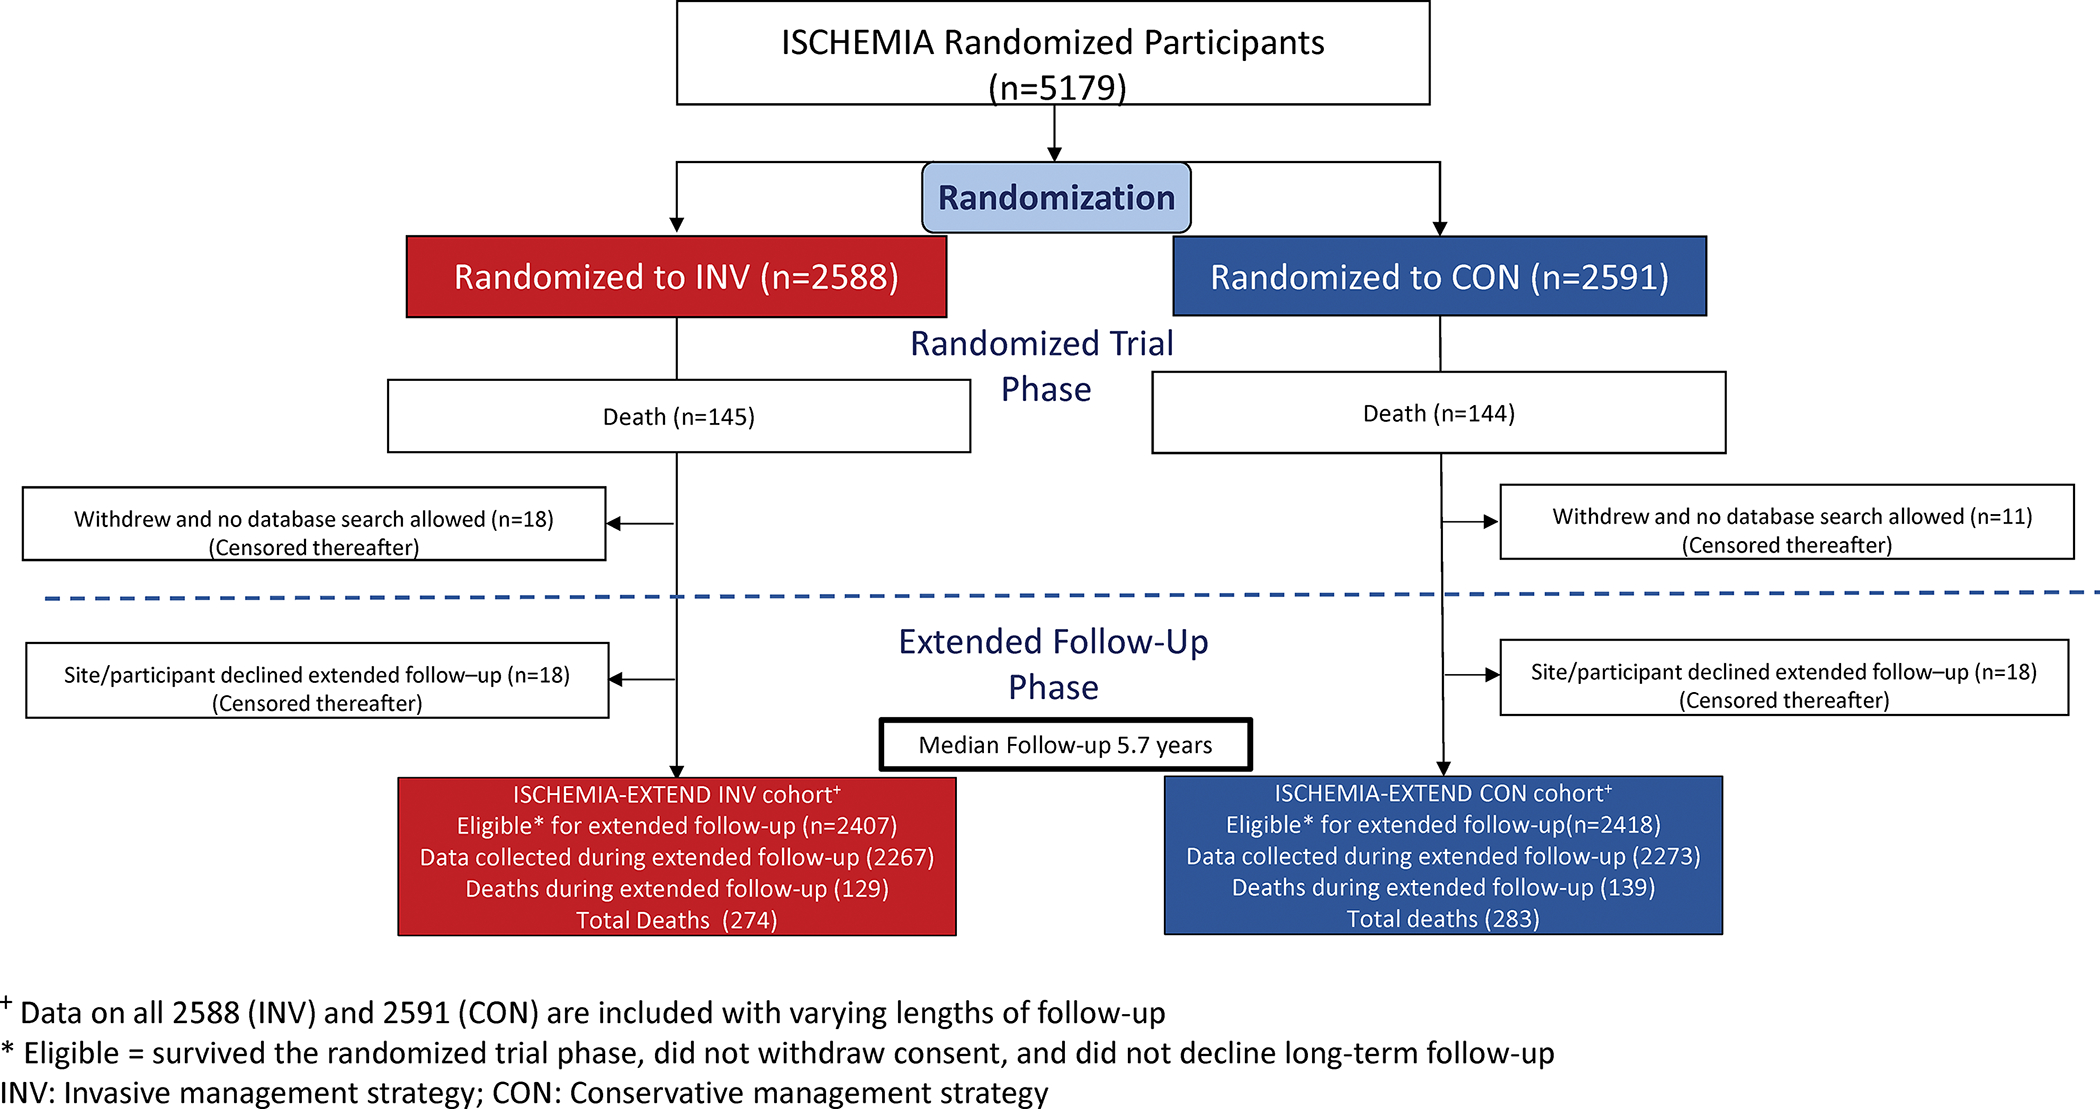
Methods: ISCHEMIA participants were randomized to an initial invasive strategy added to guideline-directed medical therapy or a conservative strategy. Patients with moderate or severe ischemia, ejection fraction ≥35%, and no recent acute coronary syndromes were included. Those with an unacceptable level of angina were excluded. Extended follow-up for vital status is being conducted by sites or through central death index search. Data obtained through December 2021 are included in this interim report. We analyzed all-cause, cardiovascular, and noncardiovascular mortality by randomized strategy, using nonparametric cumulative incidence estimators, Cox regression models, and Bayesian methods. Undetermined deaths were classified as cardiovascular as prespecified in the trial protocol.

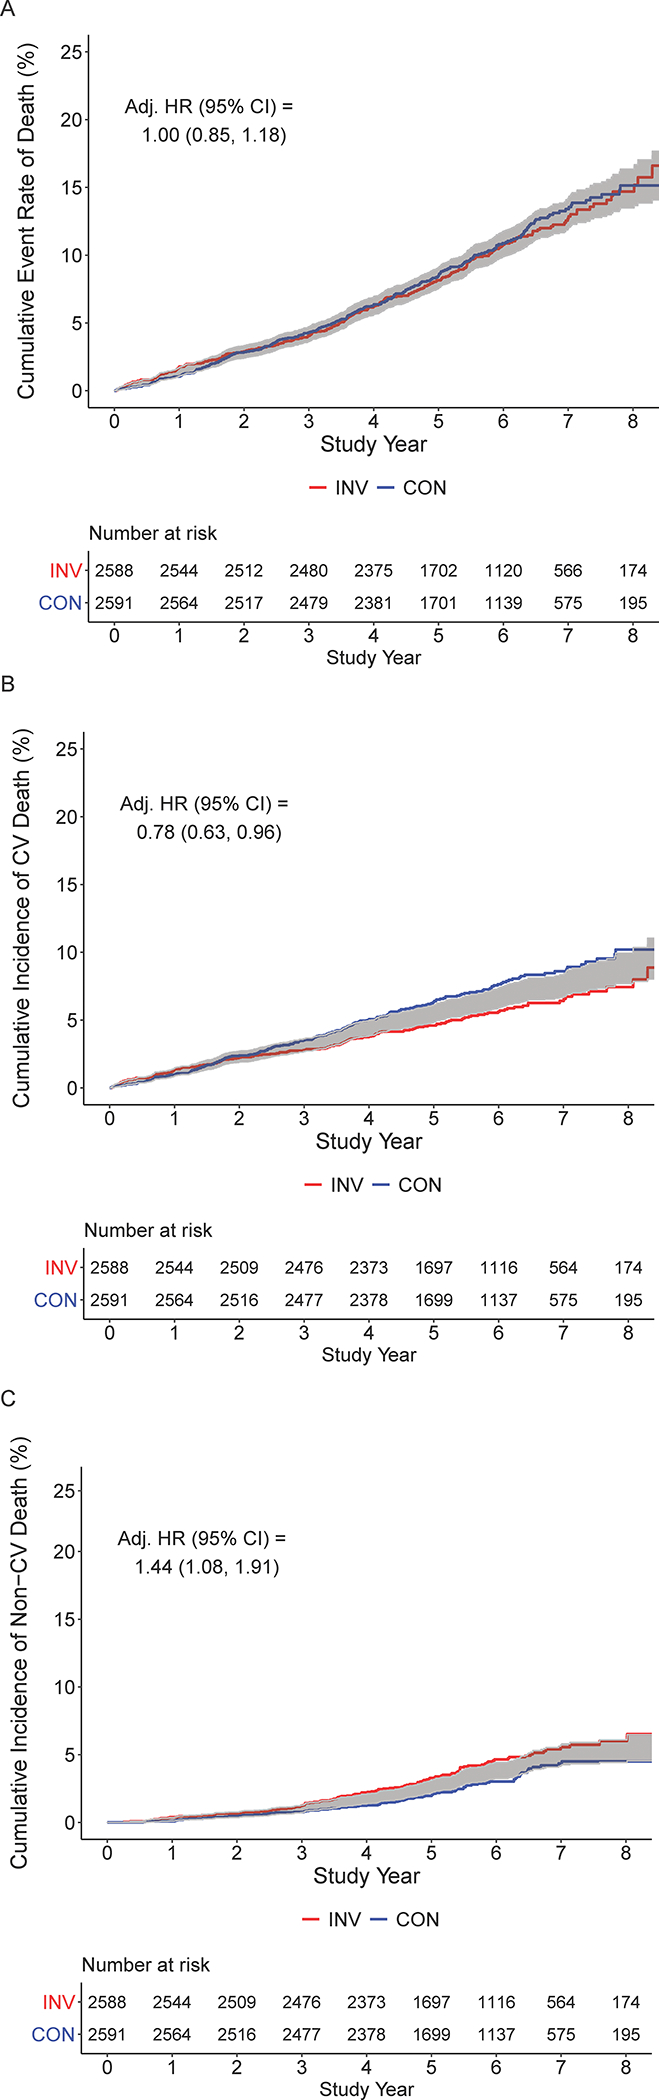
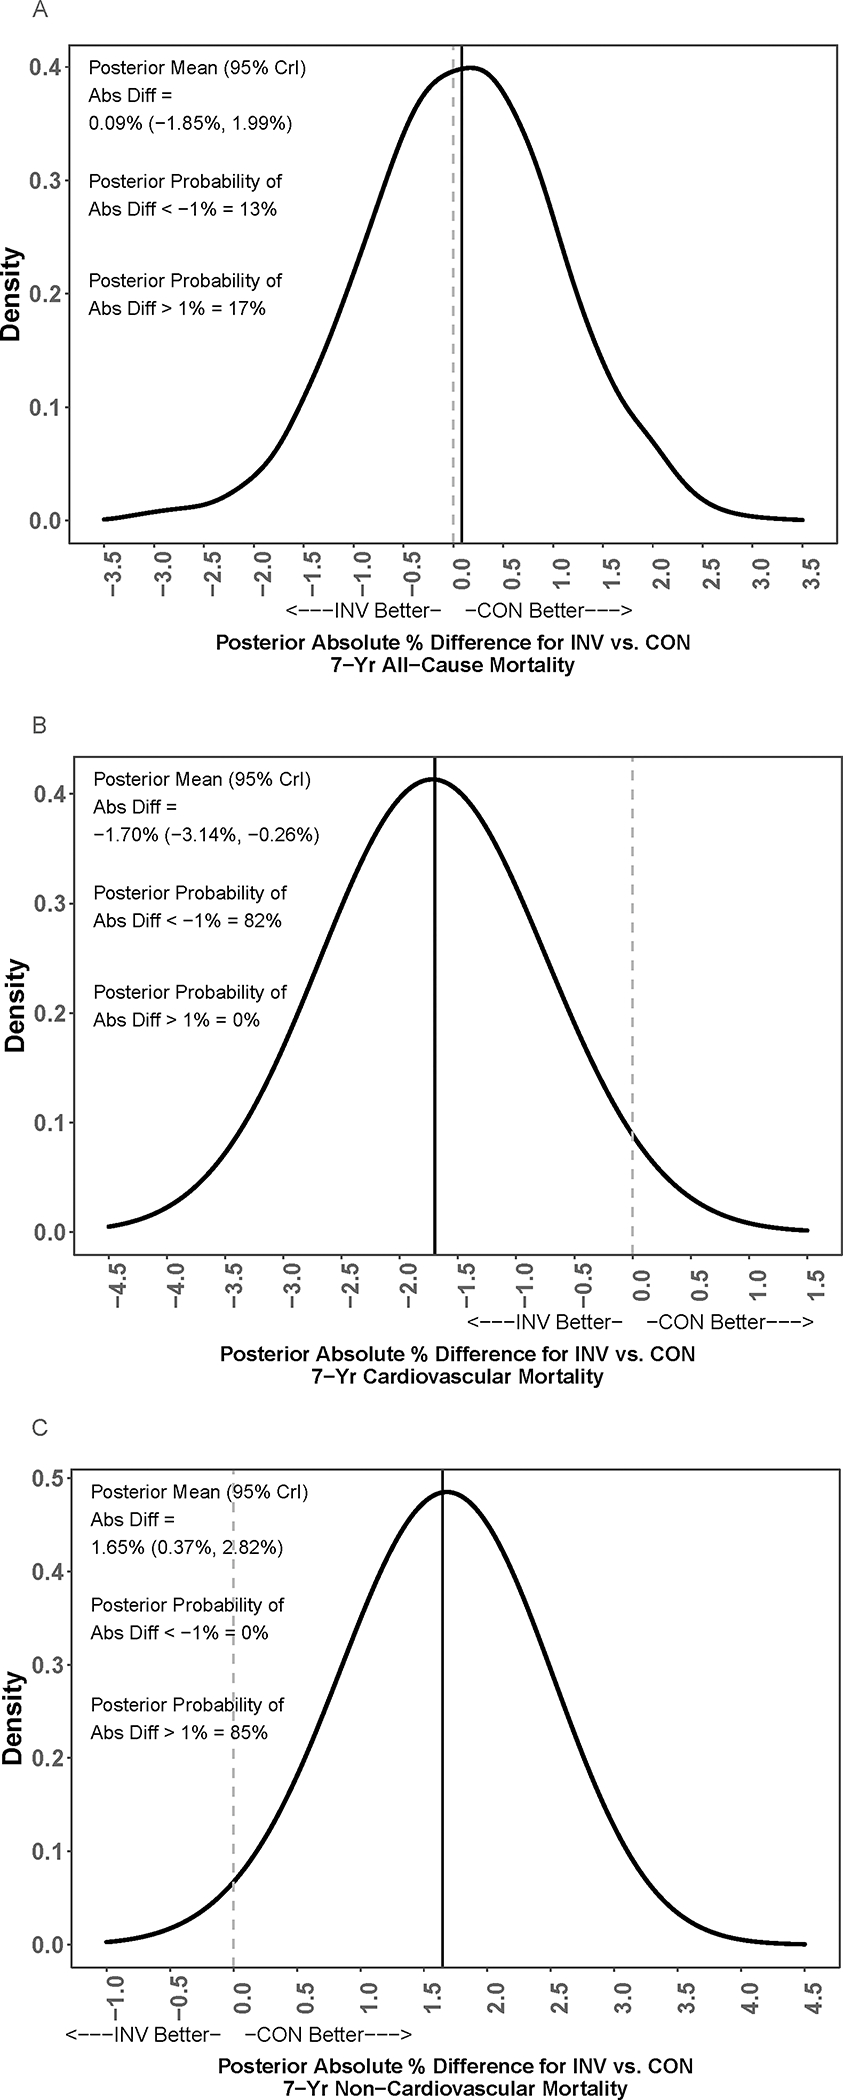
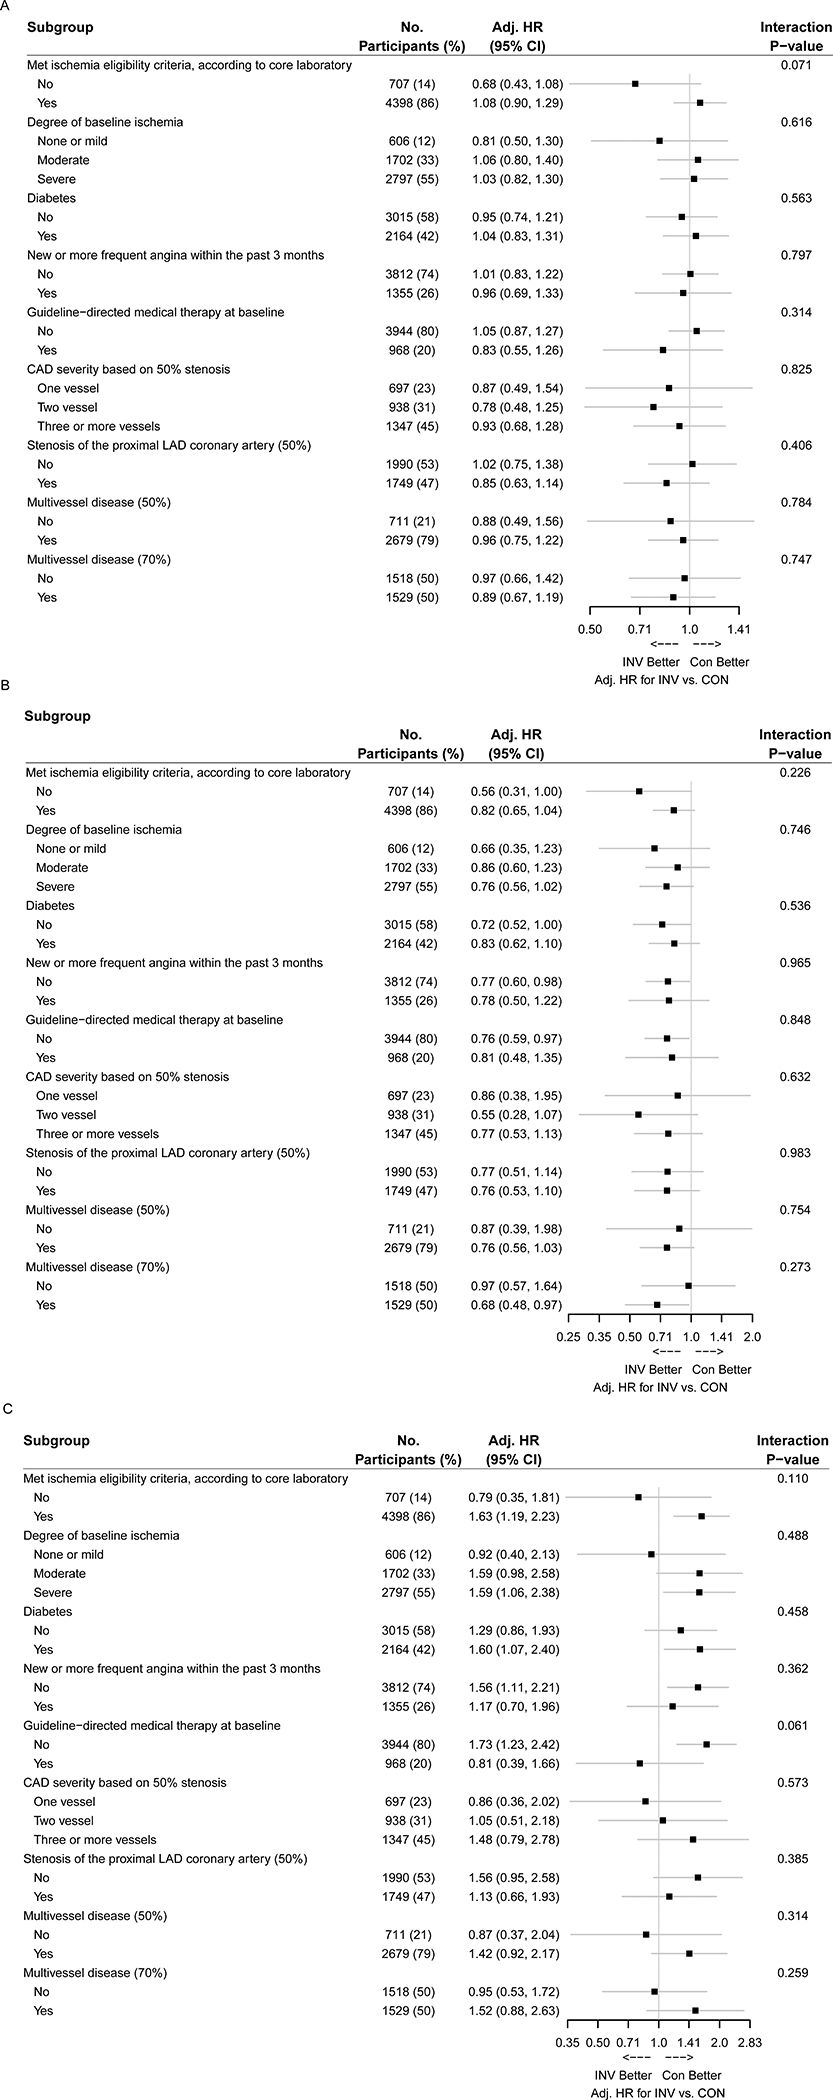
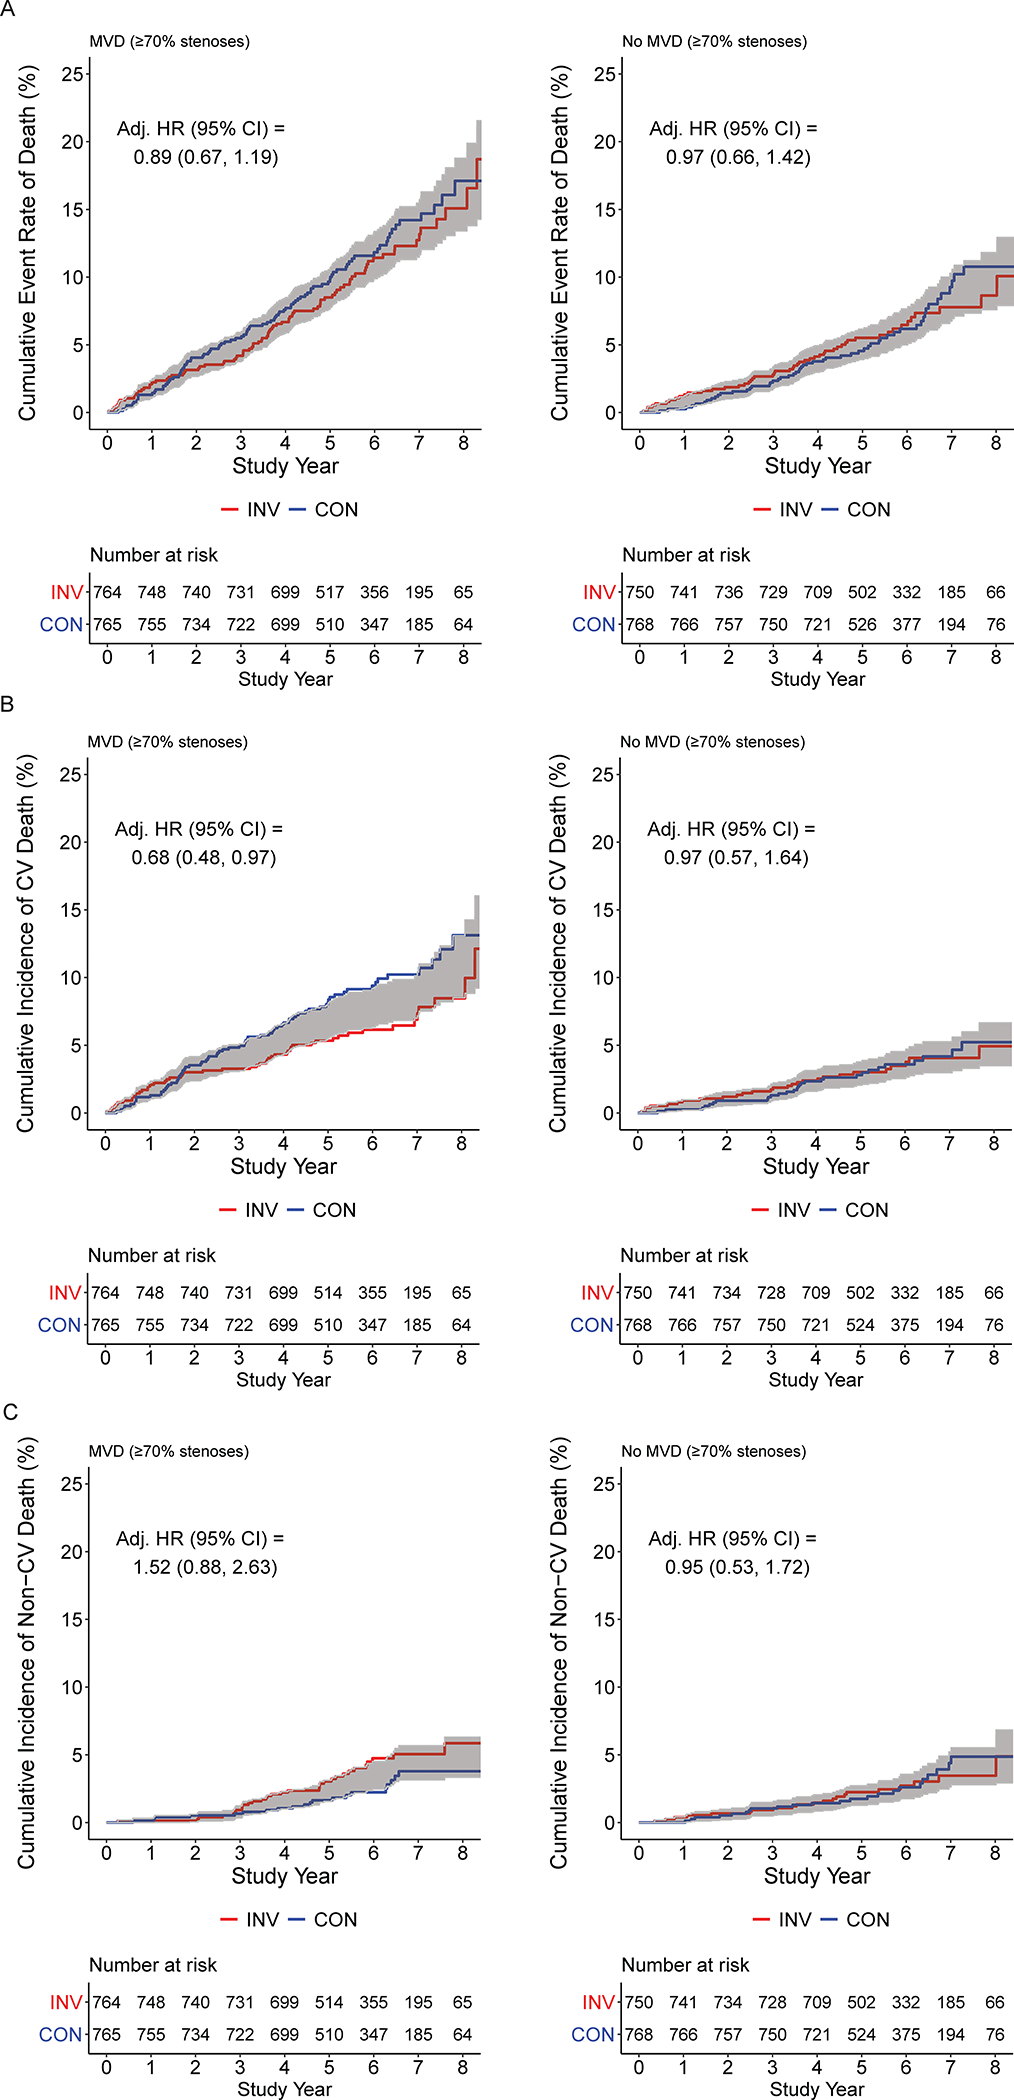
Results: Baseline characteristics for 5179 original ISCHEMIA trial participants included median age 65 years, 23% women, 16% Hispanic, 4% Black, 42% with diabetes, and median ejection fraction 0.60. A total of 557 deaths accrued during a median follow-up of 5.7 years, with 268 of these added in the extended follow-up phase. This included a total of 343 cardiovascular deaths, 192 noncardiovascular deaths, and 22 unclassified deaths. All-cause mortality was not different between randomized treatment groups (7-year rate, 12.7% in invasive strategy, 13.4% in conservative strategy; adjusted hazard ratio, 1.00 [95% CI, 0.85-1.18]). There was a lower 7-year rate cardiovascular mortality (6.4% versus 8.6%; adjusted hazard ratio, 0.78 [95% CI, 0.63-0.96]) with an initial invasive strategy but a higher 7-year rate of noncardiovascular mortality (5.6% versus 4.4%; adjusted hazard ratio, 1.44 [95% CI, 1.08-1.91]) compared with the conservative strategy. No heterogeneity of treatment effect was evident in prespecified subgroups, including multivessel coronary disease.

Conclusions: There was no difference in all-cause mortality with an initial invasive strategy compared with an initial conservative strategy, but there was lower risk of cardiovascular mortality and higher risk of noncardiovascular mortality with an initial invasive strategy during a median follow-up of 5.7 years.

Registration: URL: https://www.

Clinicaltrials: gov; Unique identifier: NCT04894877.

Keywords: catheterization; coronary artery bypass; medication therapy management; myocardial ischemia; percutaneous coronary intervention.


Figures

Figure 1.
Figure 1.. Participant Flow (CONSORT).
The top portion, labeled randomized trial phase, shows 5179 randomized to either invasive (red) or conservative (blue) strategy between 2011 and 2018. The original reported trial findings included follow-up through June 2019. Twenty-nine participants withdrew from follow-up during the trial phase with no database search allowable, and 36 participants declined extended follow-up. The median follow-up was 5.7 years. In survival analyses, all 5,179 trial participants are included with participants who withdrew or declined extended follow-up censored at their last known alive date. Numbers at risk at each time point are shown below the horizontal axis on survival plots. Hazard ratios and 95% confidence intervals are derived from adjusted analyses.
Figure 2.
Figure 2.. Cumulative incidence of mortality for invasive versus conservative-strategy.
A. All-cause mortality cumulative event rate by initial randomized assignment to invasive (INV, red) vs conservative (CON, blue) management strategy. The adjusted HR is 1.00 (95% CI: 0.85, 1.18). Numbers at risk for each group are below the x-axis. Shading indicates the half width of the 95% confidence interval for the difference. Lack of overlap between the lines and shading indicates that the 95% CI for the difference excludes zero. B. Cumulative incidence function for cardiovascular mortality by initial randomized assignment to invasive (red) vs conservative (blue) management strategy (accounting for competing risks.) The adjusted HR is 0.78 (95% CI: 0.63, 0.96). For countries collecting cause of death data, cases with undetermined cause of death are included as cardiovascular death, as was prespecified in the trial cardiovascular death definition. In one country, where cause of death data are not available after the end of the trial phase on June 30, 2019, twenty-two deaths post-June 30, 2019 were censored as of June 30, 2019. Numbers at risk for each group are below the horizontal axis. Shading indicates the half width of the 95% confidence interval for the difference. Lack of overlap between the lines and shading indicates that the 95% CI for the difference excludes zero. C. Cumulative incidence function for non-cardiovascular mortality by initial randomized assignment to invasive (red) vs conservative (blue) management strategy, accounting for competing risks. The adjusted HR is 1.44 (95% CI: 1.08, 1.91). For countries collecting cause of death data, unknown cause of death are included as cardiovascular death as was prespecified in the trial definition. In one country where cause of death data are not available after the end of the trial phase on June 30, 2019, twenty-two deaths post-June 30, 2019 were censored as of June 30, 2019. Numbers at risk for each group are below the horizontal axis. Shading indicates the half width of the 95% confidence interval for the difference. Lack of overlap between the lines and shading indicates that the 95% CI for the difference excludes zero.
Figure 3.
Figure 3.. Probability that one strategy is better than another for 7-year all-cause mortality.
Posterior distribution of the adjusted absolute % difference (Abs Diff) in risk of mortality at 7 years for an invasive (INV) vs. conservative (CON) strategy. The gray dashed vertical bar is the null value indicating no difference. The solid black vertical bar is the posterior mean value of the difference. Positive values represent lower mortality for a conservative strategy, and negative values represent lower mortality for an invasive strategy. Panel A shows the posterior distribution of the adjusted absolute % difference (Abs Diff) in risk of all-cause mortality at 7 years for an invasive (INV) vs. conservative (CON) strategy. The solid line is close to the grey-dashed null value line indicating no difference between the groups. Panel B shows the posterior distribution of the adjusted absolute % difference (Abs Diff) in risk of cardiovascular mortality at 7 years for an invasive (INV) vs. conservative (CON) strategy. The concentration of values around −2 indicates a benefit to an invasive over conservative strategy by approximately 2 percentage points. In contrast, in Panel C for non-cardiovascular mortality, the posterior distribution of the adjusted absolute % difference (Abs Diff) in risk of non-cardiovascular mortality at 7 years for an invasive (INV) vs. conservative (CON) strategy shows a concentration of values around +2 indicates a benefit to a conservative over invasive strategy by approximately 2 percentage points.
Figure 4.
Figure 4.. Forest plot for heterogeneity of treatment effect. A. All-cause mortality. B. Cardiovascular mortality. C. Non-cardiovascular mortality.
Adjusted hazard ratios and associated 95% confidence intervals for an invasive (INV) versus conservative (CON) strategy in prespecified subgroups are shown. The subgroup-specific treatment effects are adjusted for sex, age, diabetes status, eGFR, and ejection fraction. Denominators in a given subgroup may vary by data availability. MVD- multivessel disease; MVD (50, 70) indicates the stenosis threshold for determination of a diseased vessel was ≥50% or ≥70%, respectively. For CAD severity based on ≥50% stenosis, 4 participants with 0 vessel disease were excluded from the analysis.
Figure 5.
Figure 5.. All-cause, cardiovascular, and non-cardiovascular mortality among participants by presence of multivessel disease (N=3,047).
For each of all-cause, cardiovascular, and non-cardiovascular, the p values for interaction between the presence or absence of multivessel disease and treatment assignment were >0.05 (see Figure 4). A. Cumulative all-cause mortality rate for participants with CCTA data evaluable for multivessel disease (MVD) (≥70% stenosis) by initial randomized assignment to invasive (INV, red) vs conservative (CON, blue) management strategy, stratified by participants with MVD on CCTA (Panel A) and those without MVD on CCTA (Panel B). B. Cumulative incidence of cardiovascular mortality for participants with CCTA data evaluable for multivessel disease (MVD) (≥70% stenosis) by initial randomized assignment to invasive (red) vs conservative (blue) management strategy, stratified by participants with MVD on CCTA (Panel A) and those without MVD on CCTA (Panel B). C. Cumulative incidence of non-cardiovascular mortality for participants with CCTA data evaluable for multivessel disease (MVD) (≥70% stenosis) by initial randomized assignment to invasive (red) vs conservative (blue) management strategy, stratified by participants with MVD on CCTA (Panel A) and those without MVD on CCTA (Panel B).

Comment in

References

    1. Maron DJ, Hochman JS, Reynolds HR, Bangalore S, O’Brien SM, Boden WE, Chaitman BR, Senior R, López-Sendón J, Alexander KP, et al. Initial Invasive or Conservative Strategy for Stable Coronary Disease. New England Journal of Medicine. 2020;382:1395–1407. - PMC - PubMed
    1. Chaitman BR, Alexander KP, Cyr DD, Berger JS, Reynolds HR, Bangalore S, Boden WE, Lopes RD, Demkow M, Piero Perna G, et al. Myocardial Infarction in the ISCHEMIA Trial: Impact of Different Definitions on Incidence, Prognosis, and Treatment Comparisons. Circulation. 2021;143:790–804. - PMC - PubMed
    1. Sidhu MS, Alexander KP, Huang Z, O’Brien SM, Chaitman BR, Stone GW, Newman JD, Boden WE, Maggioni AP, Steg PG, et al. Causes of cardiovascular and noncardiovascular death in the ISCHEMIA trial. American Heart Journal. 2022;248:72–83. - PMC - PubMed
    1. Reynolds HR, Shaw LJ, Min JK, Page CB, Berman DS, Chaitman BR, Picard MH, Kwong RY, O’Brien SM, Huang Z, et al. Outcomes in the ISCHEMIA Trial Based on Coronary Artery Disease and Ischemia Severity. Circulation. 2021;144:1024–1038. - PMC - PubMed
    1. Maron DJ, Hochman JS, O’Brien SM, Reynolds HR, Boden WE, Stone GW, Bangalore S, Spertus JA, Mark DB, Alexander KP, et al. International Study of Comparative Health Effectiveness with Medical and Invasive Approaches (ISCHEMIA) trial: Rationale and design. American Heart Journal. 2018;201:124–135. - PMC - PubMed

Publication types

Associated data