. 2022 Nov 10;185(23):4347-4360.e17.
doi: 10.1016/j.cell.2022.09.037. Epub 2022 Oct 4.

A mechanism for SARS-CoV-2 RNA capping and its inhibition by nucleotide analog inhibitors

Affiliations

A mechanism for SARS-CoV-2 RNA capping and its inhibition by nucleotide analog inhibitors

Liming Yan et al. Cell. .

Abstract

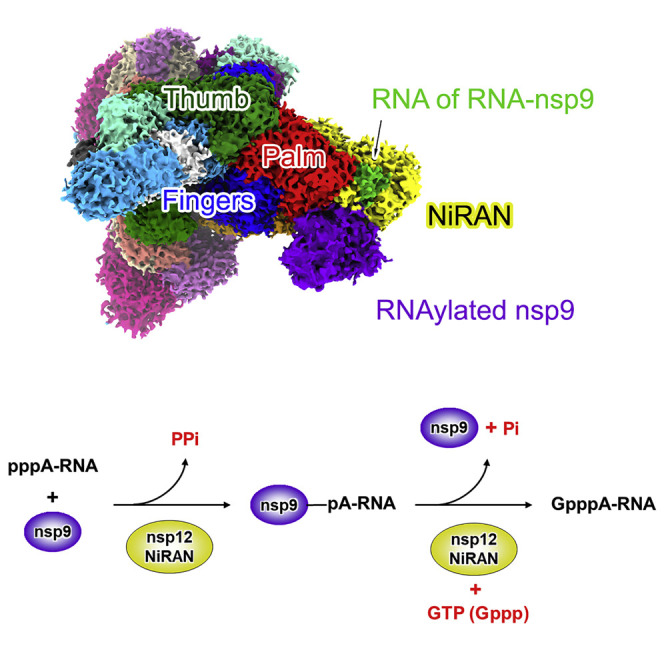
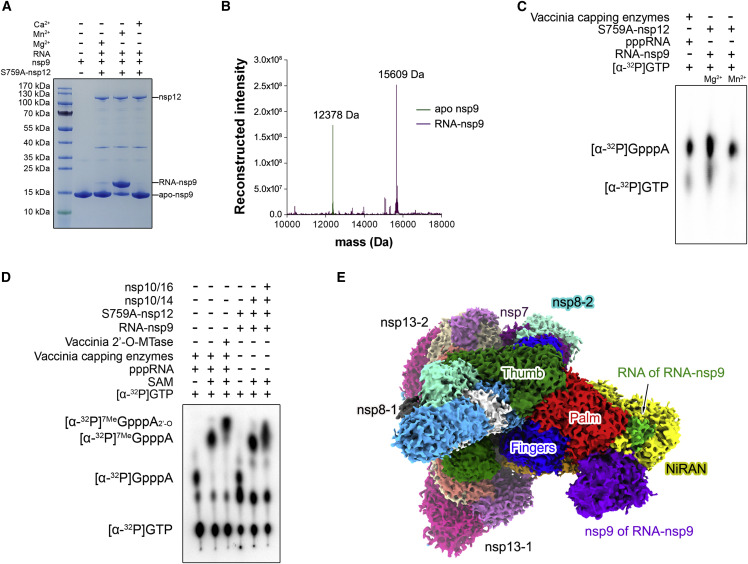
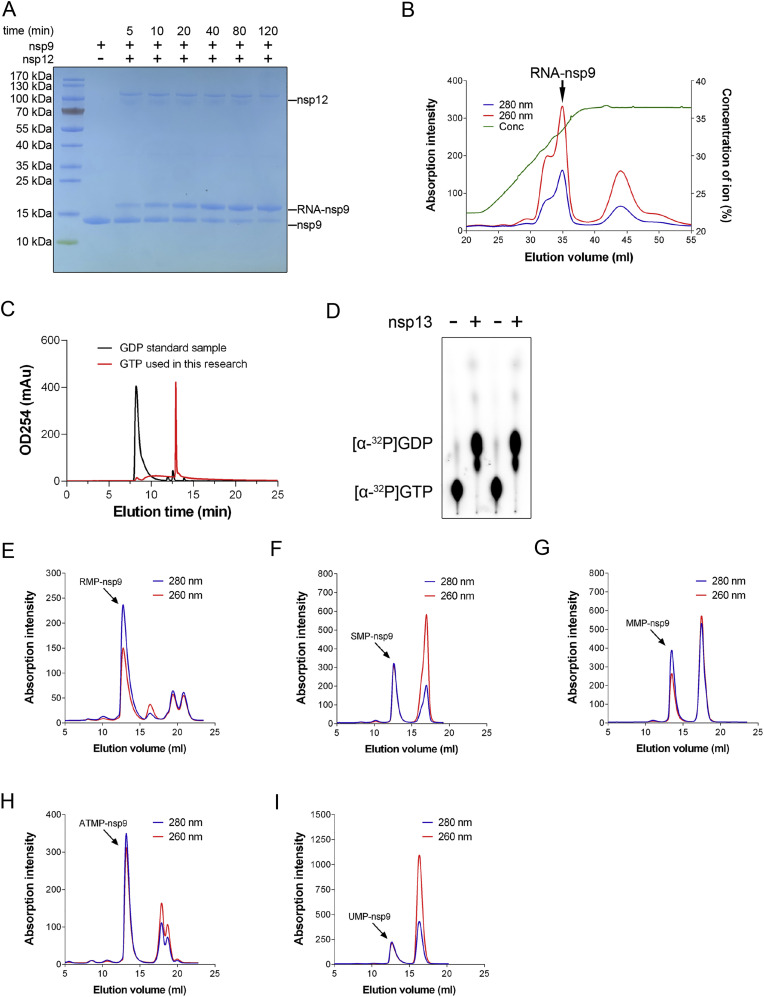
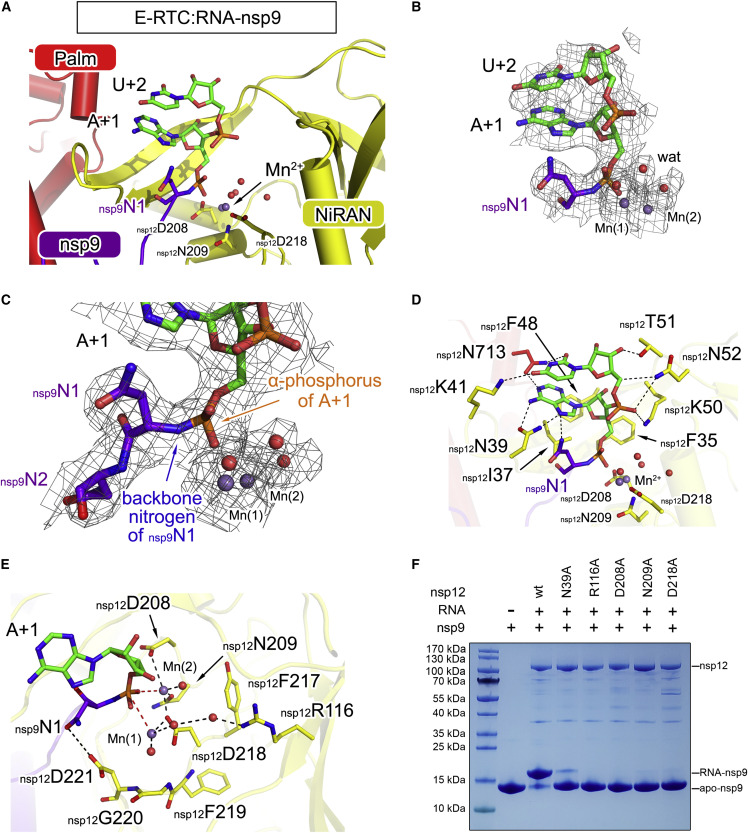
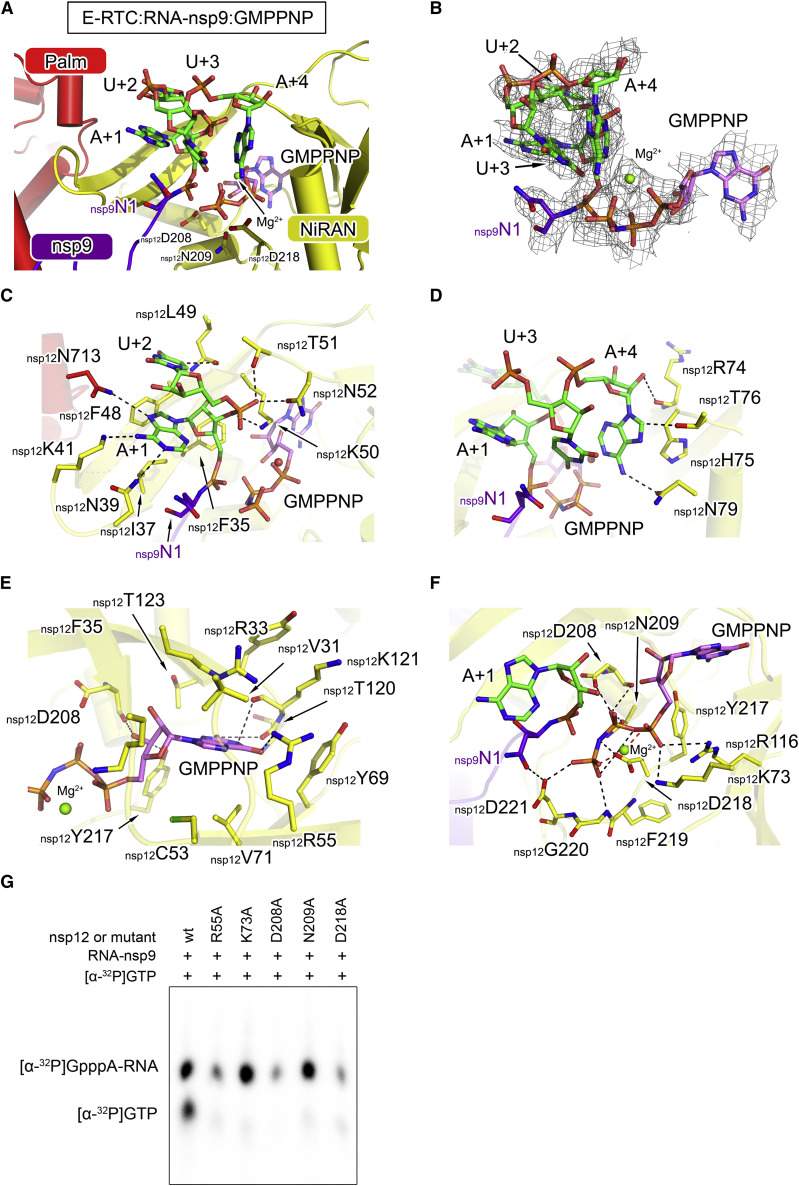
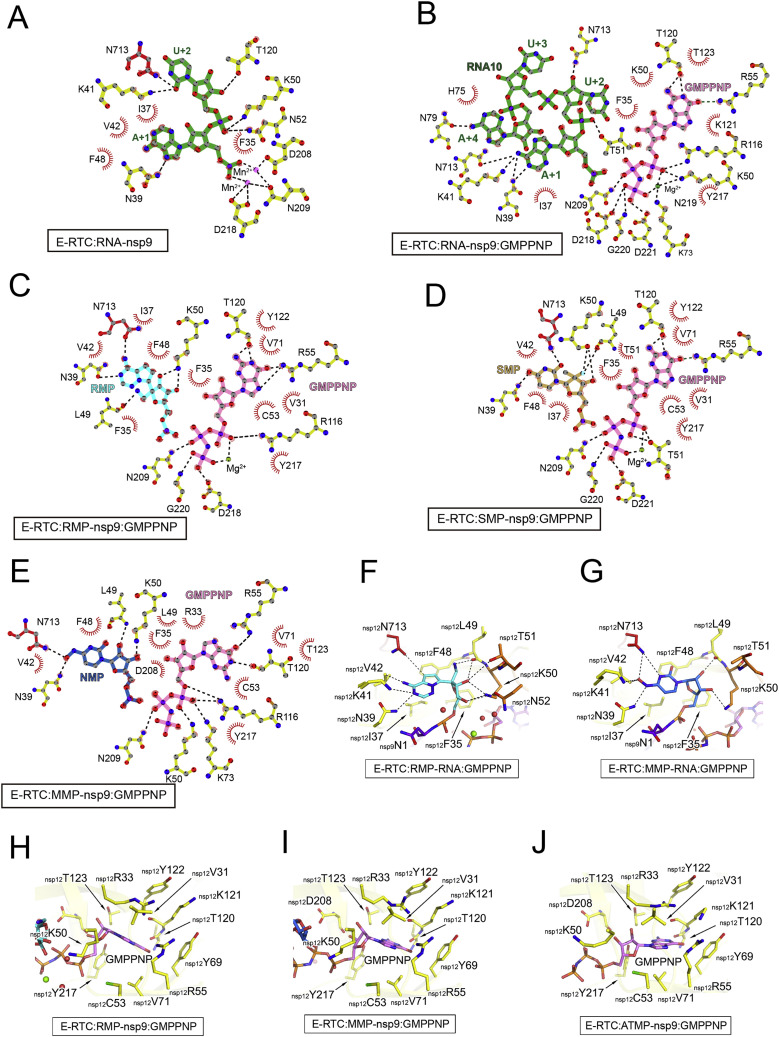
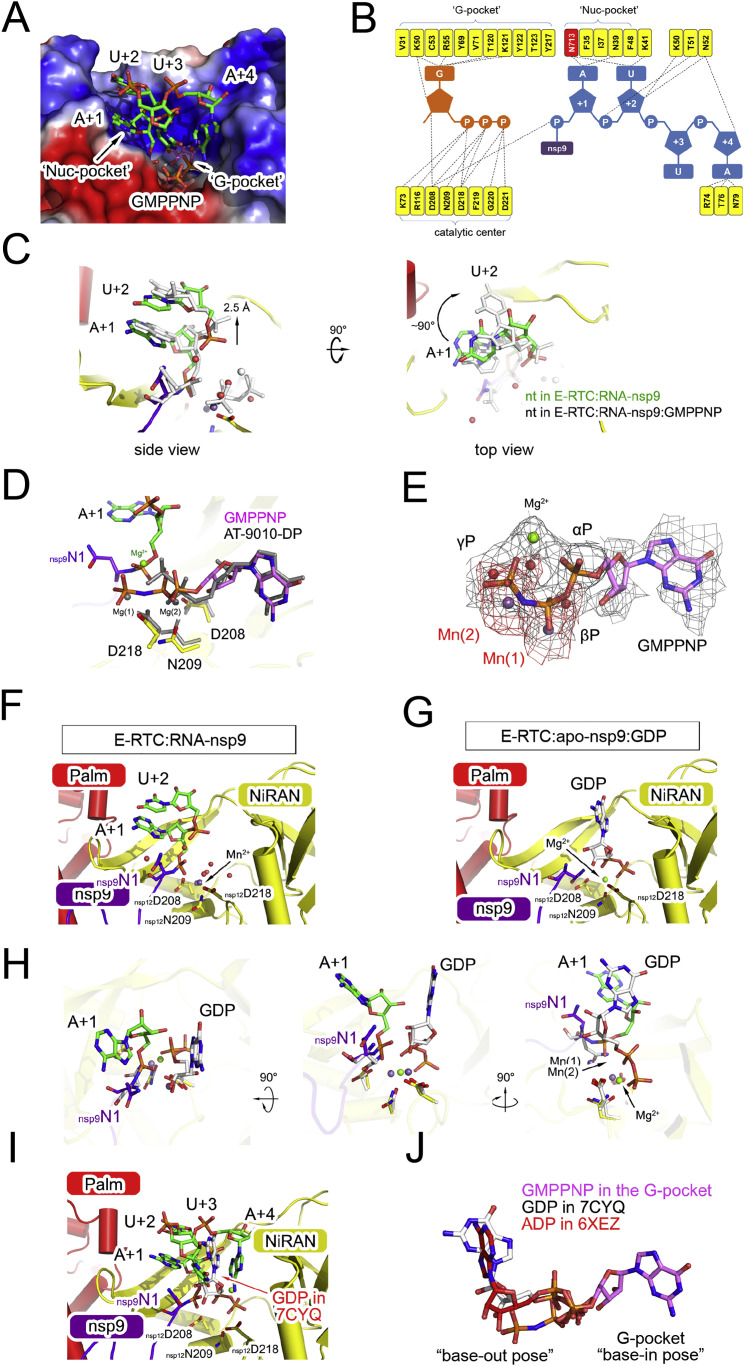
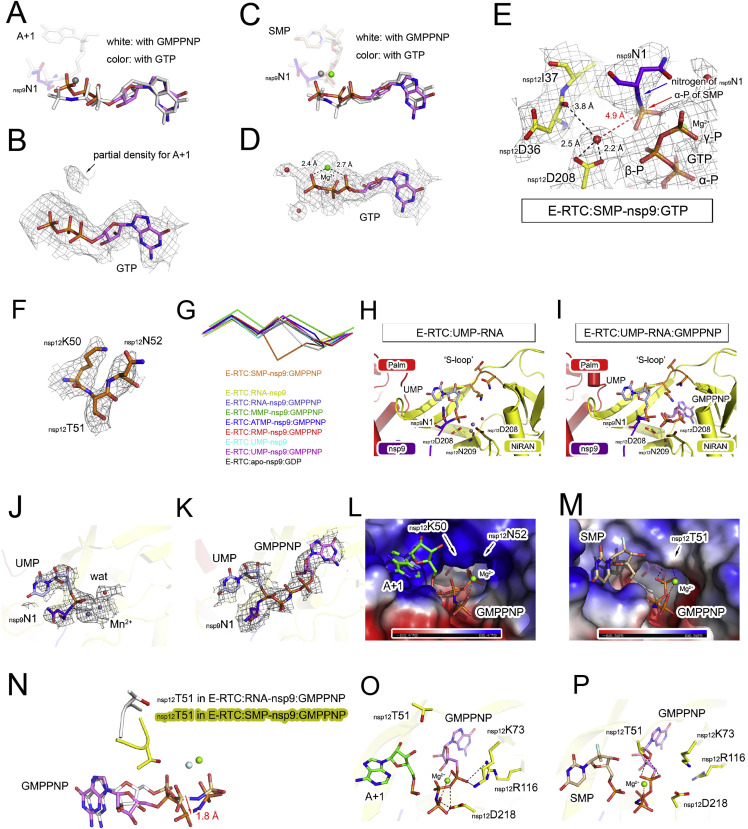
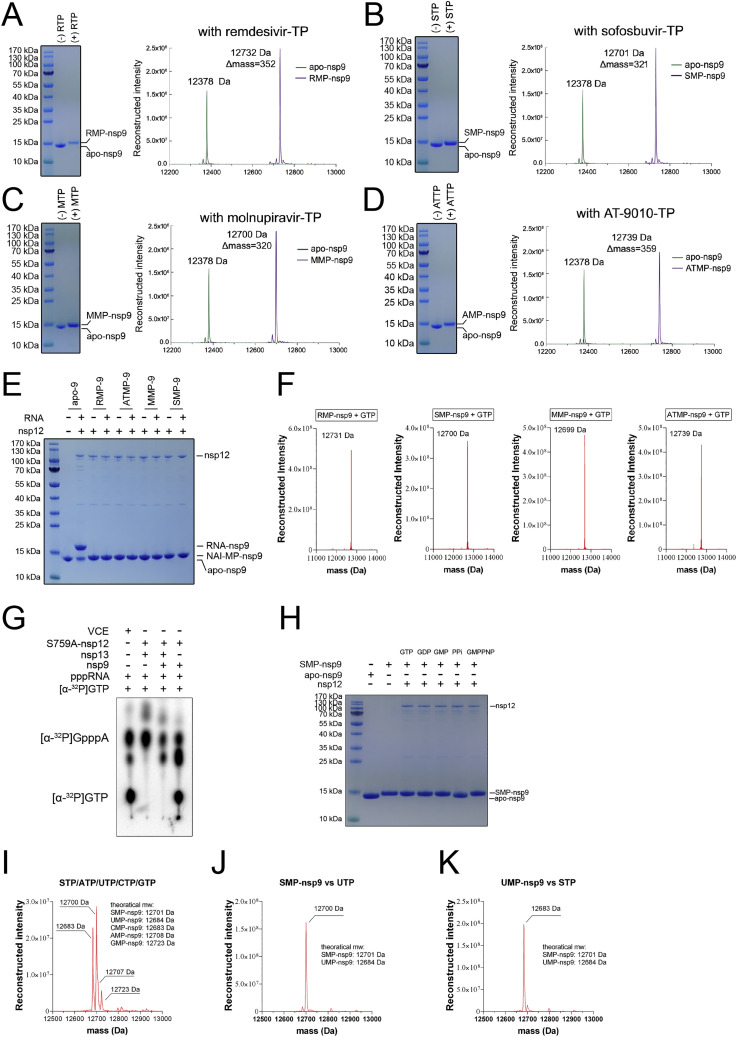
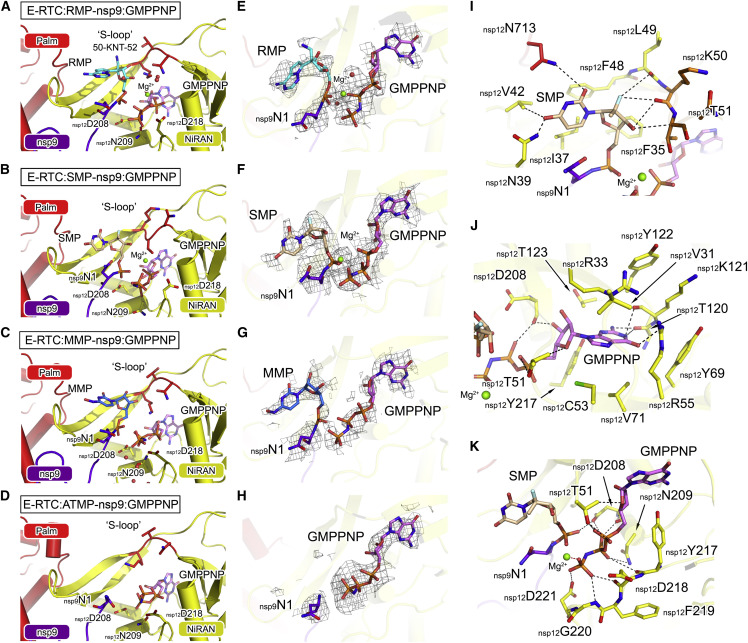
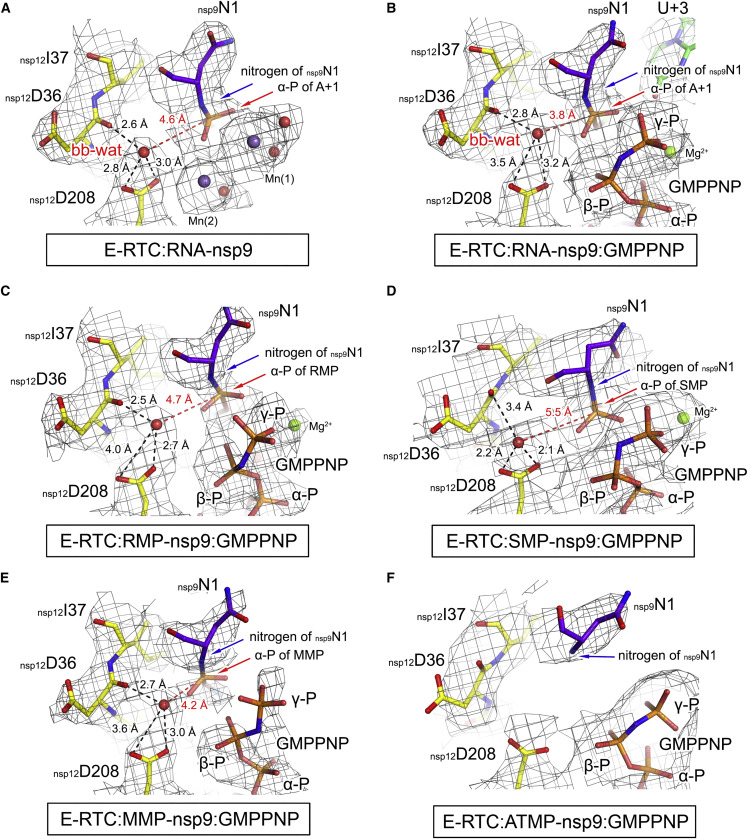
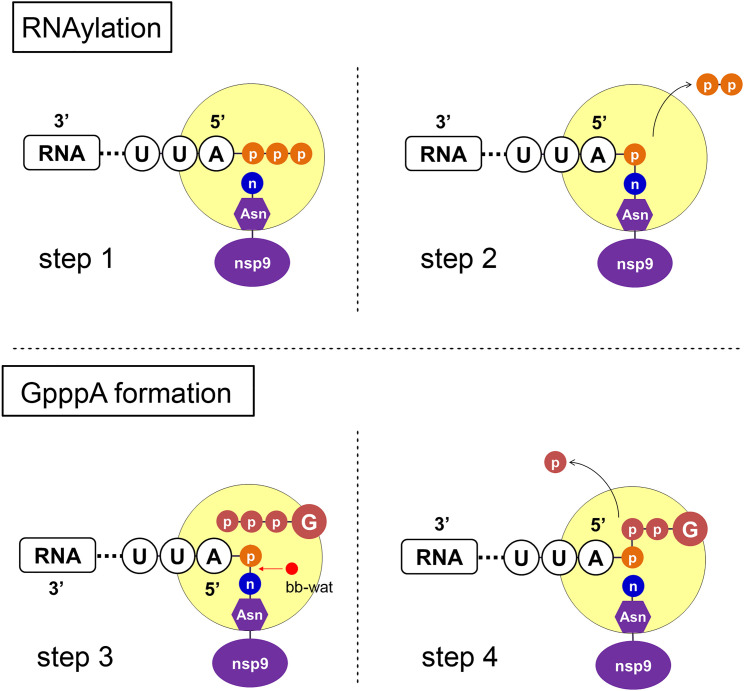
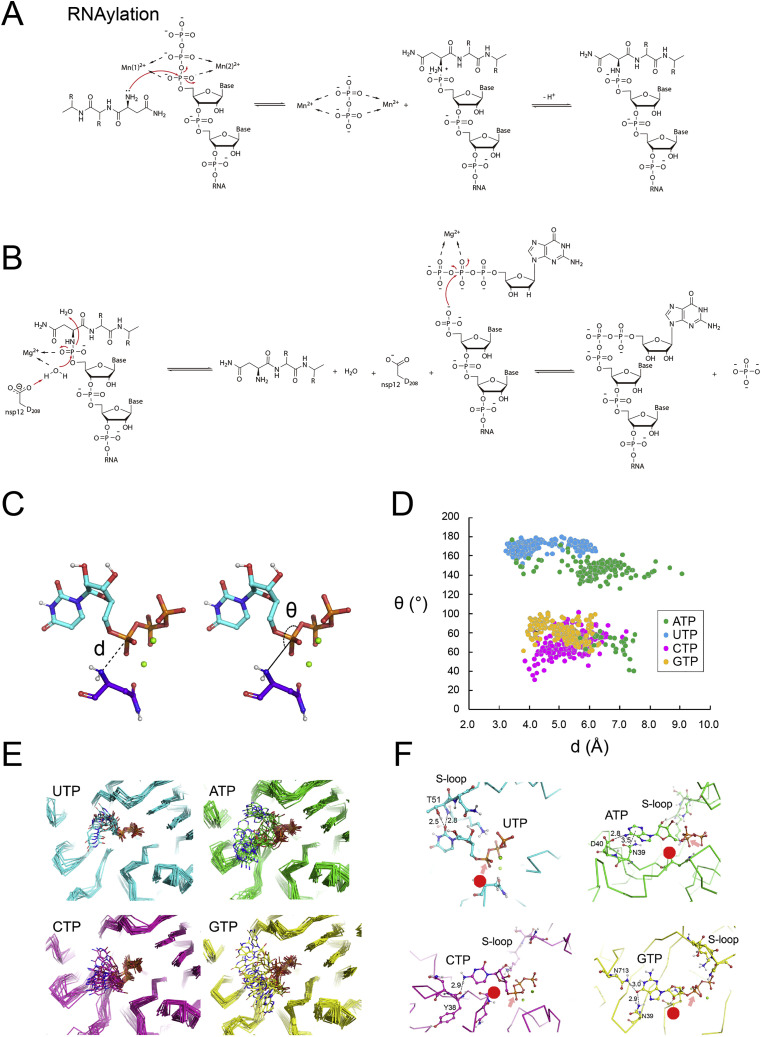
Decoration of cap on viral RNA plays essential roles in SARS-CoV-2 proliferation. Here, we report a mechanism for SARS-CoV-2 RNA capping and document structural details at atomic resolution. The NiRAN domain in polymerase catalyzes the covalent link of RNA 5' end to the first residue of nsp9 (termed as RNAylation), thus being an intermediate to form cap core (GpppA) with GTP catalyzed again by NiRAN. We also reveal that triphosphorylated nucleotide analog inhibitors can be bonded to nsp9 and fit into a previously unknown "Nuc-pocket" in NiRAN, thus inhibiting nsp9 RNAylation and formation of GpppA. S-loop (residues 50-KTN-52) in NiRAN presents a remarkable conformational shift observed in RTC bound with sofosbuvir monophosphate, reasoning an "induce-and-lock" mechanism to design inhibitors. These findings not only improve the understanding of SARS-CoV-2 RNA capping and the mode of action of NAIs but also provide a strategy to design antiviral drugs.

Keywords: SARS-CoV-2; capping; cryo-EM; nucleotide analog inhibitor.


Conflict of interest statement

Declaration of interests The authors declare no competing interests.

Figures

None
Graphical abstract
Figure 1
Figure 1
Nsp12 catalyzes the RNAylation of nsp9 and the subsequent GpppA formation (A) SDS-PAGE analysis of nsp9 RNAylation. The protein of S759A-nsp12 was incubated with apo-nsp9 and a 10-nt RNA in the presence of Mg2+, Mn2+, or Ca2+. The reaction products were subsequently analyzed using a MOPS 4%–20% gradient SDS-PAGE gel and stained with R250. The molecular weights of the standard protein markers are shown in the panel. The bands corresponding to nsp12, apo-nsp9, and RNA-nsp9 are indicated. (B) Mass spectrum analysis. Apo-nsp9 and RNA-nsp9 purified by ion-exchange column and analyzed by quadrupole time-of-flight (Q-TOF) mass spectrum. (C) Assay to detect GpppA formation. The components used in each lane are labeled. Lane 1 is the reaction with commercialized vaccinia capping enzymes as the positive controls. The positions corresponding to α-32P labeled GTP and GpppA are indicated in the panel. The result is a representative of three independent experiments. The reaction of S759A-nsp12 with Mg2+ or Mn2+ supplemented is indicated in the panel. (D) Assay to detect cap(0) and cap(1) formation. The components used in each lane are labeled. Lanes 1–3 are the reactions with commercialized vaccinia capping enzymes, and 2′-O-MTase are the positive controls. The positions corresponding to α-32P labeled GTP, GpppA, 7MeGpppA, and 7MeGpppA2’OMe are indicated in the panel. The result is based on three independent experiments. (E) Cryo-EM density of the E-RTC in complex with RNA-nsp9 and GMPPNP, which has the highest resolution in this study. See also Figures S1 and S5.
Figure S1
Figure S1
Purification of the modified nsp9 and GTP used in this study, related to Figure 1A Time-dependence of nsp9 RNAylation. S759A-nsp12, apo-nsp9 and the 10-nt RNA were incubated under the condition described in the STAR Methods for 5, 10, 20, 40, 80 and 120 min, respectively. The reaction products were assessed by MOPS 4%–20% gradient SDS-PAGE. The molecular weights for the standard markers are displayed. The bands corresponding to nsp12, apo-nsp9 and RNA-nsp9 are indicated. (B) Purification of RNA-nsp9. The product of nsp9 RNAylation reaction was loaded on to Hitrap Q ion-exchange column (GE Healthcare, USA) and was eluted with the gradient of NaCl from 50 to 370 mM. The peak for RNA-nsp9 is indicated in the figure. (C) The purity of GTP used in this study was verified by HPLC analysis. Chromatographic separation of GDP and GTP were carried out using an Ultimate XB-C18 Column (Welch Technology Shanghai, China). The injection volume used was 10 μL and total chromatographic run time was 30.0 min. The mobile phase used consisted of 0.1% (v/v) trifluoroacetic acid in water (A) and 0.1% (v/v) acetonitrile (B). At a flow rate of 1 mL/min, the gradient conditions were from 0% (B) to 30% (B) in 30 min. (D) The purity of [α-32P]GTP used in this study was checked by thin layer chromatography (TLC). As a control, [α-32P]GTP was treated by nsp13 to produce the hydrolyzed product [α-32P]GDP. (E–I) Purifications of NAI-labeled or UMP labeled nsp9. The products of nsp12 and nsp9 incubation with remdesivir triphosphate (E), sofosbuvir triphosphate (F), monulpiravir triphosphate (G), AT-9010 triphosphate (H) or UTP (I) were loaded onto Superdex-75 column (GE Healthcare, USA). The peak positions for NAIs or UMP decorated nsp9 are indicated in each panel.
Figure 2
Figure 2
Structure of E-RTC:RNA-nsp9 (A) A close-up view of the catalytic center of nsp12 NiRAN in the structure of E-RTC:RNA-nsp9. Nsp12 Palm, nsp12 NiRAN, and nsp9 are shown as red, yellow, and purple cartoons, respectively. The first residue of nsp9 (nsp9N1), the catalytic residues (nsp12D208, nsp12N209, and nsp12D218) and the nucleotides of the RNA linked to nsp9 are displayed as colored sticks. Two Mn2+ ions bound at nsp12 NiRAN catalytic center are represented as light purple spheres, whereas the solvent molecules coordinated with Mn2+ ions are shown as red spheres. (B and C) Cryo-EM densities covering nsp9N1, the nucleotides of RNA, Mn2+, and the coordinated solvent molecules are shown in gray mesh. The region of the phospho-amide bond is enlarged in (C). (D and E) Molecular details of the Nuc-pocket and the catalytic center. Enlarged view of Nuc-pocket and the catalytic center of nsp12 NiRAN are shown in (D) and (E), respectively. The polypeptides of nsp12 Palm, nsp12 NiRAN, and nsp9 are shown as semi-transparent colored cartoons. The nucleotides, the residues for RNA binding or catalytic reactions, Mn2+ cations, and the solvent molecules are represented in the same way as in (A). The black dashed lines denote the intermolecular interactions, whereas the red dashed line in (E) indicates the distances between the Mn2+ and the α-phosphorus of A+1. For clarity, the intermolecular interactions in the catalytic center are not shown in (D), and the second nucleotide U+2 is hidden in (E). (F) SDS-PAGE analysis of the mutagenesis studies. The reaction products were analyzed using a MOPS 4%–20% gradient SDS-PAGE gel stained with R250. See also Figures S2 and S3.
Figure 3
Figure 3
Structure of E-RTC:RNA-nsp9:GMPPNP (A) A close-up view of the catalytic center of nsp12 NiRAN in E-RTC:RNA-nsp9:GMPPNP. Nsp12 Palm, nsp12 NiRAN, and nsp9 are shown as red, yellow, and purple cartoons. The first residue of nsp9 (nsp9N1), the catalytic residues (nsp12D208, nsp12N209, and nsp12D218), the nucleotides of RNA linked to nsp9 and GMPPNP are displayed as colored sticks. A Mg2+ ion bound with the α-/γ-phosphates of GMPPNP is displayed as a green sphere. (B) Cryo-EM density covering nsp9N1, the nucleotides of RNA, and GMPPNP is shown as gray mesh. (C and D) The binding of RNA nucleotides. Enlarged view of A+1/U+2 nucleotides (C) and U+3/A+4 nucleotides (D) in nsp12 NiRAN are shown in (C) and (D), respectively. The polypeptides of nsp12 Palm, nsp12 NiRAN, and nsp9 are shown as semi-transparent colored cartoons. The nucleotides and the residues for RNA binding are represented in the same way as in (A). The black dashed lines denote the intermolecular interactions. For clarity, U+3/A+4 are not shown in (C), whereas U+2 and the interaction of A+1 are not shown in (D). (E and F) Enlarged views of GMPPNP binding to G-pocket (D) and (E). The bound GMPPNP and the interacting residues in G-pocket and in the catalytic center are shown as colored sticks, whereas the Mg2+ ion is displayed as a green sphere. The black dashed lines denote intermolecular interactions, whereas the red dashed lines in (F) denote the interactions of Mg2+ with the α-/γ-phosphates of GMPPNP. (G) The impact of nsp12 mutations on the formation of GpppA. The wt nsp12 and mutants used in the assays are labeled in the panel. The positions corresponding to α-32P labeled GTP and GpppA-RNA are indicated. The result is a representative of three independent experiments. See also Figures S2, S3, and S4.
Figure S2
Figure S2
Interactions of ligands with SARS-CoV-2 RTC and molecular details for the Nuc-pocket in MMP-nsp9 and RMP-nsp9 bound RTC and the G-pocket in ATMP-nsp9, MMP-nsp9 and RMP-nsp9 bound RTC, related to Figures 2, 3, 4I, and 5A–5E (A–E) LIGPLOT diagrams show critical contacts between the RNA, GMPPNP, and NAIs with RTC in the structure of E-RTC:RNA-nsp9 (A), E-RTC:RNA-nsp9:GMPPNP (B), E-RTC:RMP-nsp9:GMPPNP (C), E-RTC:SMP-nsp9:GMPPNP (D) and E-RTC:MMP-nsp9:GMPPNP (E). The interacting components are depicted in ball-and-stick mode. Gray ball, carbon; blue ball, nitrogen; red ball, oxygen; cyan ball, fluorine. (F and G) The polypeptides of nsp12 NiRAN and nsp9 are shown as semi-transparent colored cartoons. The bound RMP (F) or MMP (G), the interacting residues and GMPPNP are shown as colored sticks. The black dashed lines denote the intermolecular interactions. (H–J) The polypeptides of nsp12 NiRAN and nsp9 are shown as semi-transparent colored cartoons. The bound RMP (H), MMP (I) or ATMP (J), as well as the interacting residues and GMPPNP, are shown as colored sticks.
Figure S3
Figure S3
Structural details of E-RTC:RNA-nsp9 and E-RTC:RNA-nsp9:GMPPNP and comparison with previously reported RTC structures, related to Figures 2, 3, and 5 (A) The binding of RNA and GMPPNP in nsp12 NiRAN. The molecules of RNA and GMPPNP are shown as colored sticks, while nsp12/nsp9 polypeptides are covered by an electrostatic potential surface. The positions of G-pocket and Nuc-pocket are indicated by arrows. (B) A schematic representation of the interactions between RNA, GMPPNP and nsp12 NiRAN. The dashed lines indicate the intermolecular interactions. (C) Two perpendicular views of the comparison of the binding of A+1/U+2 in the structures of E-RTC:RNA-nsp9 with or without GMPPNP. The residues of RTC and A+1/U+2 in E-RTC:RNA-nsp9 are shown as colored sticks, while they are colored in white in the structure of E-RTC:RNA-nsp9:GMPPNP. The distance for shifting and the angle for rotation are indicated as arrows. (D) Comparison of GMPPNP and AT-9010-DP binding in the G-pocket. Structures of E-RTC:RNA-nsp9:GMPPNP and C-RTC:AT-9010-DP (Shannon et al., 2022) are aligned and are shown in the same orientation. The polypeptides of nsp12 and nsp9 are shown as a semi-transparent cartoon. A+1 nucleotide, nsp9N1, GMPPNP and three catalytic residues nsp12D208/N209/D218 are shown as colored sticks, while AT-9010-DP and nsp12D208/N209/D218 in the structure of C-RTC:AT-9010-DP are shown as gray sticks. One Mg2+ ion in the structure of E-RTC:RNA-nsp9:GMPPNP and two Mg2+ ions in the structure of C-RTC:AT-9010-DP are shown as green and gray spheres, respectively. (E) Comparison of the cryo-EM densities for the catalytic center of nsp12 NiRAN in two structures. GMPPNP, Mg2+ and Mn2+ and the solvent molecules are shown as previously used. The cryo-EM density covering GMPPNP in the structure of E-RTC:RNA-nsp9:GMPPNP is shown as gray mesh, while the density covering Mn2+ ions and the coordinated waters is shown as red mesh. (F and G) Close-up views of the catalytic center of nsp12 NiRAN in the structure of E-RTC:RNA-nsp9 (F) and E-RTC:apo-nsp9:GDP (Yan et al., 2021a) (G). All representations are used as the same in Figure 2A. (H) Comparison of A+1 nucleotide in E-RTC:RNA-nsp9 and GDP in E-RTC:apo-nsp9:GDP. Structures of E-RTC:RNA-nsp9 and E-RTC:apo-nsp9:GDP are aligned and shown the same three perpendicular views. The polypeptides are shown as semi-transparent cartoons. The carbon atoms for A+1 nucleotide, nsp9N1, the catalytic residues in the structure of E-RTC:RNA-nsp9 are colored as green, purple and yellow, respectively. Whereas, the carbon atoms for GDP, nsp9N1, the catalytic residues in the structure of E-RTC:apo-nsp9:GDP are colored in white. Mn2+ and Mg2+ are shown as gray and green spheres. (I) Superimpose of E-RTC:apo-nsp9:GDP with E-RTC:RNA-nsp9:GMPPNP. The structural elements are shown as previously used. For clearer representation, GMPPNP in E-RTC:RNA-nsp9:GMPPNP is hidden, and only GDP in E-RTC:apo-nsp9:GDP is shown with C atom colored by white. (J) Comparison of GDP, ADP and GMPPNP in RTC structures. The structures of E-RTC:apo-nsp9:GDP (PDB: 7CYQ), E-RTC:ADP (PDB: 6XEZ) and E-RTC:RNA-nsp9:GMPPNP are aligned. GDP, ADP and GMPPNP in them are shown as white, red and magenta sticks.
Figure S4
Figure S4
Structural comparison of GTP and GMPPNP bound in the G-pocket and sofosbuvir-specific conformational change of S-loop and structural arrangements following that, related to Figures 3, 4, and 5 (A) GTP in the structure of E-RTC:RNA-nsp9:GTP and GMPPNP in the structure of E-RTC:RNA-nsp9:GMPPNP were aligned and shown in the same orientation. GTP and nsp9N1 in E-RTC:RNA-nsp9:GTP were shown as colored sticks, while the structural elements in E-RTC:RNA-nsp9:GMPPNP were shown as white color with the exception that the nitrogen atom in P-N bond is colored as blue. (B) The density for GTP in E-RTC:RNA-nsp9:GTP. (C) GTP in the structure of E-RTC:SMP-nsp9:GTP and GMPPNP in the structure of E-RTC:SMP-nsp9:GMPPNP were aligned and shown in the same orientation. (D) The density for GTP in E-RTC:SMP-nsp9:GTP. (E) The density covering the environment surrounding bb-wat in E-RTC:SMP-nsp9:GTP. The representation scheme is the same as in Figure 5. (F) The cryo-EM density covering the S-loop in the structure of E-RTC:SMP-nsp9:GMPPNP is shown as gray mesh, while the S-loop is displayed as colored sticks. (G) Comparison of the S-loop in reported structures. The polypeptides spanning the S-loop in each structures indicated in the panel are shown as colored ribbons. (H–K) Close-up views of the catalytic center of nsp12 NiRAN in E-RTC:UMP-nsp9 (H and J) and in E-RTC:UMP-nsp9:GMPPNP (I and K) are shown in the same representations as those in Figure 5. (L and M) Close-up views of the catalytic center in E-RTC:RNA-nsp9:GMPPNP (L) and E-RTC:SMP-nsp9:GMPPNP (M). The polypeptides of nsp12 and nsp9 are covered by electrostatic potential surfaces. A+1 nucleotide, SMP, GMPPNP are shown as colored sticks. The positions of nsp12K50/N52 and nsp12T51 of the S-loop are indicated in (L) and (M) by arrows. (N) Comparison of GMPPNP binding. GMPPNP molecules in the structures of RTC:RNA-nsp9:GMPPNP and E-RTC:SMP-nsp9:GMPPNP are shown as colored sticks, in which the carbon atoms are colored as magenta and white, respectively. The S-loop and nsp12T51 are also shown as colored cartoons and sticks. (O and P) Comparison of the arrangement of the catalytic center. The polypeptides of nsp12 are shown as semi-transparent cartoon, while A+1 nucleotide, SMP, GMPPNP and the interacting residues are shown as colored sticks. It should be noted that only the interacting residues with significant conformational change are shown here, and the interacting residues with conserved positions are hidden for clear representation. The black dashed lines denote the intermolecular interactions, while the red dashed lines denote the close distance between Mg2+ and GMPPNP.
Figure S5
Figure S5
Covalent bond of NAI to nsp9 and relevance of nsp9-RNAylation-mediate capping pathway with currently known evidence, related to Figures 1 and 4A–4D (A–D) SDS-PAGE and mass spectrum analysis of the products for the incubation of nsp9, nsp12 and NAI-TPs. The protein of nsp12 was incubated with nsp9 and remdesivir-TP (RTP) (A), sofosbuvir-TP (STP) (B), molnupiravir-TP (MTP) (C) and AT-9010-TP (ATTP) (D), all in the presence of Mn2+. The reaction products were subsequently analyzed using a MOPS 4%–20% gradient SDS-PAGE gel stained with R250. The molecular weights of the standard protein markers are shown in the panel. The bands corresponding to nsp12, apo-nsp9 and NAI-nsp9 are indicated. The purified NAI-nsp9 proteins were further analyzed by Q-TOF mass spectrometry. (E) The purified RMP-/ATMP-/MMP-/SMP-nsp9 or apo-nsp9 proteins were incubated with nsp12 and the 10-nt RNA in the presence of Mn2+ and the products were analyzed using a MOPS 4%–20% gradient SDS-PAGE gel stained with R250. (F) The purified RMP-/ATMP-/MMP-/SMP-nsp9 were incubated with nsp12 and GTP in the presence of Mg2+. The products were analyzed by Q-TOF mass spectrometry. The peaks with molecular weights ranging from 11,000 to 14,000 Da are shown in each panel. (G) The relative efficiency of the conventional pathway with nsp9-RNAylaton-mediate capping pathway. We used the vaccinia capping system (except for SAM) (NewEngland Biolabs, USA) and [α-32P]GTP to label the 5′ terminus of the RNA (ChemGenes, USA) as a positive control. (1) E-RTC (first pathway only): 2 μL nsp12 (2 μg/μL) and 1 μL nsp13 (2 μg/μL) was mixed with pppRNA and [α-32P]-GTP in a buffer consisting of 50 mM HEPES, pH 7.0, 6 mM KCl, 4 mM DTT, 2 mM MgCl2 and 2 mM MnCl2. (2) E-RTC and apo-nsp9 (both pathways): 2 μL nsp12 (2 μg/μL), 2 μL nsp9 (10 μg/μL) and 1 μL nsp13 (2 μg/μL) was mixed with pppRNA and [α-32P]-GTP in a buffer consisting of 50 mM HEPES, pH 7.0, 6 mM KCl, 4 mM DTT, 2 mM MgCl2 and 2 mM MnCl2. (3) RTC (with no nsp13) and apo-nsp9 (second pathway only): 2 μL nsp12 (2 μg/μL), 2 μL nsp9 (10 μg/μL) was mixed with pppRNA and [α-32P]-GTP in a buffer consisting of 50 mM HEPES, pH 7.0, 6 mM KCl, 4 mM DTT 2 mM MnCl2. (H) Competition of SMP decoration by GTP, GDP, GMP, PPi and GMPPNP. The purified SMP-nsp9 (20 μg/μL) was treated by GTP (50 μM), GDP (50 μM), GMP (50 μM), PPi (50 μM) and GMPPNP (50 μM) for 30 min at 30°C, respectively. The reaction products were analyzed by SDS-PAGE. (I–K) Competition of SMP decoration by the native NTPs. In the (C), the purified apo-nsp9 (20 μg/μL) was incubated with the equal concentration (100 μM) of STP, ATP, UTP, CTP, GTP for 60 min at 30°C. The reaction products were by Q-TOF mass spectrometry. Please note, because of the very similar molecular weights of UMP-nsp9 and CMP-nsp9, the peak at 12,683 Da cannot distinguish them. In the (D), the purified SMP-nsp9 (5 μg/μL) was incubated with UTP (100 μM) for 30 min at 30°C. In the (E), the purified UMP-nsp9 (5 μg/μL) was incubated with STP (100 μM) for 30 min at 30°C. The reaction products were by Q-TOF mass spectrometry.
Figure 4
Figure 4
Structures of NAI-nsp9 in RTC (A–D) Close-up views of the catalytic center of nsp12 NiRAN in the structures of E-RTC:RMP-nsp9:GMPPNP (A), E-RTC:SMP-nsp9:GMPPNP (B), E-RTC:MMP-nsp9:GMPPNP (C), and E-RTC:ATMP-nsp9:GMPPNP (D). Nsp12 Palm, nsp12 NiRAN, and nsp9 are shown as red, yellow, and purple cartoons. The first residue of nsp9 (nsp9N1), the catalytic residues (nsp12D208, nsp12N209, and nsp12D218), and the nucleotides of NAI-MPs linked to nsp9 are displayed as colored sticks. Mg2+ ions are represented as green spheres, whereas the water molecules are shown as red spheres. (E–H) Cryo-EM densities covering nsp9N1, GMPPNP, and/or NAI-MPs in the structures of E-RTC:RMP-nsp9:GMPPNP (E), E-RTC:SMP-nsp9:GMPPNP (F), E-RTC:MMP-nsp9:GMPPNP (G), and RTC:ATMP-nsp9:GMPPNP (H) are shown using gray mesh. (I–K) Molecular details for the Nuc-pocket, G-pocket, and the catalytic center in the structure of E-RTC:SMP-nsp9:GMPPNP. Enlarged view of Nuc-pocket (I), G-pocket (J), and the catalytic center (K) of nsp12 NiRAN. The polypeptides of nsp12 NiRAN and nsp9 are shown as semi-transparent colored cartoons. The bound SMP, the interacting residues, and GMPPNP are shown as colored sticks. The black dashed lines denote the intermolecular interactions. See also Figures S2, S4, and S5.
Figure 5
Figure 5
The “bond-breaking” water Close-up view of the structural details around bb-wat in E-RTC:RNA-nsp9 (A), E-RTC:RNA-nsp9:GMPPNP (B), E-RTC:RMP-nsp9:GMPPNP (C), E-RTC:SMP-nsp9:GMPPNP (D), E-RTC:MMP-nsp9:GMPPNP (E), and E-RTC:ATMP-nsp9:GMPPNP (F) are shown in the same orientation. The residues, the RNA, and the bound GMPPNP, as well as the cations and water molecules, are shown using the same scheme as in previous figure and are covered by the cryo-EM densities (gray meshes). The black dashed lines indicate the interactions of bb-wat with nsp12 residues, whereas the red dashed lines represent the distance from bb-wat to the α-phosphor of RNA nucleotide or NAI-MP covalently linking to nsp9N1. See also Figures S2, S3, S4, and S6.
Figure 6
Figure 6
A proposed model for nsp9-RNAylation-mediated GpppA formation See also Figure S6.
Figure S6
Figure S6
Propose reaction mechanisms and molecular dynamics based analysis on the interaction of NTP with Nuc-pocket, related to Figures 5 and 6 (A and B) Propose reaction mechanisms for nsp9-RNAylation-mediated GpppA formation. (C) Coordinate system of the nucleophilic attack of nsp9N1 free amino group on the α-phosphorus of NTP. The distance between N and α-P is defined as d, and N:α-P:αβ-O is defined as θ. The optimal alignment of the free amino group of nsp9N1 and the α-phosphorus of NTP for nucleophilic attack is demonstrated by assigning θ ≈ 180°. (D) The distribution of θ and d within 200-ns molecular dynamics. (E) Representative conformations of NTP observed in the molecular dynamics simulation. Clustering analysis was performed on molecular simulation trajectories to get the representative conformations. (F) Sample frames showing residues interacting with the nitrogenous base of NTP. The red triangle indicates the position of the free amino group of nsp9N1. The pink circle indicates the optimal direction for nucleophilic attack on α-P.

Similar articles

Cited by

References

    1. Afonine P.V., Klaholz B.P., Moriarty N.W., Poon B.K., Sobolev O.V., Terwilliger T.C., Adams P.D., Urzhumtsev A. New tools for the analysis and validation of cryo-EM maps and atomic models. Acta Crystallogr. D Struct. Biol. 2018;74:814–840. - PMC - PubMed
    1. Bost A.G., Carnahan R.H., Lu X.T., Denison M.R. Four proteins processed from the replicase gene polyprotein of mouse hepatitis virus colocalize in the cell periphery and adjacent to sites of virion assembly. J. Virol. 2000;74:3379–3387. - PMC - PubMed
    1. Bouvet M., Debarnot C., Imbert I., Selisko B., Snijder E.J., Canard B., Decroly E. In vitro reconstitution of SARS-coronavirus mRNA cap methylation. PLoS Pathog. 2010;6:e1000863. - PMC - PubMed
    1. Brockway S.M., Clay C.T., Lu X.T., Denison M.R. Characterization of the expression, intracellular localization, and replication complex association of the putative mouse hepatitis virus RNA-dependent RNA polymerase. J. Virol. 2003;77:10515–10527. - PMC - PubMed
    1. Bussi G., Donadio D., Parrinello M. Canonical sampling through velocity rescaling. J. Chem. Phys. 2007;126:014101. - PubMed

Publication types