

Apoptotic responses stimulated by the trichloroethylene metabolite S-(1,2-dichlorovinyl)-L-cysteine depend on cell differentiation state in BeWo human trophoblast cells
- PMID: 36336211
- PMCID: PMC9949904
- DOI: 10.1016/j.tiv.2022.105514
Apoptotic responses stimulated by the trichloroethylene metabolite S-(1,2-dichlorovinyl)-L-cysteine depend on cell differentiation state in BeWo human trophoblast cells
Abstract
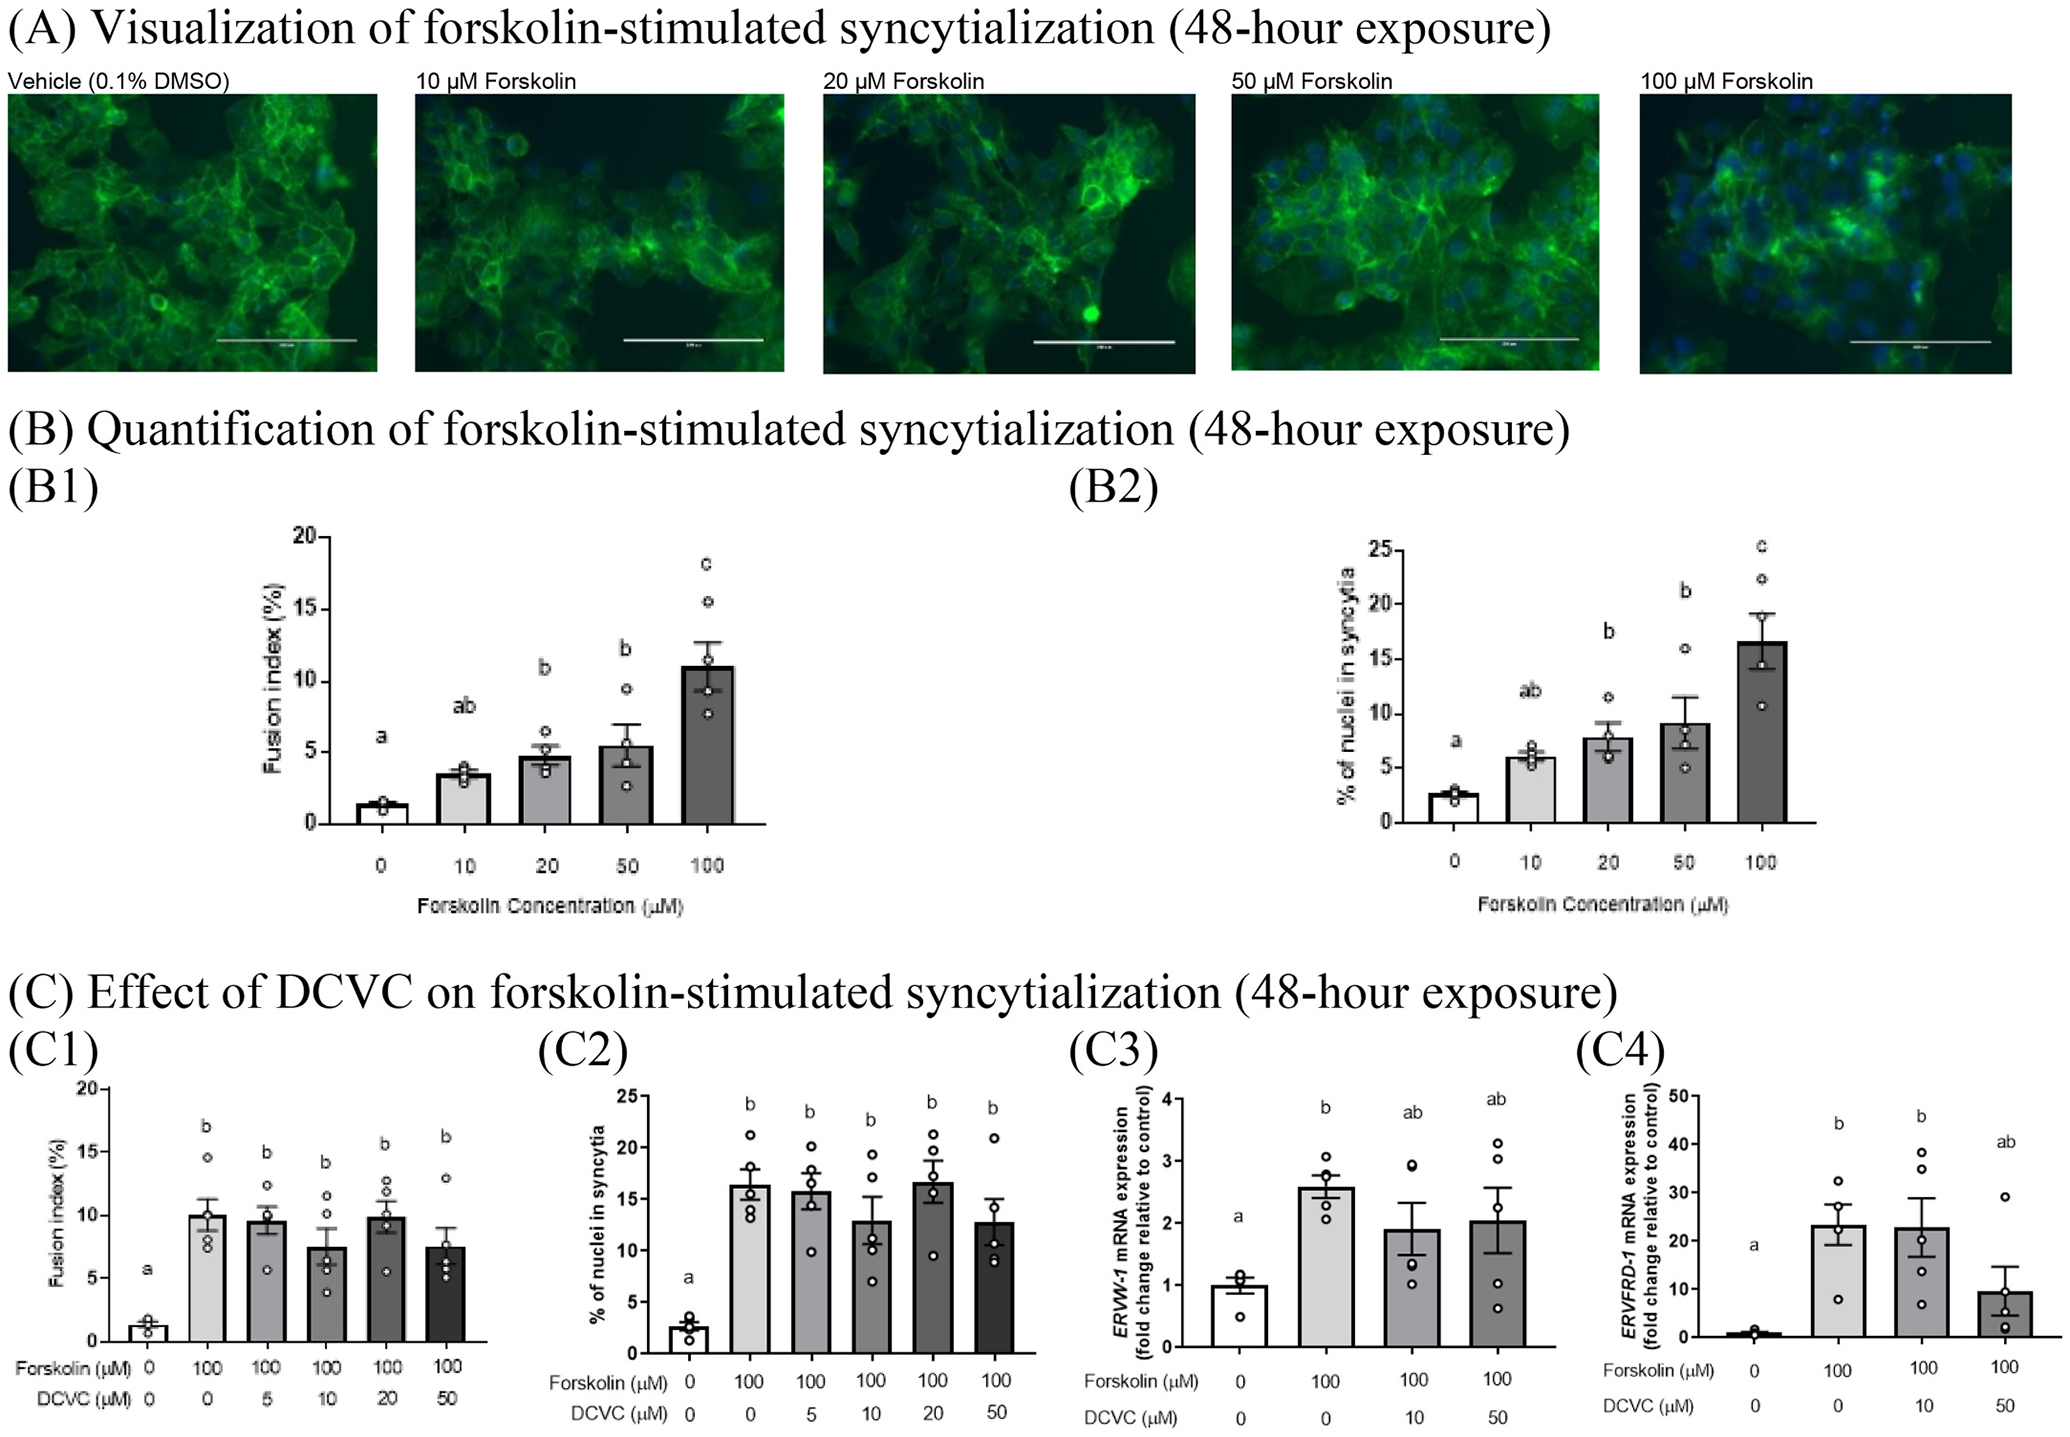
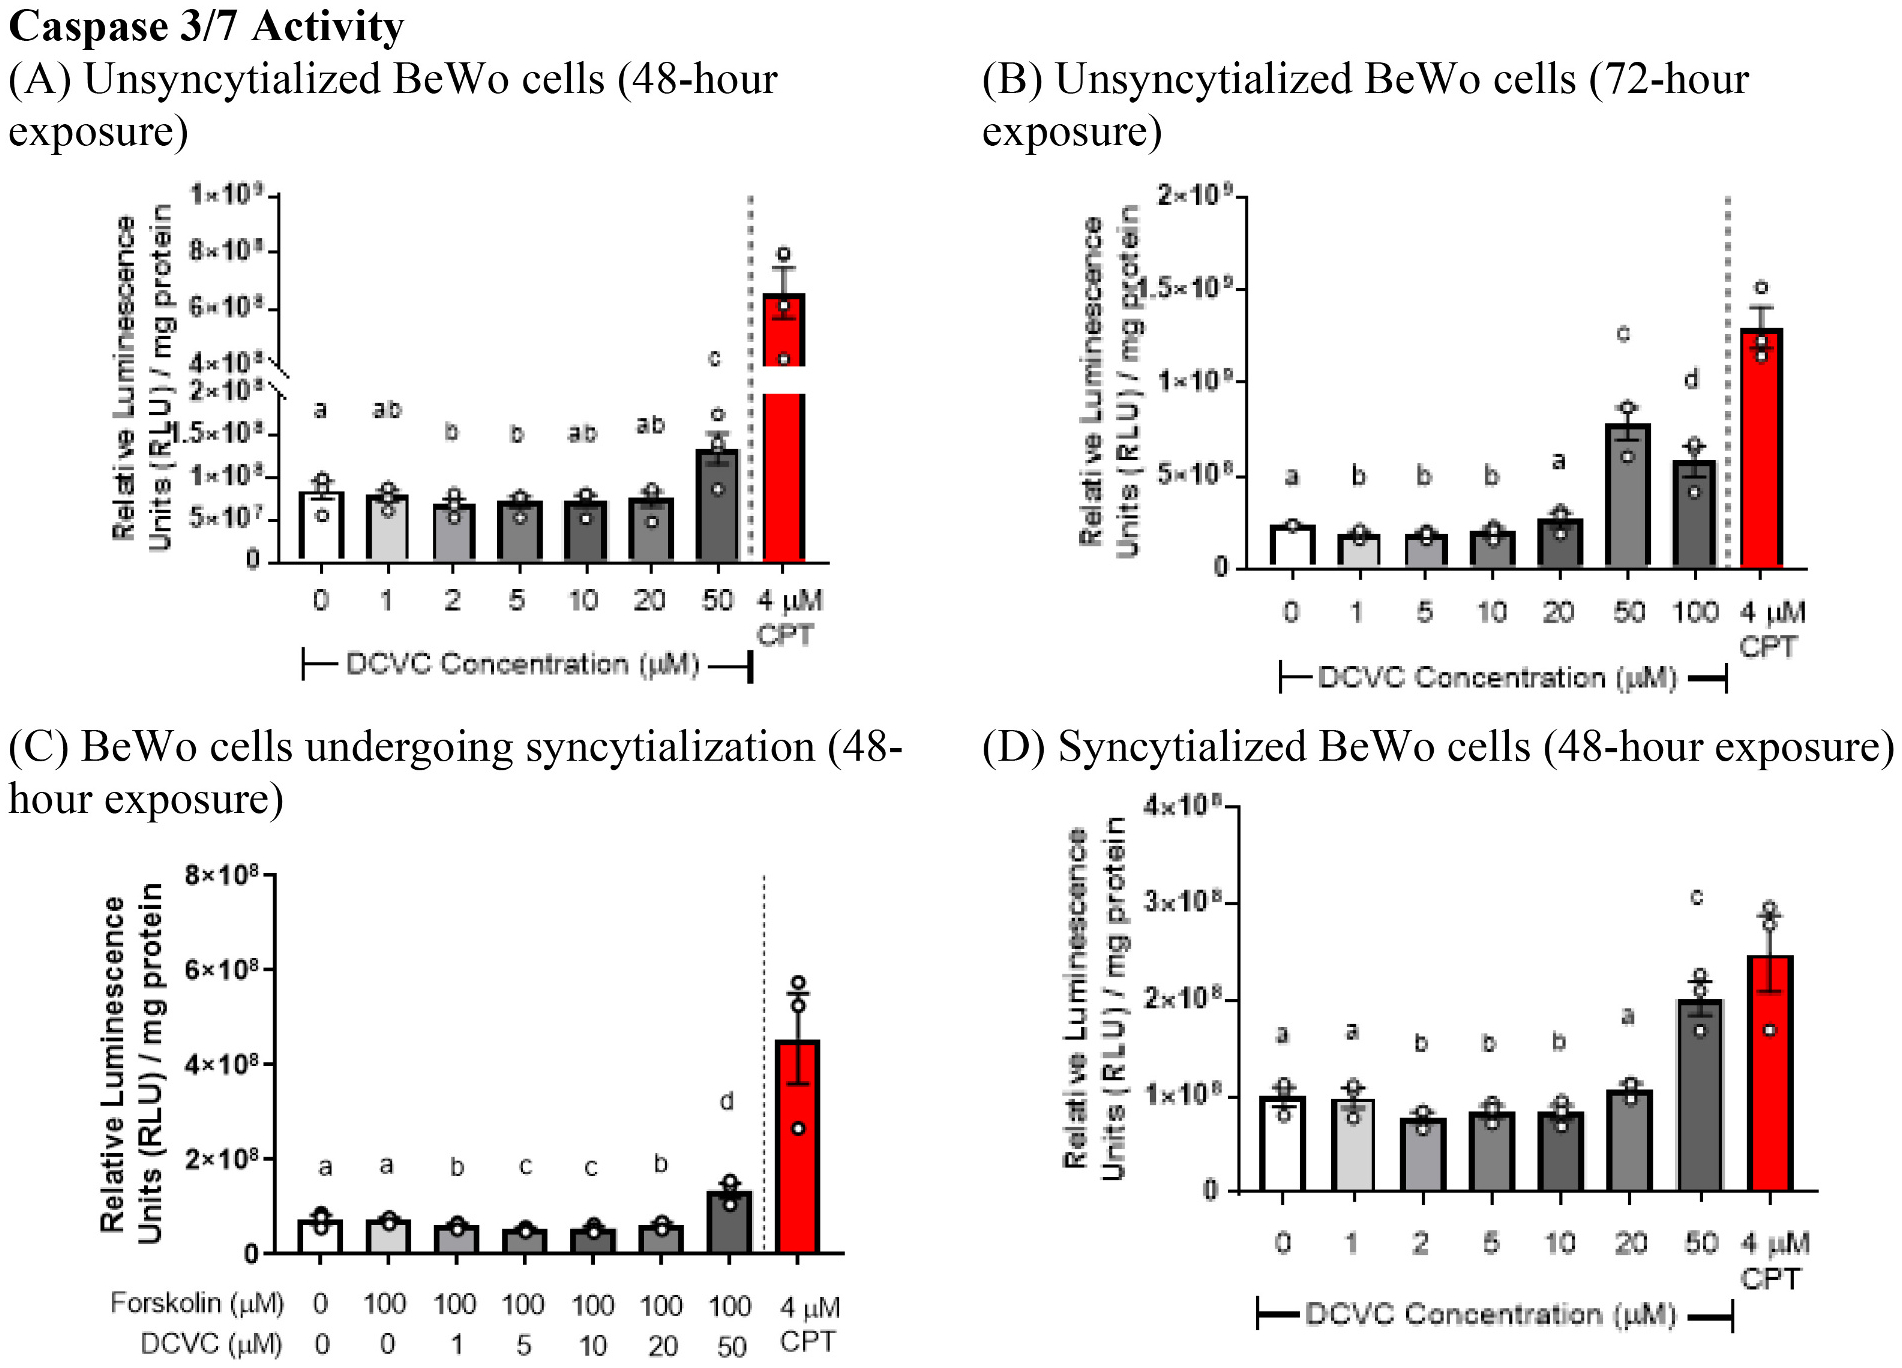
During pregnancy, the placental villous cytotrophoblasts differentiate via cell fusion and multinucleation to create syncytiotrophoblasts, a cell type at the maternal-fetal interface. Apoptosis of syncytiotrophoblasts is associated with adverse pregnancy outcomes. The human trophoblast BeWo cell line has been used as an in vitro model for this differentiation process, also known as syncytialization. In the current study, we exposed unsyncytialized BeWo cells, BeWo cells undergoing syncytialization, and syncytialized BeWo cells to S-(1,2-dichlorovinyl)-L-cysteine (DCVC), a metabolite of the industrial chemical trichloroethylene (TCE). DCVC exposure at 50 μM for 48 h decreased cell viability, increased cytotoxicity, increased caspase 3/7 activity, and increased nuclear condensation or fragmentation in BeWo cells regardless of their differentiation status. Investigating mechanisms of apoptosis, DCVC increased H2O2 abundance and decreased PRDX2 mRNA in all three BeWo cell models. DCVC decreased tumor necrosis factor-receptor 1 (TNF-R1) concentration in media and decreased NFKB1 and PRDX1 mRNA expression in syncytialized BeWo cells only. DCVC decreased BCL2 mRNA expression in syncytializing BeWo cells and in syncytialized BeWo cells only. Decreased LGALS3 mRNA was seen in unsyncytialized BeWo cells only. Together, these data suggest roles for oxidative stress and pro-inflammatory mechanisms underlying apoptosis in BeWo cells with differences depending on differentiation state.
Keywords: Apoptosis; Placenta; S-(1,2-dichlorovinyl)-L-cysteine (DCVC); Syncytialization; Trichloroethylene (TCE); Villous trophoblasts.
Copyright © 2022 Elsevier Ltd. All rights reserved.
Conflict of interest statement
Declaration of Competing Interest The authors declare that they have no known competing financial interests or personal relationships that could have appeared to influence the work reported in this paper.
Figures


Similar articles
-
N-Acetyl-L-cysteine and aminooxyacetic acid differentially modulate toxicity of the trichloroethylene metabolite S-(1,2-dichlorovinyl)-L-cysteine in human placental villous trophoblast BeWo cells.Toxicology. 2023 Aug 15;495:153611. doi: 10.1016/j.tox.2023.153611. Epub 2023 Aug 5. Toxicology. 2023. PMID: 37544576 Free PMC article.
-
Trichloroethylene Metabolite S-(1,2-Dichlorovinyl)-l-cysteine Stimulates Changes in Energy Metabolites and Amino Acids in the BeWo Human Placental Trophoblast Model during Syncytialization.Chem Res Toxicol. 2023 Jun 19;36(6):882-899. doi: 10.1021/acs.chemrestox.3c00007. Epub 2023 May 10. Chem Res Toxicol. 2023. PMID: 37162359 Free PMC article.
-
Reactive Oxygen Stimulation of Interleukin-6 Release in the Human Trophoblast Cell Line HTR-8/SVneo by the Trichlorethylene Metabolite S-(1,2-Dichloro)-l-Cysteine.Biol Reprod. 2016 Sep;95(3):66. doi: 10.1095/biolreprod.116.139261. Epub 2016 Aug 3. Biol Reprod. 2016. PMID: 27488030 Free PMC article.
-
Transcriptional profiling of the response to the trichloroethylene metabolite S-(1,2-dichlorovinyl)-L-cysteine revealed activation of the eIF2α/ATF4 integrated stress response in two in vitro placental models.Arch Toxicol. 2021 May;95(5):1595-1619. doi: 10.1007/s00204-021-03011-5. Epub 2021 Mar 16. Arch Toxicol. 2021. PMID: 33725128 Free PMC article.
-
The trichloroethylene metabolite S-(1,2-dichlorovinyl)-L-cysteine induces progressive mitochondrial dysfunction in HTR-8/SVneo trophoblasts.Toxicology. 2019 Nov 1;427:152283. doi: 10.1016/j.tox.2019.152283. Epub 2019 Aug 30. Toxicology. 2019. PMID: 31476333 Free PMC article.
Cited by
-
N-Acetyl-L-cysteine and aminooxyacetic acid differentially modulate toxicity of the trichloroethylene metabolite S-(1,2-dichlorovinyl)-L-cysteine in human placental villous trophoblast BeWo cells.Toxicology. 2023 Aug 15;495:153611. doi: 10.1016/j.tox.2023.153611. Epub 2023 Aug 5. Toxicology. 2023. PMID: 37544576 Free PMC article.
-
Trichloroethylene Metabolite S-(1,2-Dichlorovinyl)-l-cysteine Stimulates Changes in Energy Metabolites and Amino Acids in the BeWo Human Placental Trophoblast Model during Syncytialization.Chem Res Toxicol. 2023 Jun 19;36(6):882-899. doi: 10.1021/acs.chemrestox.3c00007. Epub 2023 May 10. Chem Res Toxicol. 2023. PMID: 37162359 Free PMC article.
-
Trichloroethylene: An Update on an Environmental Contaminant with Multiple Health Effects.Annu Rev Pharmacol Toxicol. 2025 Jan;65(1):507-527. doi: 10.1146/annurev-pharmtox-022724-120525. Epub 2024 Dec 17. Annu Rev Pharmacol Toxicol. 2025. PMID: 39094062 Free PMC article. Review.
-
Deregulation of MicroRNA-146a and 155 expression levels might underlie complicated pregnancy in Toxoplasma Gondii seronegative women.BMC Womens Health. 2024 Jul 23;24(1):416. doi: 10.1186/s12905-024-03233-6. BMC Womens Health. 2024. PMID: 39039506 Free PMC article.
References
-
- Agency for Toxic Substances and Disease Registry, 2007. In: E.H.a.M.E. (Ed.), Trichloroethylene Toxicity: What are the U.S. Standards for Trichloroethylene Exposure?. Agency for Toxic Substances and Disease Registry (ATSDR), Atlanta, GA.
-
- Akahani S, Nangia-Makker P, Inohara H, Kim HR, Raz A, 1997. Galectin-3: a novel antiapoptotic molecule with a functional BH1 (NWGR) domain of Bcl-2 family. Cancer Res. 57, 5272–5276. - PubMed
-
- Al-Nasiry S, Spitz B, Hanssens M, Luyten C, Pijnenborg R, 2006. Differential effects of inducers of syncytialization and apoptosis on BeWo and JEG-3 choriocarcinoma cells. Hum. Reprod 21, 193–201. - PubMed
-
- Annibaldi A, Meier P, 2018. Checkpoints in TNF-induced cell death: implications in inflammation and Cancer. Trends Mol. Med 24, 49–65. - PubMed
-
- Bubici C, Papa S, Pham CG, Zazzeroni F, Franzoso G, 2006. The NF-kappaB-mediated control of ROS and JNK signaling. Histol. Histopathol 21, 69–80. - PubMed
MeSH terms
Substances
Grants and funding
LinkOut - more resources
Full Text Sources
Research Materials
Miscellaneous
