. 2022 Nov;12(11):e1101.
doi: 10.1002/ctm2.1101.

Single-cell RNA sequencing reveals cellular and molecular reprograming landscape of gliomas and lung cancer brain metastases

Affiliations

Single-cell RNA sequencing reveals cellular and molecular reprograming landscape of gliomas and lung cancer brain metastases

He-Fen Sun et al. Clin Transl Med. 2022 Nov.

Abstract

Background: Brain malignancies encompass gliomas and brain metastases originating from extracranial tumours including lung cancer. Approximately 50% of patients with lung adenocarcinoma (LUAD) will eventually develop brain metastases. However, the specific characteristics of gliomas and lung-to-brain metastases (LC) are largely unknown.

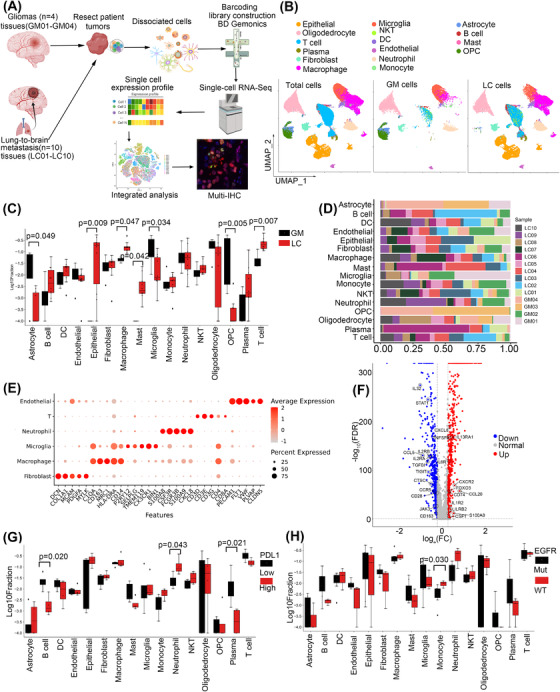
Methods: We applied single-cell RNA sequencing to profile immune and nonimmune cells in 4 glioma and 10 LC samples.

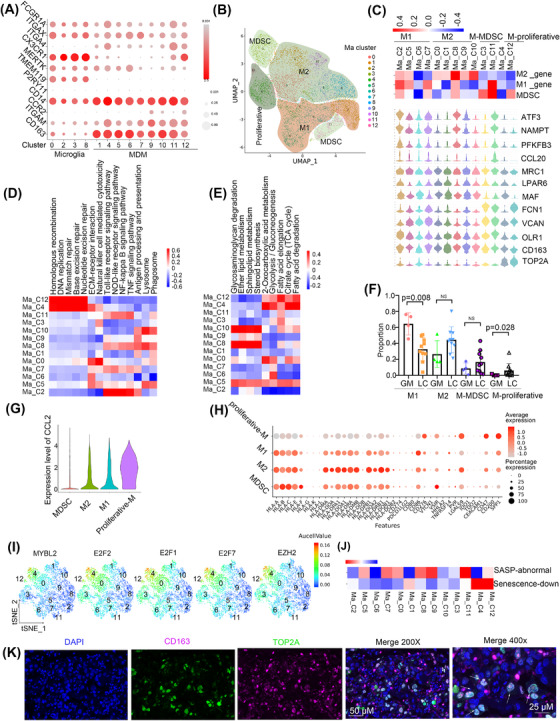
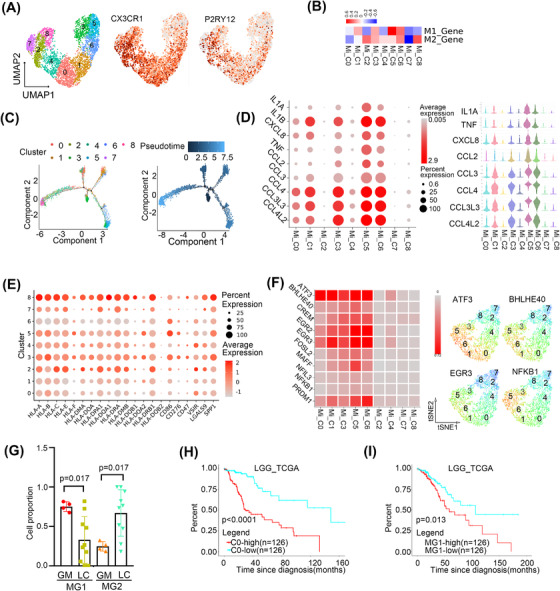
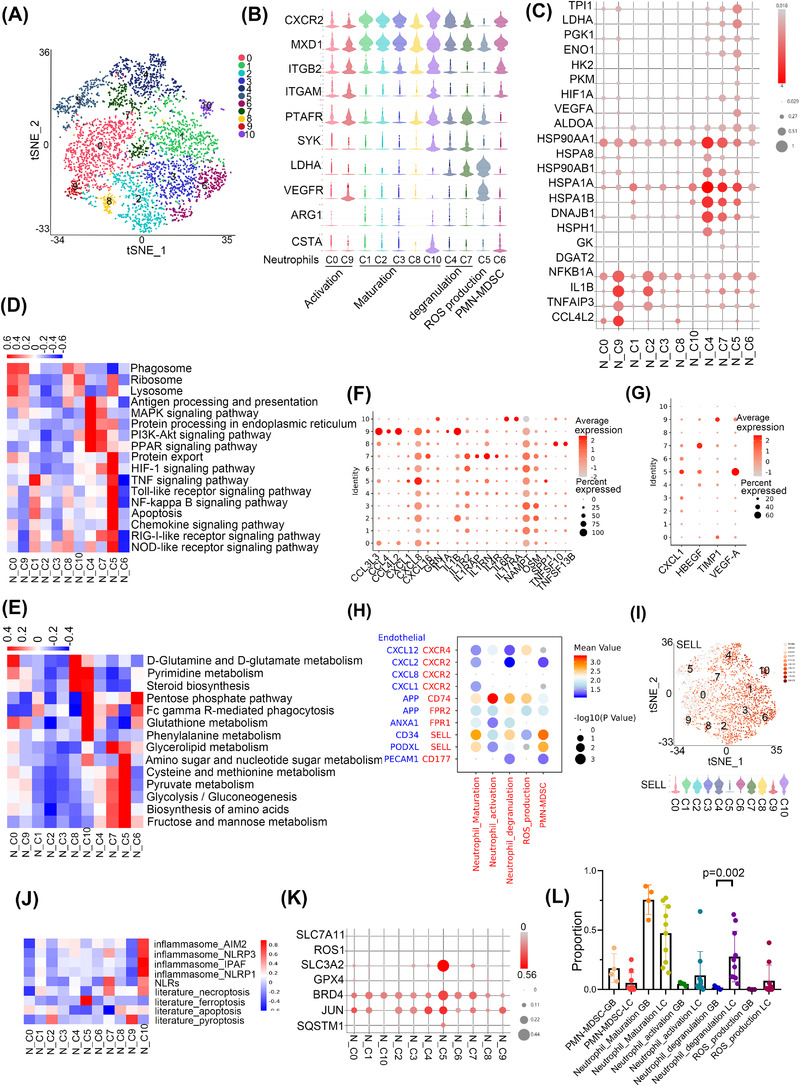
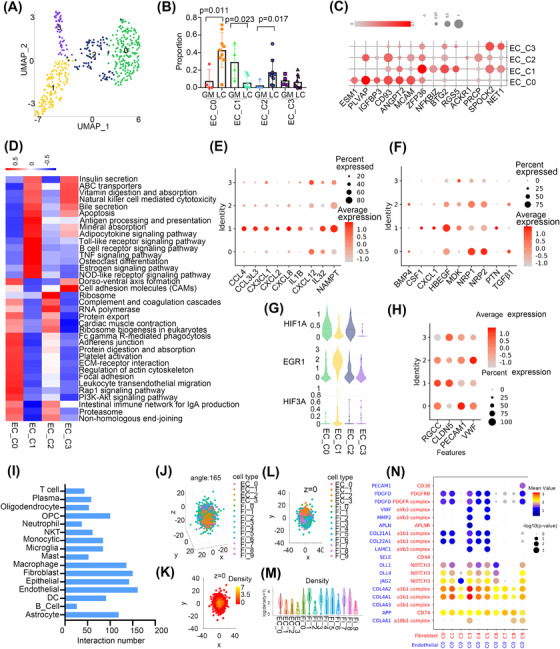
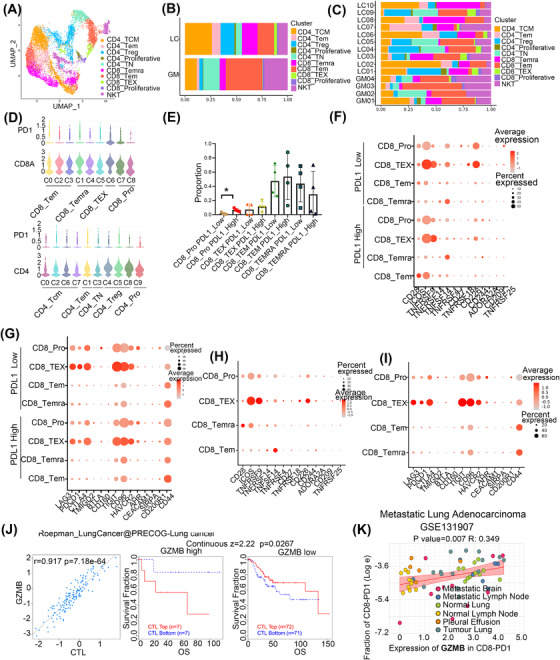
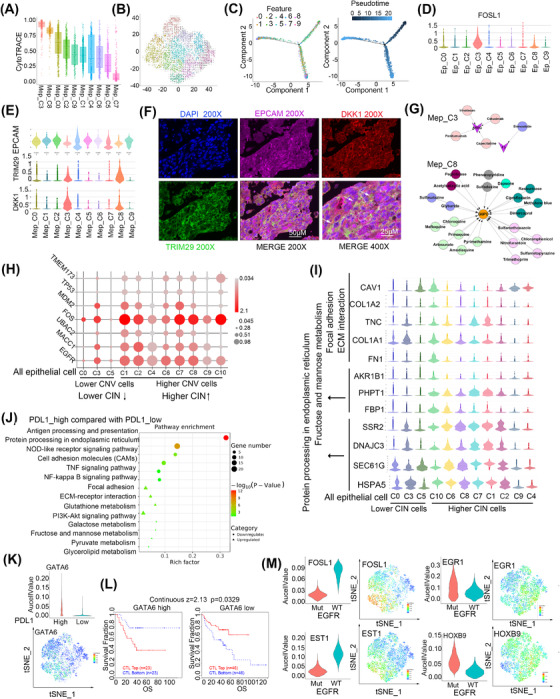
Results: Our analysis revealed that tumour microenvironment (TME) cells are present in heterogeneous subpopulations. LC reprogramed cells into immune suppressed state, including microglia, macrophages, endothelial cells, and CD8+ T cells, with unique cell proportions and gene signatures. Particularly, we identified that a subset of macrophages was associated with poor prognosis. ROS (reactive oxygen species)-producing neutrophils was found to participant in angiogenesis. Furthermore, endothelial cells participated in active communication with fibroblasts. Metastatic epithelial cells exhibited high heterogeneity in chromosomal instability (CIN) and cell population.

Conclusions: Our findings provide a comprehensive understanding of the heterogenicity of the tumor microenvironment and tumour cells and it will be crucial for successful immunotherapy development for brain metastasis of lung cancer.

Keywords: brain metastasis; glioma; lung adenocarcinoma; programmed cell death 1 ligand 1 (PDL1); single-cell RNA sequencing; tumour microenvironment.


Conflict of interest statement

The authors declare no conflict of interest.

Figures

FIGURE 1
FIGURE 1
Overview of the single‐cell landscape for brain cancer. (A) Workflow showing sampling, sequencing and analysis process of clinical samples. (B) UMAP view of total cells obtained from 4 GM and 10 LC samples, colour‐coded by assigned cell type. (C) Cell type proportions in GM and LC, the black and red represented GM and LC, respectively. (D) Cell composition distribution for each patient sample. (E) Marker gene expression for each cell type, where dot size and colour represent the percentage of the marker gene. (F) The volcano plot of variable expression genes of TME between GM and LC. Upregulated genes (FC > 2) were coloured in red while downregulated genes (FC less than ‐ 2) were coloured in blue. (G) Cell type proportions in the PDL1 high (PDL1 expression > 1%) and low group, the black and red represented PDL1 low and PDL1 high, respectively. (H) Cell type proportions in EGFR mutation (mutation in Exon19, 20 or 21) and wild type group, the black and red represented EGFR mutation and wild type, respectively.
FIGURE 2
FIGURE 2
A subset of proliferative MDMs is associated with poor prognosis. (A) The bubble plot showed the gene expressions of the TAMs that originated from tissue‐invading monocyte‐derived macrophages (MDMs) or CNS‐resident microglia‐derived macrophages (microglia). (B) The UMAP view of macrophage. (C) Marker gene expression profiles of macrophage cell type. (D) KEGG pathway enriched in macrophage. Red colour represents upregulation and blue colour means downregulation. (E) Metabolism pathway enriched in macrophage. Red colour represents upregulation and blue colour means downregulation. (F) The relative proportion of M1 and M2 in GM and LC. (G) Expression of CCL2 in different types of macrophages showed with violin plot. (H) Gene bubble plot of immune checkpoint inhibition ligand genes. (I) Expression of genes was shown in the tSNE view. (J) Scoring all the macrophages by the senescence gene list. (K) Multiplex immunofluorescence staining of LC tissue.
FIGURE 3
FIGURE 3
Microglia exhibited multiple polarisation phenotypes in the brain. (A) The UMAP view of microglia with the expression of CX3CR1 and P2RY12. (B) Scoring all the microglia by the macrophage phenotyping and polarisation gene list. (C) Differentiation trajectory of microglia, with each colour coded for clusters (left) and pseudo‐time (right). (D) Bubble plot of the cytokine expression in microglia, colour and dot size represented the average and percent expression, respectively (The left panel). The violin plots of the cytokine expression in microglia (The right panel) (E) Bubble plot of immune checkpoint inhibition ligand gene. (F) The expression of indicated transcriptional factors showed with heatmap (The left panel) and UMAP views (The right panel). (G) The relative proportion of MG1 and MG2 in GM and LC. (H) The survival curve of cluster 0 gene signature in LGG in TCGA. (I) The survival curve of MG1 gene signature in LGG in TCGA.
FIGURE 4
FIGURE 4
ROS‐productive neutrophils may participate in tumour angiogenesis in brain malignancies. (A) The tSNE view of neutrophils. (B) Violin plots of the expression of marker gene of neutrophil subtypes. (C) Bubble plot of gene expression in neutrophils. (D) KEGG pathway enriched in neutrophils. Red colour represents upregulation and blue colour means downregulation. (E) Metabolism pathway enriched in neutrophils. Red colour represents upregulation and blue colour means downregulation. (F) The bubble plot showed the expression of cytokines in neutrophils. (G) The bubble plot showed the expression of growth factors in neutrophils. (H) The bubble plot showed the interaction between neutrophils with ECs. Blue represents the ligand in ECs, red represents the receptor in neutrophils. (I) Expression of SELL in neutrophils was shown in the tSNE view (the up panel) and violin plot (the down panel). (J) The inflammatory cell death pathways of neutrophils. (K) The bubble plot showed the expression of ferroptosis‐related genes in neutrophils. (L) The relative proportion of the different types of neutrophils in GM and LC.
FIGURE 5
FIGURE 5
Endothelial cells communicate with tumour‐associated fibroblast cells. (A) The UMAP view of ECs. (B) The relative proportion of ECs in GM and LC. (C) Marker gene expression profiles of ECs showed with bubble plots. (D) KEGG pathway enriched in ECs. Red colour represents upregulation and blue colour means downregulation. (E) The bubble plot showed the expression of cytokines in ECs. (F) The bubble plot showed the expression of growth factors in ECs. (G) The expression of EGR1, HIF3A and HIF1A in ECs. (H) Bubble plots showed the expression of endothelial function‐associated genes. (I) Numbers of inferred interactions between ECs with other cell types. (J) Spatial organisation (angle = 165) of fibroblast and ECs in the pseudo‐space inferred by CSOmap based on the scRNA‐seq data. Each dot represents a cell, and its colour represents the corresponding cell state. (K) The cross‐section of z = 0 of the pseudo‐space. The colour of the dots represents cell density. (L) Location of fibroblast and ECs in the cross‐section of pseudo‐space z = 0. (M) The difference in cell density between cell clusters of fibroblast and ECs. (N) The bubble plot showed the interaction between C0 in ECs with fibroblast clusters. Blue represents the ligand in ECs, red represents the receptor in fibroblast.
FIGURE 6
FIGURE 6
The heterogeneity for T cells and the association with the expression of PDL1. (A) The UMAP view of different types of T cells. (B) The relative proportion of the different types of T cells in LC and GM. (C) The relative proportion of the different types of T cells in each patient of LC and GM. (D) Violin plots showed the expression of PD1 in CD4+ and CD8+ subtypes. (E) The relative proportion of subtype of CD8+ T cells in PDL1 high and low expression group. (F) Bubble plots showed the expression of the immune checkpoint activation receptor gene of the subtype of CD8+ T cells in the PDL1 high and low expression group. (G) Bubble plots showed the expression of the immune checkpoint inhibition receptor gene of the subtype of CD8+ T cells in the PDL1 high and low expression group. (H) Bubble plots showed the expression of immune checkpoint activation receptor genes of a subtype of CD8+ T cells. (I) Bubble plots showed the expression of immune checkpoint inhibition receptor genes of a subtype of CD8+ T cells. (J) Correlation between the gene expression of GZMB and the infiltration of CTLs was shown on the left and the Kaplan–Meier plots of overall survival (OS) for LUAD patients with CTLs with the top and bottom TIDE prediction scores based on gene expression of GZMB (on the right). The p value was calculated by testing the association between TIDE prediction scores and overall survival with the two‐sided Wald test in a Cox‐PH regression. (K) Correlation of expression of GZMB in CD8+ PD1+ T cells with the fraction of CD8+ PD1+ T cells in metastatic LUAD.
FIGURE 7
FIGURE 7
Epithelial cells harbour a subset of cancer stem cells and show heterogeneity of DNA copy number variations. (A) Differentiation status of malignant cells analysed by CytoTRACE. (B) RNA velocity of malignant cells. (C) Differentiation trajectory of malignant cells, with each colour coded for clusters (left) and pseudo‐time (right). (D) Expression of FOSL1 in malignant cells was shown in the tSNE view. (E) The expression of EPCAM, TRIM29 and DKK1 was shown with violin plots. (F) Multiplex immunofluorescence staining of LC tissue. (G) Candidate drugs that target AREG and F3 in C3 or G6PD in C8 of malignant cells. (H) Bubble plots showed the expression of genes related to CIN was shown. (I) Expression of genes in CIN cells. (J) KEGG pathway of total epithelial cells enriched between PDL1 high compared with PDL1 low expression group. Circle means downregulated pathways and triangle means upregulated pathways. The dot represents the enriched gene number. (K) Expression of GATA6 was shown with violin plots and tSNE view. (L) Kaplan–Meier plots of overall survival (OS) for NSCLC patients with CTLs with the top and bottom TIDE prediction scores. The P value was calculated by testing the association between TIDE prediction scores and overall survival with the two‐sided Wald test in a Cox‐PH regression. (M) Expression of genes was shown with violin plots and tSNE view.

References

    1. Cagney DN, Martin AM, Catalano PJ, et al. Incidence and prognosis of patients with brain metastases at diagnosis of systemic malignancy: a population‐based study. Neuro‐oncol. 2017;19(11):1511‐1521. - PMC - PubMed
    1. Rittmeyer A, Barlesi F, Waterkamp D, et al. Atezolizumab versus docetaxel in patients with previously treated non‐small‐cell lung cancer (OAK): a phase 3, open‐label, multicentre randomised controlled trial. Lancet. 2017;389(10066):255‐265. - PMC - PubMed
    1. Reck M, Rodriguez‐Abreu D, Robinson AG, et al. Pembrolizumab versus chemotherapy for PD‐L1‐positive non‐small‐cell lung cancer. N Engl J Med. 2016;375(19):1823‐1833. - PubMed
    1. Xia L, Liu Y, Wang Y. PD‐1/PD‐L1 blockade therapy in advanced non‐small‐cell lung cancer: current status and future directions. Oncologist. 2019;24(suppl 1):S31‐S41. - PMC - PubMed
    1. Quail DF, Joyce JA. The microenvironmental landscape of brain tumors. Cancer Cell. 2017;31(3):326‐341. - PMC - PubMed

Publication types