. 2023 Jan;64(1):218-230.
doi: 10.1111/epi.17457. Epub 2022 Nov 16.

Brain molecular mechanisms in Rasmussen encephalitis

Affiliations

Brain molecular mechanisms in Rasmussen encephalitis

Dominique F Leitner et al. Epilepsia. 2023 Jan.

Abstract

Objective: This study was undertaken to identify molecular mechanisms in brain tissue of Rasmussen encephalitis (RE) when compared to people with non-RE epilepsy (PWE) and control cases using whole exome sequencing (WES), RNAseq, and proteomics.

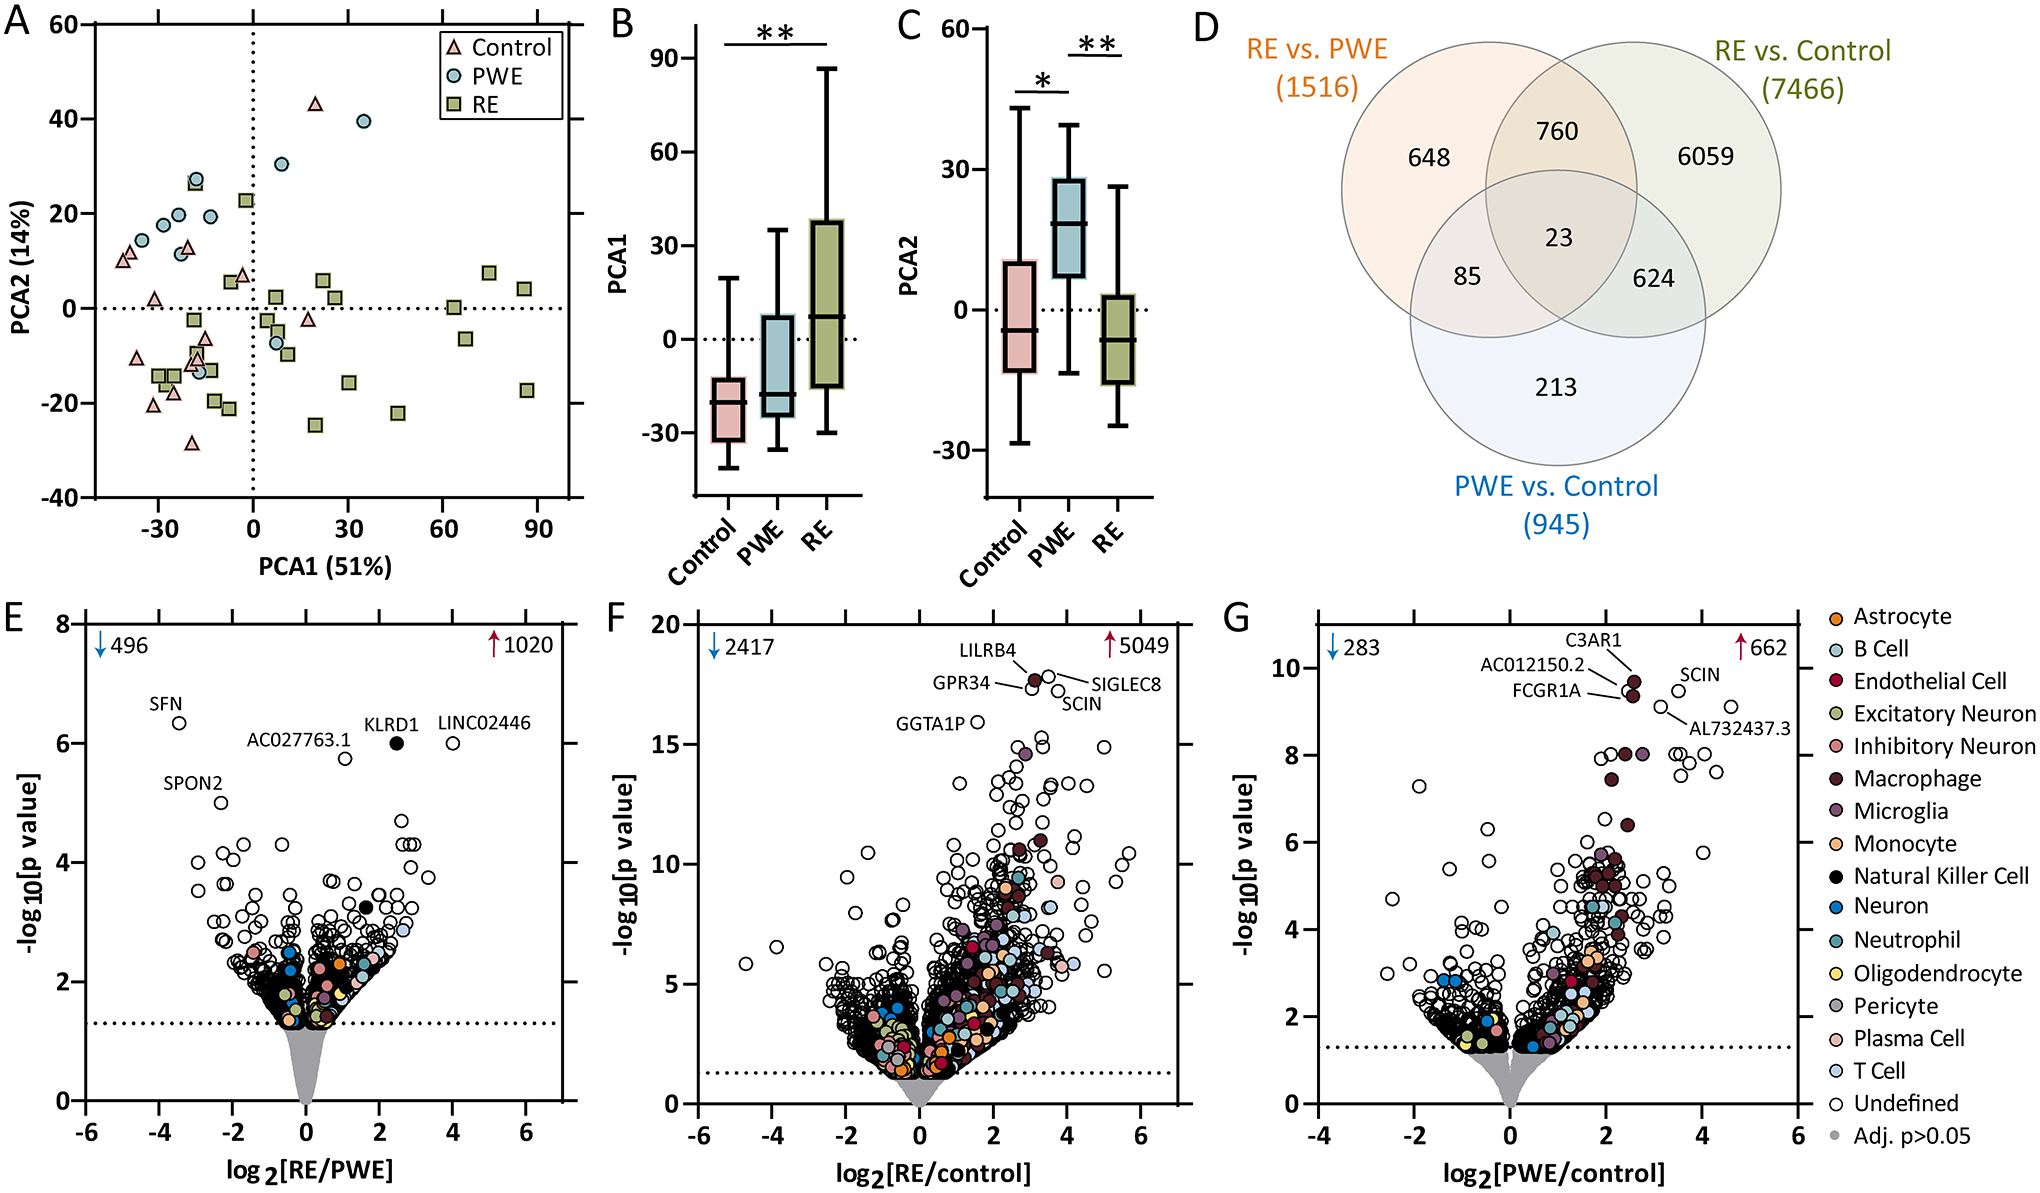
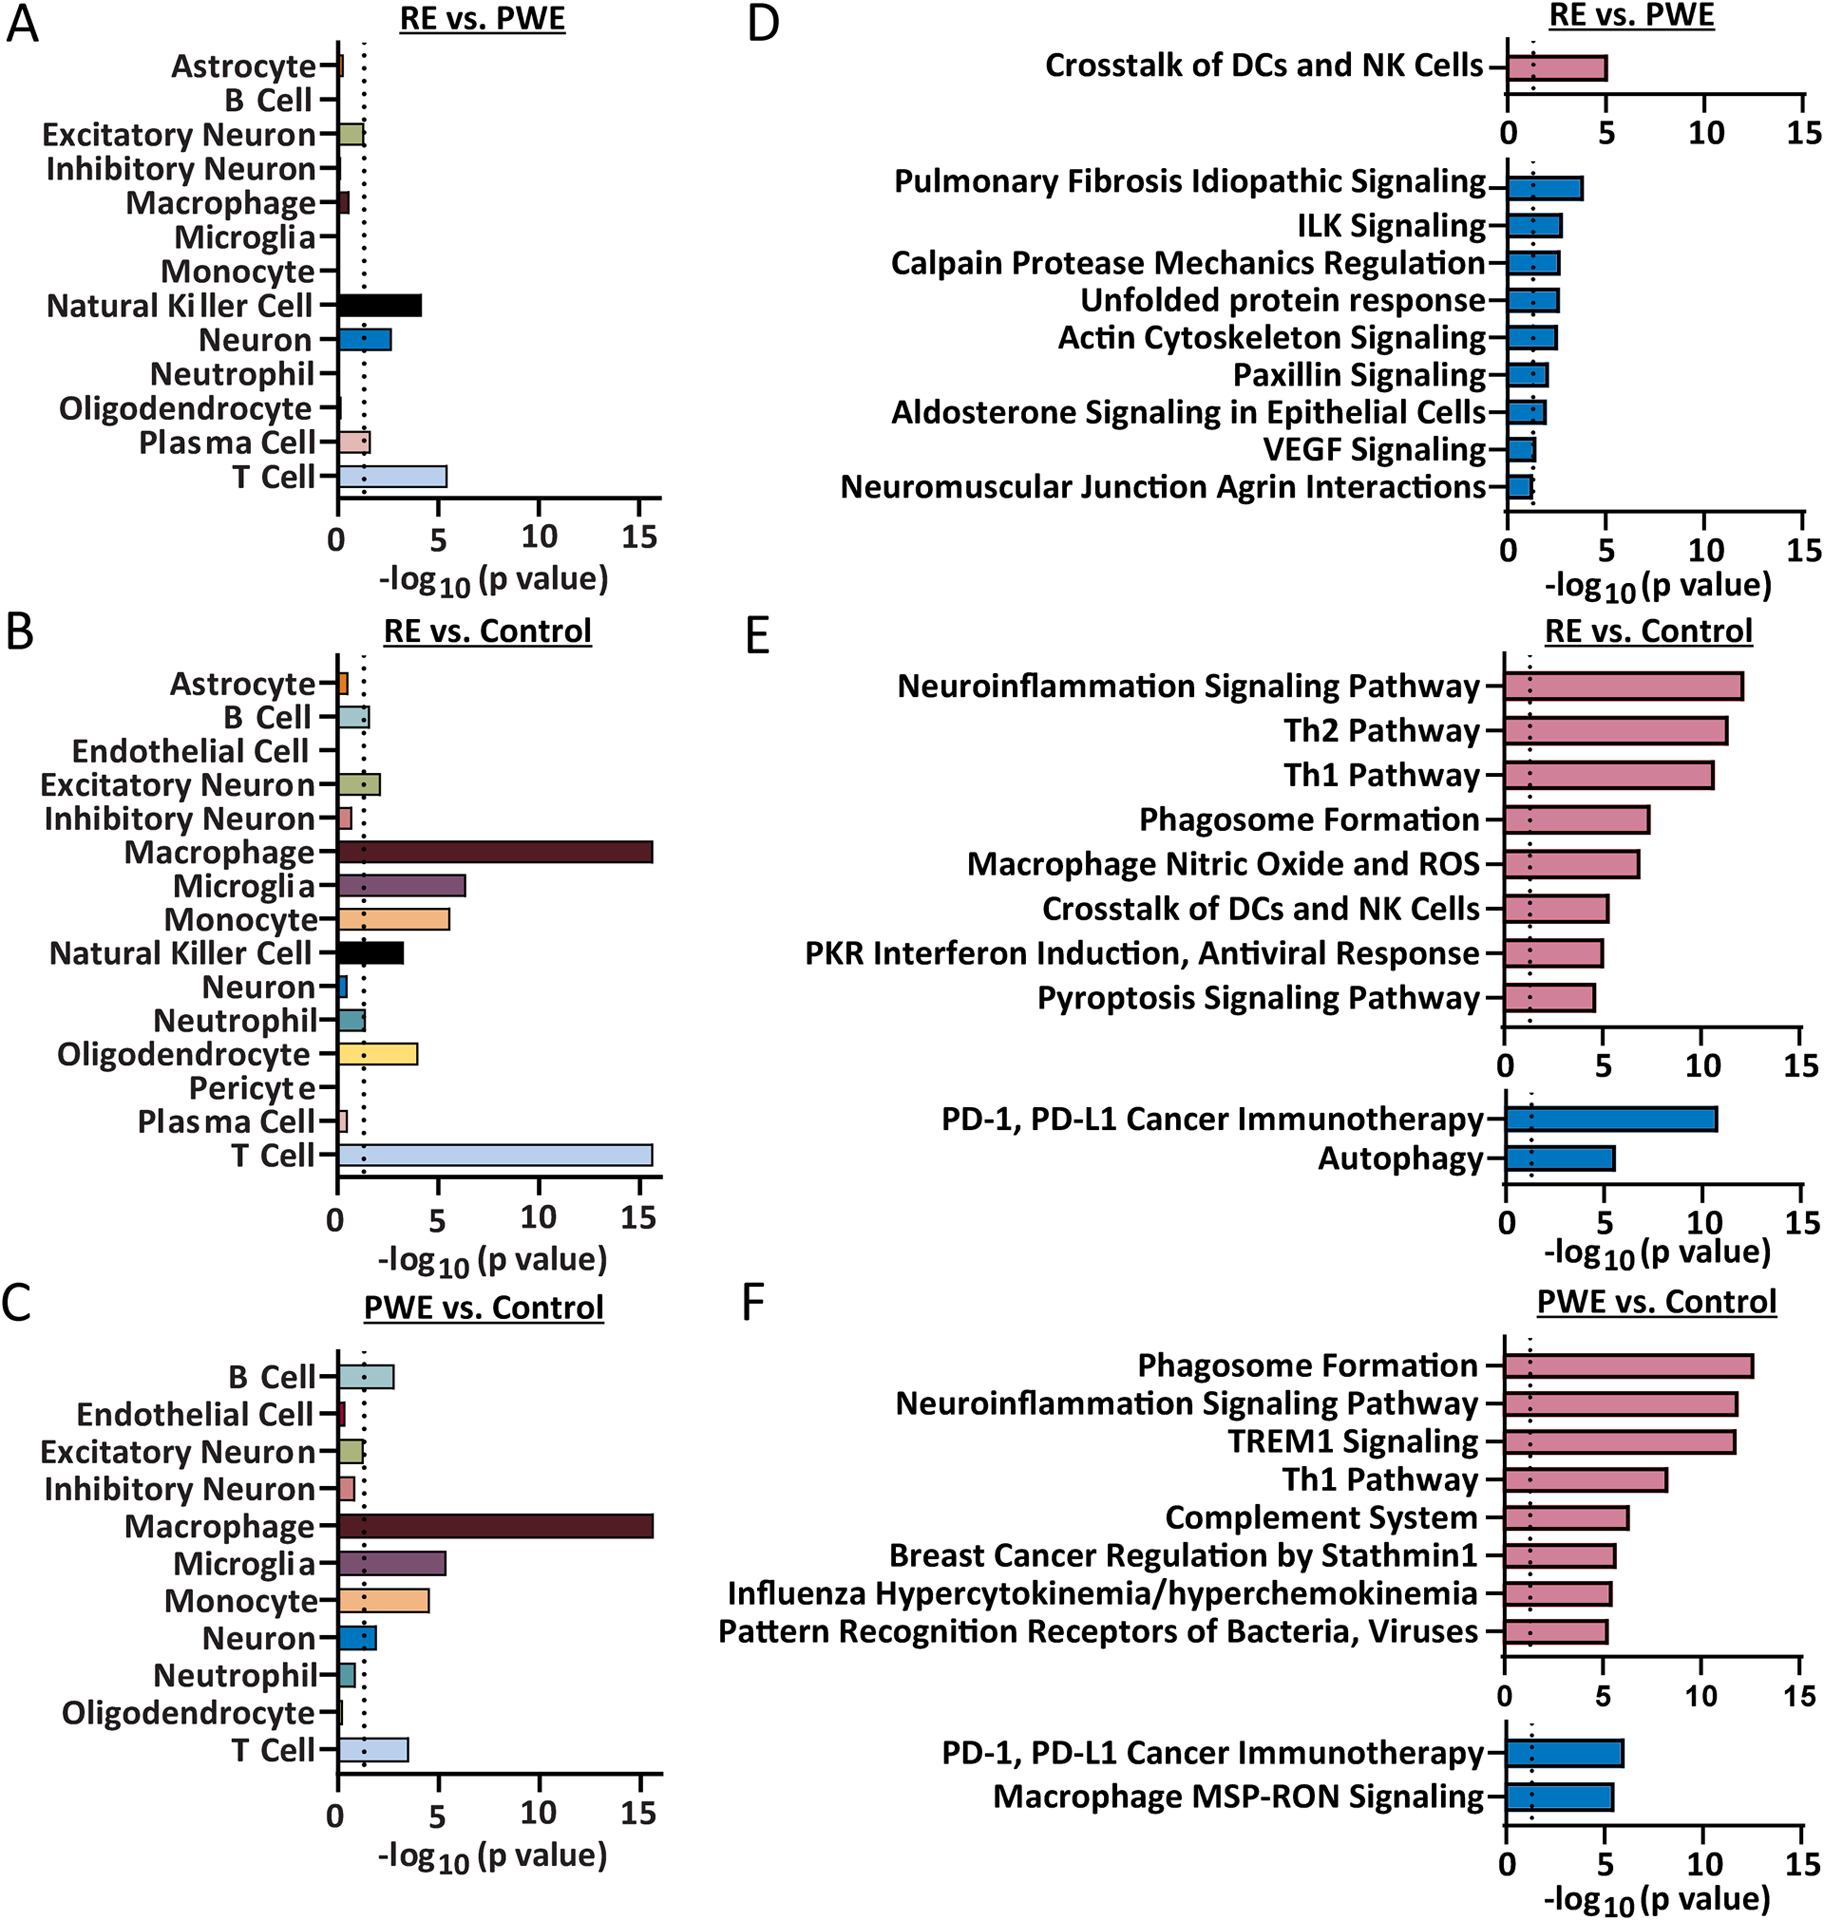
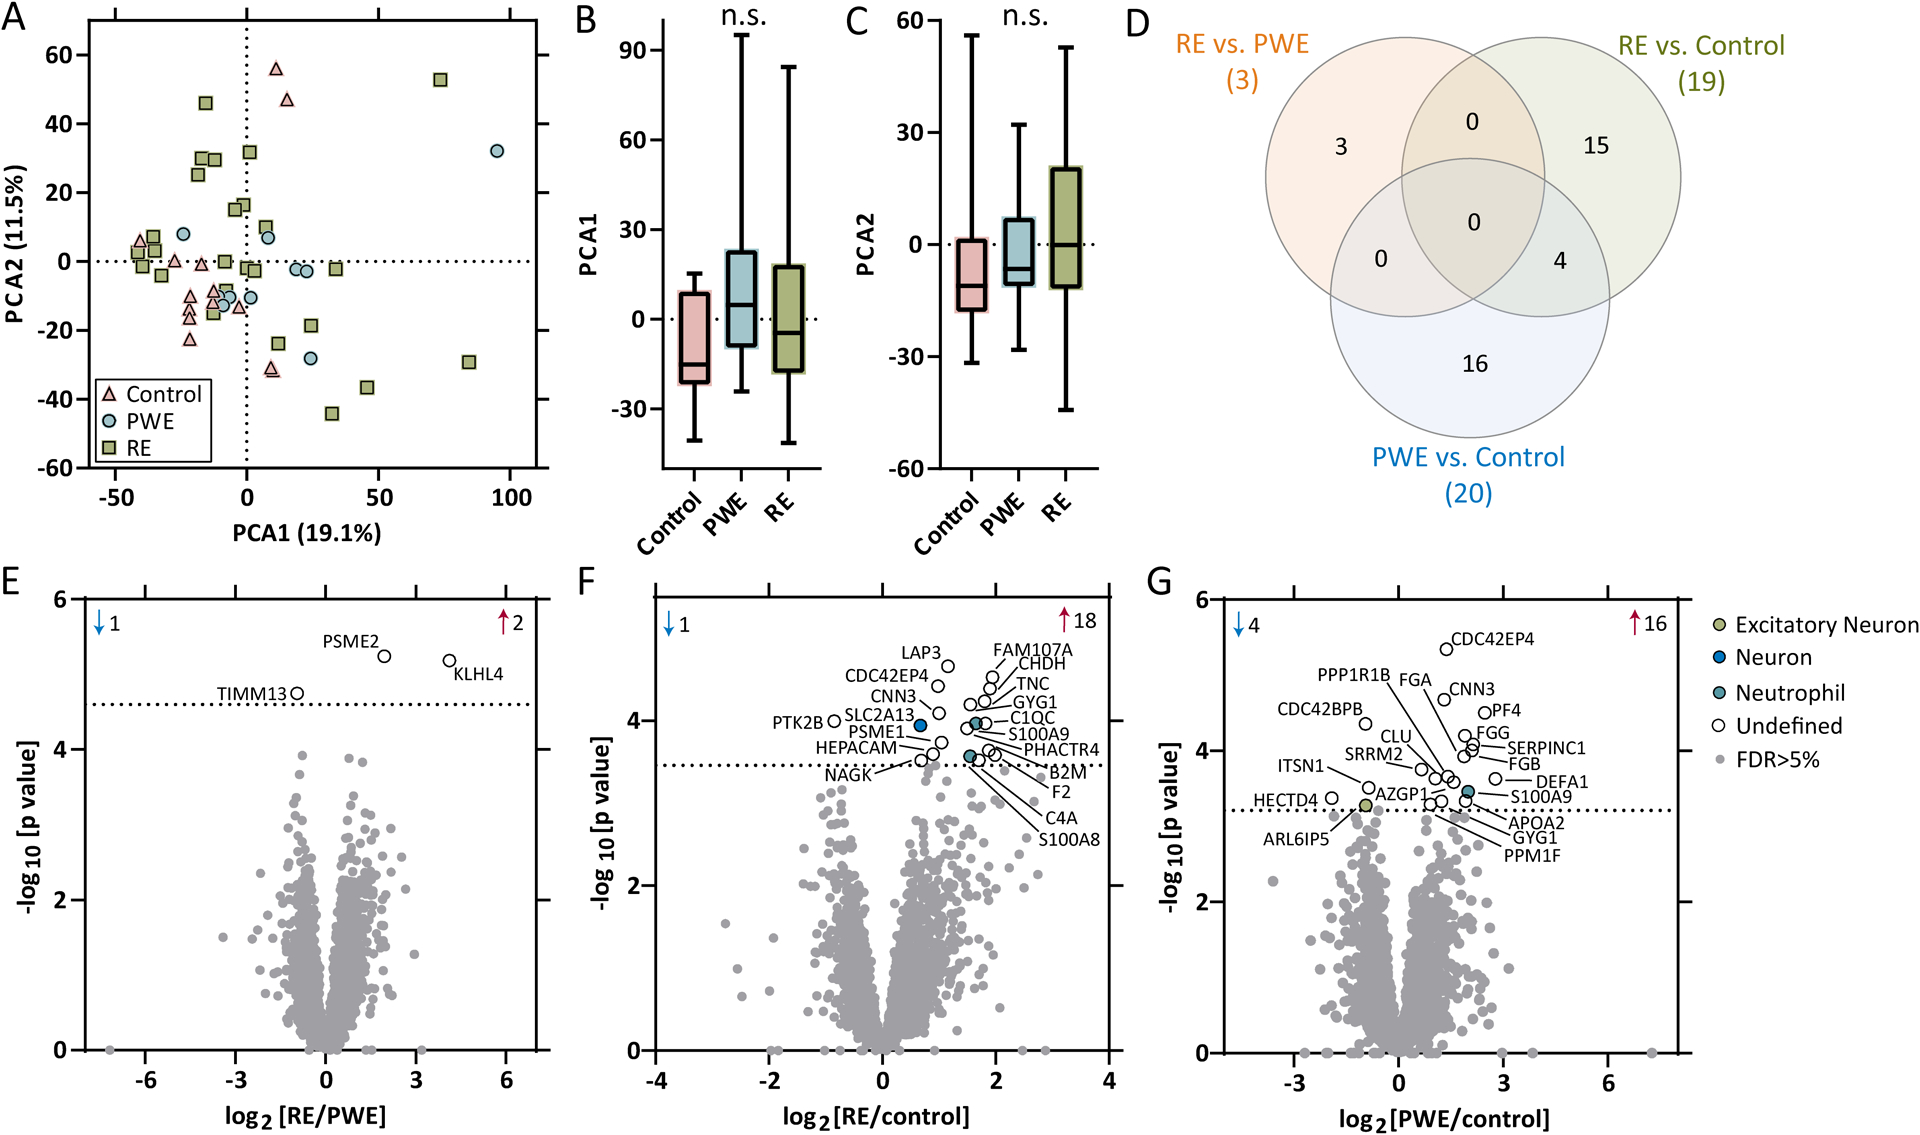
Methods: Frozen brain tissue (ages = 2-19 years) was obtained from control autopsy (n = 14), surgical PWE (n = 10), and surgical RE cases (n = 27). We evaluated WES variants in RE associated with epilepsy, seizures, RE, and human leukocyte antigens (HLAs). Differential expression was evaluated by RNAseq (adjusted p < .05) and label-free quantitative mass spectrometry (false discovery rate < 5%) in the three groups.

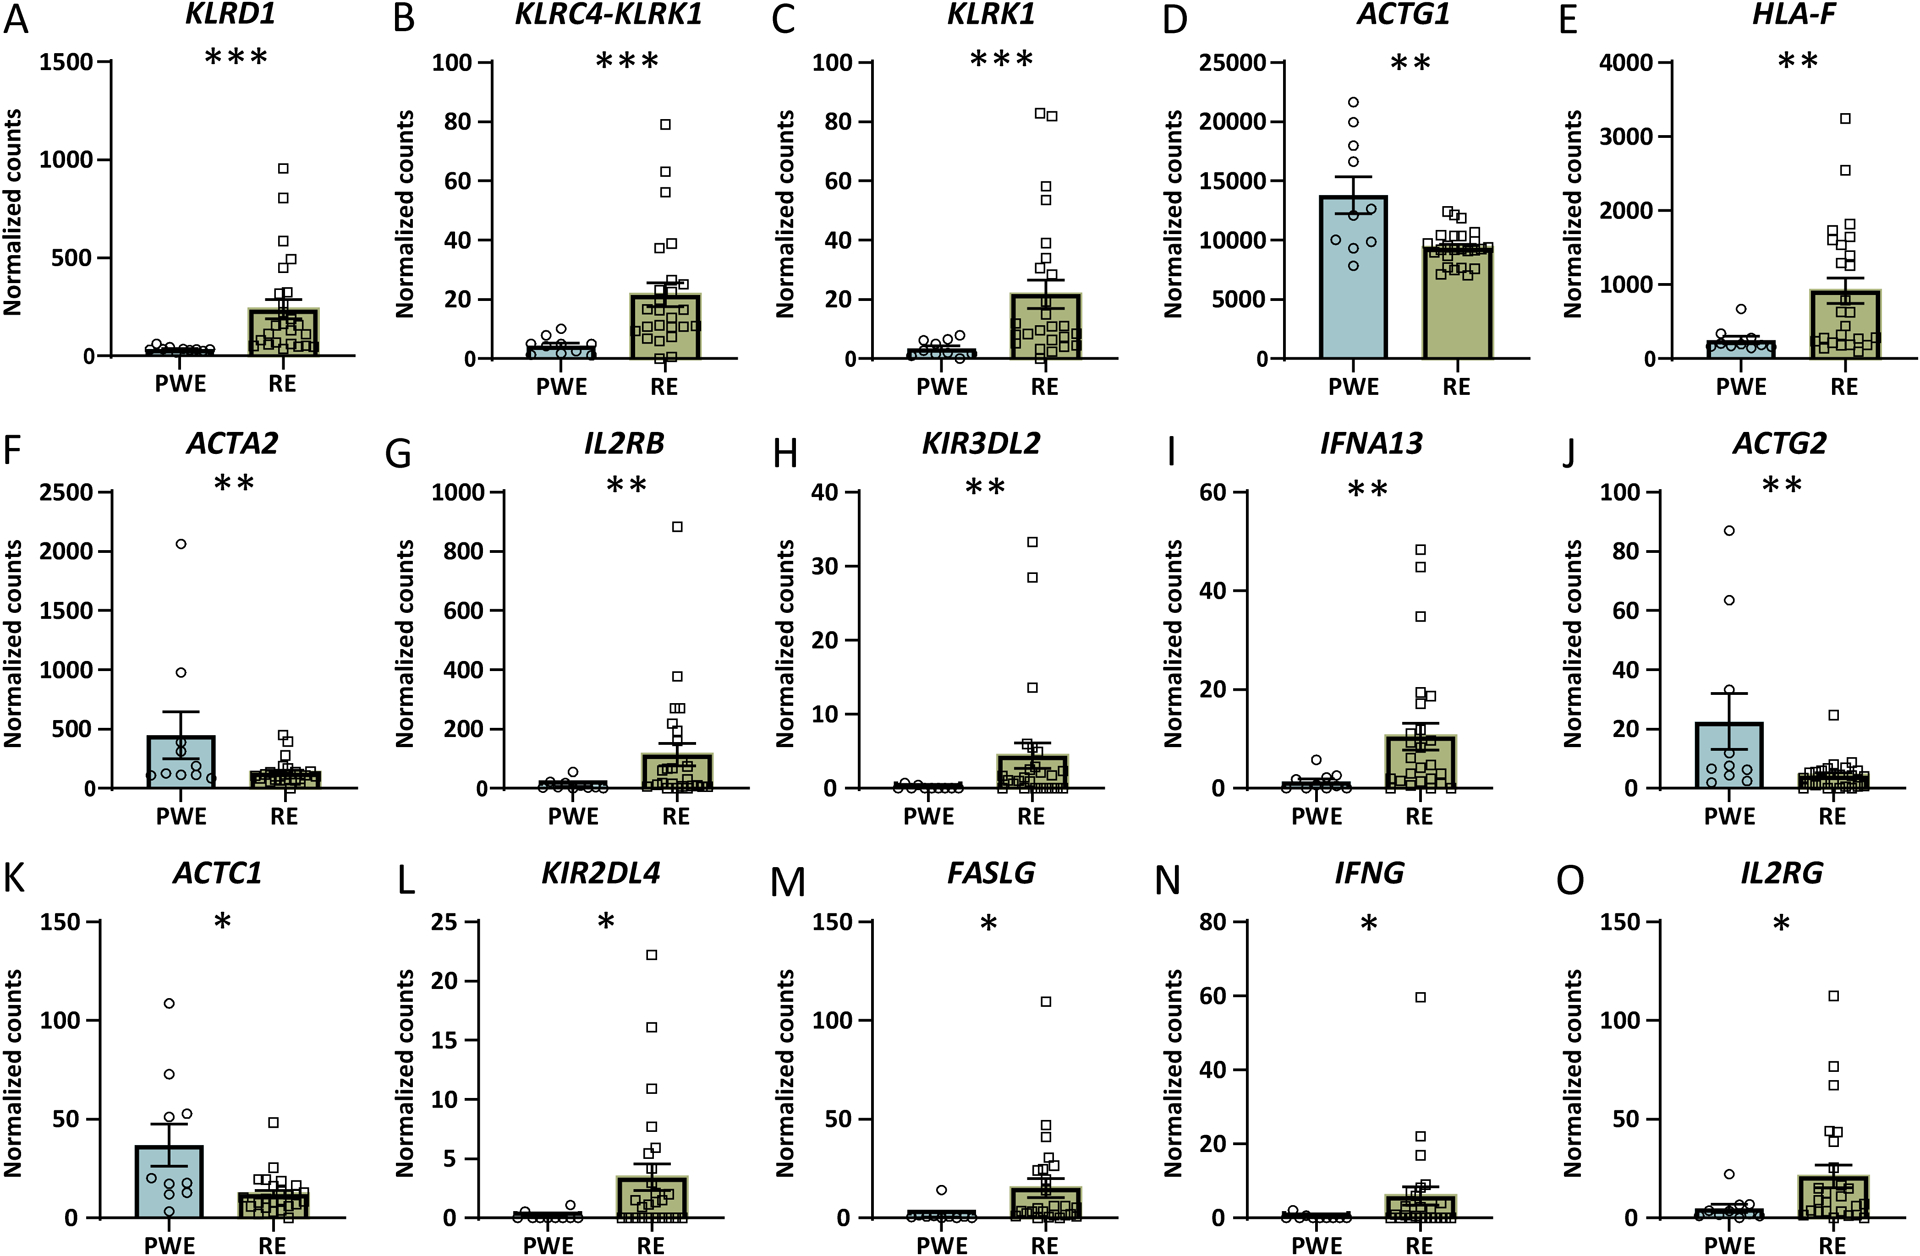
Results: WES revealed no common pathogenic variants in RE, but several rare and likely deleterious variants of unknown significance (VUS; ANGPTL7/MTOR, SCN1A, FCGR3B, MTOR) and more common HLA VUS in >25% of RE cases (HLA-DRB1, HLA-DQA2), all with allele frequency < 5% in the general population. RNAseq in RE versus PWE (1516 altered transcripts) revealed significant activation of crosstalk between dendritic and natural killer cells (p = 7.94 × 10⁻⁶ , z = 2.65), in RE versus control (7466 transcripts) neuroinflammation signaling activation (p = 6.31 × 10⁻¹³ , z = 5.07), and in PWE versus control (945 transcripts) phagosome formation activation (p = 2.00 × 10⁻¹³ , z = 5.61). Proteomics detected fewer altered targets.

Significance: In RE, we identified activated immune signaling pathways and immune cell type annotation enrichment that suggest roles of the innate and adaptive immune responses, as well as HLA variants that may increase vulnerability to RE. Follow-up studies could evaluate cell type density and subregional localization associated with top targets, clinical history (neuropathology, disease duration), and whether modulating crosstalk between dendritic and natural killer cells may limit disease progression.

Keywords: RNAseq; Rasmussen encephalitis; exome; proteomics.


Figures

Figure 1.
Figure 1.. RNAseq PCA and differential expression analysis.
A-B) PCA of RNAseq (control: n = 14, PWE: n = 10, RE: n = 25) in brain tissue indicated segregation of the RE group from the control group in PCA1 (p = 0.0040). C) In PCA2, there was segregation of the control and PWE groups (p = 0.023), as well as the PWE and RE groups (p = 0.0015). D) Differential expression analysis for each pairwise comparison are indicated, as well as overlap in the number of significant transcripts, at an adjusted p value < 0.05 (dotted line), when comparing E) RE vs. PWE (1516 transcripts), F) RE vs. control (7466 transcripts), and G) PWE vs. control (945 transcripts). Annotations include the number of significantly increased (red arrow) and decreased (blue arrow) transcripts, top 5 altered transcripts are annotated by gene name, and brain and immune cell type annotations for each significant transcript are indicated.
Figure 2.
Figure 2.. Cell types and signaling pathways associated with differentially expressed transcripts by RNAseq.
All cell type annotations associated with significantly altered transcripts are indicated for each pairwise comparison. A) Cell type annotation analysis of differentially expressed transcripts by Fisher’s exact test indicated enrichment (p < 0.05) for transcripts associated with T cell (p = 3.46 × 10⁻⁶), NK cell (p = 6.53 × 10⁻⁵), neuron (p = 2.00 × 10⁻³), plasma cell (p = 2.29 × 10⁻²), and excitatory neuron (p = 4.85 × 10⁻²) in RE vs. PWE. B) For RE vs. control, there was enrichment for transcripts with annotations for T cell (p < 2.20 × 10⁻¹⁶), macrophage (p < 2.20 × 10⁻¹⁶), microglia (p = 4.25 × 10⁻⁷), monocyte (p = 2.58 × 10⁻⁶), oligodendrocyte (p = 1.00 × 10⁻⁴), NK cell (p = 5.00 × 10⁻⁴), excitatory neuron (p = 6.90 × 10⁻³), B cell (p = 2.51 × 10⁻²), and neutrophil (p = 3.91 × 10⁻²). C) For PWE vs. control, there was enrichment for transcripts with annotations for macrophage (p < 2.20 × 10⁻¹⁶), microglia (p = 4.27 × 10⁻⁶), monocyte (p = 2.71 × 10⁻⁵), T cell (p = 3.00 × 10⁻⁴), B cell (p = 1.50 × 10⁻³), and neuron (p = 1.20 × 10⁻²). D) For RE vs. PWE, the 1516 altered transcripts were significantly associated with 1 activated pathway (red) and 9 inhibited pathways (blue), detailed further in Supplemental Table 6 (p value of overlap < 0.05, z score ≥|2|). The most significantly altered pathway was activation of crosstalk between DCs and NK cells (p value of overlap = 7.94 × 10⁻⁶, z = 2.65). E) For RE vs. control, the 7466 transcripts were associated with 23 activated and 18 inhibited pathways, detailed further in Supplemental Table 7. The top 10 significantly altered pathways are indicated, the most significant was activation of the neuroinflammation signaling pathway (p = 6.31 × 10⁻¹³, z = 5.07). F) For PWE vs. control, the 945 transcripts were associated with 27 activated and 3 inhibited pathways, detailed further in Supplemental Table 8. The top 10 significantly altered pathways are indicated, the most significant was activation of the phagosome formation pathway (p = 2.0 × 10⁻¹³, z = 5.61).
Figure 3.
Figure 3.. Altered transcripts in RE vs. PWE crosstalk between DCs and NK cells signaling pathway by RNAseq.
When comparing RE and PWE by RNAseq, the most significantly altered signaling pathway was activation of the crosstalk between DCs and NK cells signaling pathway (p value of overlap = 7.94 × 10⁻⁶, z = 2.65). A-O) The significantly altered transcripts associated with this pathway are depicted in order of decreasing significance (* adjusted p < 0.05, ** p < 0.01, *** p < 0.0001). Error bars indicate SEM.
Figure 4.
Figure 4.. Proteomics PCA and differential expression analysis.
A-C) PCA of proteomics (control: n = 14, PWE: n = 10, RE: n = 25) in brain tissue indicated no segregation of groups. D) Differential expression analysis for each pairwise comparison are indicated, as well as overlap in the number of significant transcripts, at a 5% FDR (dotted line), when comparing E) RE vs. PWE (3 proteins), F) RE vs. control (19 proteins), and G) PWE vs. control (20 proteins). Annotations include the number of significantly increased (red arrow) and decreased (blue arrow) transcripts, all altered proteins are annotated by gene name, and brain and immune cell type annotations for each significant protein are indicated.

References

    1. Varadkar S, Bien CG, Kruse CA, et al. Rasmussen’s encephalitis: clinical features, pathobiology, and treatment advances. The Lancet Neurology. Feb 2014;13(2):195–205. doi:10.1016/s1474-4422(13)70260-6 - DOI - PMC - PubMed
    1. Pardo CA, Vining EP, Guo L, Skolasky RL, Carson BS, Freeman JM. The pathology of Rasmussen syndrome: stages of cortical involvement and neuropathological studies in 45 hemispherectomies. Epilepsia. May 2004;45(5):516–26. doi:10.1111/j.0013-9580.2004.33103.x - DOI - PubMed
    1. Bien CG, Bauer J, Deckwerth TL, et al. Destruction of neurons by cytotoxic T cells: a new pathogenic mechanism in Rasmussen’s encephalitis. Ann Neurol. Mar 2002;51(3):311–8. doi:10.1002/ana.10100 - DOI - PubMed
    1. Schwab N, Bien CG, Waschbisch A, et al. CD8+ T-cell clones dominate brain infiltrates in Rasmussen encephalitis and persist in the periphery. Brain. May 2009;132(Pt 5):1236–46. doi:10.1093/brain/awp003 - DOI - PubMed
    1. Owens GC, Garcia AJ, Mochizuki AY, et al. Evidence for Innate and Adaptive Immune Responses in a Cohort of Intractable Pediatric Epilepsy Surgery Patients. Front Immunol. 2019;10:121. doi:10.3389/fimmu.2019.00121 - DOI - PMC - PubMed

Publication types

Substances

Supplementary concepts