In vivo single-cell transcriptomics reveal Klebsiella pneumoniae skews lung macrophages to promote infection
- PMID: 36337046
- PMCID: PMC9727930
- DOI: 10.15252/emmm.202216888
In vivo single-cell transcriptomics reveal Klebsiella pneumoniae skews lung macrophages to promote infection
Abstract
The strategies deployed by antibiotic-resistant bacteria to counteract host defences are poorly understood. Here, we elucidate a novel host-pathogen interaction resulting in skewing lung macrophage polarisation by the human pathogen Klebsiella pneumoniae. We identify interstitial macrophages (IMs) as the main population of lung macrophages associated with Klebsiella. Single-cell transcriptomics and trajectory analysis of cells reveal type I IFN and IL10 signalling, and macrophage polarisation are characteristic of infected IMs, whereas Toll-like receptor (TLR) and Nod-like receptor signalling are features of infected alveolar macrophages. Klebsiella-induced macrophage polarisation is a singular M2-type we termed M(Kp). To rewire macrophages, Klebsiella hijacks a TLR-type I IFN-IL10-STAT6 axis. Absence of STAT6 limits Klebsiella intracellular survival and facilitates the clearance of the pathogen in vivo. Glycolysis characterises M(Kp) metabolism, and inhibition of glycolysis results in clearance of intracellular Klebsiella. Capsule polysaccharide governs M(Kp). Klebsiella also skews human macrophage polarisation towards M(Kp) in a type I IFN-IL10-STAT6-dependent manner. Klebsiella induction of M(Kp) represents a novel strategy to overcome host restriction, and identifies STAT6 as target to boost defences against Klebsiella.
Keywords: Klebsiella; IL10; STAT6; macrophage polarisation; type I IFN.
©2022 The Authors. Published under the terms of the CC BY 4.0 license.
Figures

- A–F
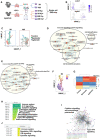
Ten to twelve‐week‐old age‐ and sex‐matched C57BL/6 mice were infected intranasally with mCherry tagged Kp52145. After 24 h or 48 h post‐infection (n = 10/condition) lungs were harvested and processed for flow cytometric analysis to assess macrophages populations. (A) % Ly6C+CD11b+CD11c−SiglecF− monocyte (MNs), (B) % Ly6C+CD11b−CD11c+SiglecF+ alveolar macrophage (AMs) and (C) % Ly6C+CD11b+CD11c+SiglecF− interstitial macrophage (IMs) in Kp52145‐infected animals compared to PBS controls. (D) Percentage of MN, AM and IM associated with Kp52145 from infected individual mice. (E) C57BL/6 mice were treated with control liposomes (PBS) or clodronate ones intranasally (n = 6 per group), and then infected with Kp52145. Bacterial burden in the lungs 24 h post infection was established by serial dilutions of lung homogenates on Salmonella‐Shigella agar. (F) Liposomes were administered intravenously (n = 6 per group), and bacterial burden determined by plating 24 h post infection.

Diagram of the experimental approach to generate the different IMs and AMs samples for single‐cell RNA sequencing (scRNAseq). C57BL/6 mice (n = 17 per group) were infected intranasally with mCherry tagged Kp52145, after 24 h, lungs were excised, and processed for cell sorting. From pooled samples AM and IM populations were sorted from PBS controls and infected mice. In the latter group, cells were sorted to separate bystander cells and cells with associated bacteria. The viability of each of the samples was determined to be higher than 95% before carrying out 10× genomics single‐cell RNA sequencing.
Marker gene detection and differential expression testing was performed in Seurat using the MAST package. Higher resolution clustering using uniform manifold approximation and projection (UMAP) dimensionality reduction analysis showing selected genes, cx3cr1, IM marker and siglecF, AM marker.
UMAP of clustering within cells from PBS mock‐infected mice (control), bystander and Kp52145‐associated IMs and AM populations.
Network enrichment mapping generated from significantly upregulated genes of IMs with associated bacteria. Analysis was performed using the g:SCS method for multiple testing correction (gProflier), the Reactome database as a data source and the default settings for the other parameters in gProflier. Results were exported to Cytoscape and visualised using the AutoAnnotate plug.
Network enrichment mapping generated from significantly upregulated genes of bystander IMs. Analysis was performed using the g:SCS method for multiple testing correction (gProflier), the Reactome database as a data source and the default settings for the other parameters in gProflier. Results were exported to Cytoscape and visualised using the AutoAnnoate application.
Monocle analysis to determine the temporal pattern of gene expression over pseudotime in bystander and Kp52145‐associated IMs from infected animals compared to PBS controls. Monocle analysis revealed 7 modules of genes showing similar pattern of expression.
Heat map showing relative expression of the 7 modules found in IMs.
Pathway analysis of modules 3 and 4 corresponding to Kp52145‐infected IMs. Analysis was performed using the g:SCS method for multiple testing correction, the Reactome database as a data source and the default settings for the other parameters in G:profiler.
STRING database was used to predict protein–protein interactions using the clustering algorithm MCL with default parameters using as data source the genes within modules 3 and 4.
Pathway analysis of module 6 corresponding to bystander IMs. Analysis was performed using the g:SCS method for multiple testing correction, the Reactome database as a data source and the default settings for the other parameters in G:profiler.

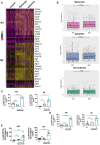
- A
Heat map presents relative expression of the indicated genes between IMs from non‐infected mice (control), and bystander and Kp52145‐associated IMs from infected mice. Selected genes are related to M1 and M2 macrophage polarisation.
- B
Expression of M1 and M2 genes (shown in panel A) calculated as the average log‐normalised expression. Each dot represents a cell, and the graph shows the mean and SEM per group of M1 and M2 genes. Statistical analysis were carried out using unpaired t test. The P values are indicated in the figure.
- C–E
Analysis by flow cytometry of the levels of M(Kp) markers expressed by cells from PBS mock infected mice (black dots), and by cells from infected mice (blue dots) with and without associated Kp52145. (C) Percentage of positive cells for Arg1. (D) Percentage of positive cells for Fizz1. (E) Percentage of positive cells for CD163.

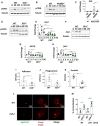
- A
Immunoblot analysis of the levels of the indicated proteins in lysates from non‐infected (ni) and infected wild‐type iBMDMs for 60 or 120 min.
- B
klf4 mRNA levels were assessed by qPCR in wild‐type iBMDMs infected with Kp52145 for 1, 3 or 5 h.
- C
Immunoblot analysis of Klf4 and tubulin levels in lysates from non‐infected (ni) and infected wild‐type iBMDMs for 60 or 120 min.
- D–F
Analysis by flow cytometry of the levels of M(Kp) markers expressed by IMs from PBS‐mock‐infected mice (black dots), and by IMs from infected mice (blue dots) with and without associated Kp52145. (D) Percentage of positive cells for Arg1. (E) Percentage of positive cells for Fizz1. (F) Percentage of positive cells for iNOS.
- G
arg1 mRNA levels were assessed by qPCR in wild‐type and stat6 −/− iBMDMs non‐infected (ni) or infected with Kp52145 for 1, 3 or 5 h.
- H
Immunoblot analysis of Arg1 and tubulin levels in lysates from non‐infected (ni) and infected wild‐type and stat6 −/− iBMDMs for 60 or 120 min.
- I
il10 mRNA levels were assessed by qPCR in wild‐type (WT) and stat6 −/− iBMDMs non‐infected (ni) or infected with Kp52145 for 1, 3 or 5 h.

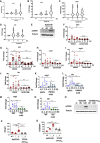
- A
Immunoblot analysis of
phospho‐STAT6 (pSTAT6 ) and tubulin levels in lysates from non‐infected (ni) and infected with different K. pneumoniae strains, Kp52145,NJST258 ‐1,NJST258 ‐2 orSHG10 , for 60 min. - B
Immunoblot analysis of
phospho‐STAT6 (pSTAT6 ) and tubulin levels in lysates from non‐infected (ni) and infected with Kp52145 orKP35 for 60 or 120 min. - C, D
Analysis by flow cytometry of the levels of M(Kp) markers expressed by IMs and AMs from PBS‐mock‐infected mice (black dots), and by IMs and AMs from infected mice (purple dots) with and without associated KP35 24 h post infection. (C) Percentage of positive cells for Arg1. (D) Percentage of positive cells for CD206.
- E
Immunoblot analysis of Arg1 and tubulin levels in lysates from wild‐type and stat6 −/− iBMDMs non‐infected (ni) and infected with KP35 for 60 min or 120 min.
- F
Percentage of wild‐type (WT) and stat6 −/− iBMDMs with and without associated KP35 positive for CD206 5 h post infection. KP35 was tagged with mCherry.
- G
Percentage of wild‐type (WT) and stat6 −/− iBMDMs with and without associated KP35 positive for MCH‐II 5 h post infection. KP35 was tagged with mCherry.

Kp52145 adhesion to wild‐type (WT) and stat6 −/− iBMDMs. Cells were infected with Kp52145 for 30 min, washed, cell lysed with saponin and bacteria quantified after serial dilution followed by plating on LB agar plates.
Phagocytosis of Kp52145 by wild‐type (WT) and stat6 −/− iBMDMs. Cells were infected for 30 min, wells were washed, and it was added medium containing gentamicin (100 μg/ml) to kill extracellular bacteria. After 30 min, cells were washed, cell lysed with saponin and bacteria quantified after serial dilution followed by plating on LB agar plates.
Kp52145 intracellular survival in wild‐type (W)T and stat6 −/− 5 h after addition of gentamycin (30 min of contact). Results are expressed as % of survival (CFUs at 5 h versus 30 min in stat6 −/− cells normalised to the results obtained in wild‐type macrophages set to 100%).
Immunofluorescence confocal microscopy of the co‐localisation of Kp52145 harbouring pFPV25.1Cm, and cresyl violet dye in wild‐type (WT) and stat6 −/− macrophages. The images were taken 90 min post infection. Images are representative of duplicate coverslips of three independent experiments.
Percentage of Kp52145 harbouring pFPV25.1Cm co‐localisation with cresyl violet over a time course. Values are given as mean percentage of Kp52145 co‐localising with the marker ± SEM. The number of infected cells counted per time in three independent experiments are indicated in the figure.
Bacterial burden in the lungs of Kp52145‐infected wild‐type and stat6 −/− mice (n = 7 per group) 24 h post infection. Each dot represents one animal.
Bacterial dissemination assessed by quantifying CFUs in the spleens of the same mice as in F.
C56BL/6 mice were treated 24 h prior to infection with the STAT6 inhibitor AS1517499 (10 mg/kg in 200 μl volume by i.p) and 6 h post infection (5 mg/kg in 30 μl volume intranasally) or vehicle control DMSO (n = 8 per group). Bacterial burden was established by serial dilutions of lung homogenates on Salmonella‐Shigella agar. Each dot represents one animal.
Bacterial dissemination assessed by quantifying CFUs in the spleens from the same infected mice treated with AS1517499 or vehicle control DMSO.

Immunoblot analysis of phospho‐STAT6 (pSTAT6) and tubulin levels in lysates from non‐infected (ni) and infected wild‐type (WT), tlr2 −/−, tlr4 −/− and tlr2/4 −/− iBMDMs for 60 or 120 min.
Immunoblot analysis of Arg1and tubulin levels in lysates from non‐infected (ni) and infected wild‐type (WT), tlr2 −/−, tlr4 −/− and tlr2/4 −/− iBMDMs for 60 or 120 min.
arg1 mRNA levels were assessed by qPCR in wild‐type (WT) and tlr2 −/−, tlr4 −/− and tlr2/4 −/− iBMDMs non‐infected (ni) or infected with Kp52145 for 1, 3 or 5 h.
fizz1 mRNA levels were assessed by qPCR in wild‐type (WT) and tlr2 −/−, tlr4 −/− and tlr2/4 −/− iBMDMs non‐infected (ni) or infected with Kp52145 for 1, 3 or 5 h.
il10 mRNA levels were assessed by qPCR in wild‐type (WT) and tlr2 −/−, tlr4 −/− and tlr2/4 −/− iBMDMs non‐infected (ni) or infected with Kp52145 for 1, 3 or 5 h.
Immunoblot analysis of phospho‐STAT6 (pSTAT6) and tubulin levels in lysates from non‐infected (ni) and infected wild‐type (WT), myd88 −/−, tram/trif −/− for 60 or 120 min.
Immunoblot analysis of Arg1 and tubulin levels in lysates from non‐infected (ni) and infected wild‐type (WT), myd88 −/−, tram/trif −/− for 60 or 120 min.
arg1 mRNA levels were assessed by qPCR in wild‐type (WT), myd88 −/−, tram/trif −/− non‐infected (ni) or infected with Kp52145 for 1, 3 or 5 h.
fizz1 mRNA levels were assessed by qPCR in wild‐type (WT), myd88 −/−, tram/trif −/− non‐infected (ni) or infected with Kp52145 for 1, 3 or 5 h.
il10 mRNA levels were assessed by qPCR in wild‐type (WT), myd88 −/−, tram/trif −/− non‐infected (ni) or infected with Kp52145 for 1, 3 or 5 h.

Immunoblot analysis of phospho‐STAT6 (pSTAT6) and tubulin levels in lysates from non‐infected (ni) and infected wild‐type (WT), or ifnar1 −/− for 60 or 120 min.
Immunoblot analysis of Arg1 and tubulin levels in lysates from non‐infected (ni) and infected wild‐type (WT), or ifnar1 −/− for 60 or 120 min.
arg1 mRNA levels were assessed by qPCR in wild‐type (WT), irf3 −/−, ifnar1 −/− non‐infected (ni) or infected with Kp52145 for 1, 3 or 5 h.
nos2 mRNA levels were assessed by qPCR in wild‐type (WT), irf3 −/−, ifnar1 −/− non‐infected (ni) or infected with Kp52145 for 1, 3 or 5 h.
pparg mRNA levels were assessed by qPCR in wild‐type (WT), irf3 −/−, ifnar1 −/− non‐infected (ni) or infected with Kp52145 for 1, 3 or 5 h.
fizz1 mRNA levels were assessed by qPCR in wild‐type (WT), irf3 −/−, ifnar1 −/− non‐infected (ni) or infected with Kp52145 for 1, 3 or 5 h.
il10 mRNA levels were assessed by qPCR in wild‐type (WT), irf3 −/−, ifnar1 −/− non‐infected (ni) or infected with Kp52145 for 1, 3 or 5 h.
Percentage of wild‐type (WT) and ifnar1 −/− iBMDMs with and without associated Kp52145 positive for Arg1 1, 3 or 5 h post infection. Kp52145 was tagged with mCherry.
Percentage of wild‐type (WT) and ifnar1 −/− iBMDMs with and without associated Kp52145 positive for CD206 1, 3 or 5 h post infection. Kp52145 was tagged with mCherry.
Percentage of wild‐type (WT) and ifnar1 −/− iBMDMs with and without associated Kp52145 positive for MHCII 1, 3 or 5 h post infection. Kp52145 was tagged with mCherry.
Immunoblot analysis of phospho‐STAT6 (pSTAT6) and tubulin levels in lysates from non‐infected (ni) and infected wild‐type (WT), or irf3 −/− for 60 or 120 min.
Immunoblot analysis of Arg1 and tubulin levels in lysates from non‐infected (ni) and infected wild‐type (WT), or irf31 −/− for 60 or 120 min.

Immunoblot analysis of phospho‐CREB (pCREB) and tubulin levels in lysates from non‐infected (ni) and infected wild‐type (WT), or tlr4 −/− for 60 or 120 min.
Immunoblot analysis of phospho‐CREB (pCREB) and tubulin levels in lysates from non‐infected (ni) and infected wild‐type (WT), or myd88 −/− for 60 or 120 min.
il0 mRNA levels were assessed by qPCR in iBMDMs transfected with All Stars siRNA control (AS), or CREB siRNA (CREBsi) non‐infected (ni) or infected with Kp52145 for 3 h.
Immunoblot analysis of phospho‐STAT6 (pSTAT6) and tubulin levels in lysates from non‐infected (ni) and infected wild‐type (WT), or il10 −/− for 60 or 120 min.
arg1 mRNA levels were assessed by qPCR in wild‐type (WT), il10 −/− non‐infected (ni) or infected with Kp52145 for 1, 3 or 5 h.
Immunoblot analysis of Arg1 and tubulin levels in lysates from non‐infected (ni) and infected wild‐type (WT), or il10 −/− for 60 or 120 min.
pparg mRNA levels were assessed by qPCR in wild‐type (WT), il10 −/− non‐infected (ni) or infected with Kp52145 for 1, 3 or 5 h.
fizz1 mRNA levels were assessed by qPCR in wild‐type (WT), il10 −/− non‐infected (ni) or infected with Kp52145 for 1, 3 or 5 h.
Kp52145 adhesion to wild‐type (WT) and il10 −/− iBMDMs. Cells were infected with Kp52145 for 30 min, washed, cell lysed with saponin, and bacteria quantified after serial dilution followed by plating on LB agar plates.
Phagocytosis of Kp52145 by wild‐type (WT) and il10 −/− iBMDMs. Cells were infected for 30 min, wells were washed, and it was added medium containing gentamicin (100 μg/ml) to kill extracellular bacteria. After 30 min, cells were washed, cell lysed with saponin and bacteria quantified after serial dilution followed by plating on LB agar plates.
Kp52145 intracellular survival in wild‐type (W)T and il10 −/− 5 h after addition of gentamycin (30 min of contact). Results are expressed as % of survival (CFUs at 5 h versus 30 min in stat6 −/− cells normalised to the results obtained in wild‐type macrophages set to 100%).
Immunofluorescence confocal microscopy of the co‐localisation of Kp52145 harbouring pFPV25.1Cm, and cresyl violet dye in wild‐type (WT) and il10 −/− macrophages. The images were taken 90 min post infection. Images are representative of duplicate coverslips of three independent experiments.
Percentage of Kp52145 harbouring pFPV25.1Cm co‐localisation with cresyl violet over a time course in wild‐type (WT) and il10 −/− macrophages. Values are given as mean percentage of Kp52145 co‐localising with the marker ± SEM. The number of infected cells counted per time in three independent experiments are indicated in the figure.

Dot Plot analysis of the expression levels of genes related to fatty acid oxidation (FAO) and glycolysis from the scRNAseq data set of PBS‐infected IMs (control), and bystander and Kp52145‐associated IMs. Dot size reflects percentage of cells in a cluster expressing each gene; dot colour intensity reflects expression level as indicated on legend.
Extracellular acidification rate (ECAR, in mpH/min) of non‐infected (ni) and Kp52145‐infected iBMDMS (Kp52145) measured using Mito‐stress test kit and the Seahorse XF analyser. When indicated oligomycin (2.5 μM), FCCP (2 μM), antimycin and roteanone (0.5 μM) were added to the cells.
Oxygen consumption rates (OCR, in pMoles/min) of non‐infected (ni) and Kp52145‐infected iBMDMS (Kp52145) measured using Mito‐stress test kit and the Seahorse XF analyser. When indicated oligomycin (2.5 μM), FCCP (2 μM), antimycin and roteanone (0.5 μM) were added to the cells.
Basal respiration of non‐infected (ni) and Kp52145‐infected iBMDMs.
Maximal respiration of non‐infected (ni) and Kp52145‐infected iBMDMs.
Spare respiratory capacity of non‐infected (ni) and Kp52145‐infected iBMDMs.
ATP production by non‐infected (ni) and Kp52145‐infected iBMDMs.
Non mitochondrial O2 consumption by non‐infected (ni) and Kp52145‐infected iBMDMs.
Kp52145 intracellular survival in wild‐type iBMDMs 5 h after addition of gentamycin (30 min of contact). Results are expressed as % of survival (CFUs at 5 h versus 30 min in stat6 −/− cells normalised to the results obtained in wild‐type macrophages set to 100%). Cells were treated with DMSO vehicle, or 2‐deoxyglucose (2DG, 3 μM), oligomycin (3 μM), etomoxir (50 μM) 2 h before infection and maintained thought.
Immunofluorescence confocal microscopy of the co‐localisation of Kp52145 harbouring pFPV25.1Cm, and cresyl violet dye in wild‐type macrophages treated with DMSO vehicle solution (control) or 2DG. The images were taken 90 min post infection. Images are representative of duplicate coverslips of three independent experiments.
Percentage of Kp52145 harbouring pFPV25.1Cm co‐localisation with cresyl violet over a time course. Wild‐type iBMDMs treated with DMSO vehicle solution (control) or 2DG. were infected; coverslips were fixed and stained at the indicated times. Values are given as mean percentage of Kp52145 co‐localising with the marker ± SEM. The number of infected cells counted per time in three independent experiments are indicated in the figure.

Immunoblot analysis of phospho‐STAT6 (pSTAT6) and tubulin levels in lysates from wild‐type macrophages non‐infected (ni), or infected with Kp52145 or the LPS O‐polysaccharide mutant, strain 52145‐Δglf, for 60 or 120 min.
Percentage of wild‐type macrophages with and without associated Kp52145 or 52145‐∆glf positive for CD206 5 h post infection. Bacteria were tagged with mCherry.
Immunoblot analysis of phospho‐STAT6 (pSTAT6) and tubulin levels in lysates from wild‐type macrophages non‐infected (ni), or infected with Kp52145 or the CPS mutant, strain 52145‐Δwca K2 , for 60 or 120 min.
arg1 mRNA levels were assessed by qPCR in wild‐type macrophages non‐infected (ni) or infected Kp52145, the CPS mutant, strain 52145‐Δwca K2 , the complemented strain, 52145‐Δwca K2 /pGEMTman (Comp) for 1, 3 or 5 h.
Percentage of wild‐type macrophages with and without associated Kp52145, 52145‐Δwca K2 or the complemented strain positive for Arg1 5 h post infection. Bacteria were tagged with mCherry.
Percentage of wild‐type macrophages with and without associated Kp52145, 52145‐Δwca K2 or the complemented strain positive for CD206 5 h post infection. Bacteria were tagged with mCherry.
Percentage of wild‐type macrophages with and without associated Kp52145, 52145‐Δwca K2 or the complemented strain positive for MHCII 5 h post infection. Bacteria were tagged with mCherry.

arg1 mRNA levels were assessed by qPCR in hM‐CSF‐treated PBMCs from 6 donors non‐infected (ni) or infected Kp52145 for 1, 3 or 5 h.
il10 mRNA levels were assessed by qPCR in M‐CSF‐treated PBMCs from 6 donors non‐infected (ni) or infected Kp52145 for 1, 3 or 5 h.
chi3l mRNA levels were assessed by qPCR in hM‐CSF‐treated PBMCs from 6 donors non‐infected (ni) or infected Kp52145 for 1, 3 or 5 h.
ido mRNA levels were assessed by qPCR in hM‐CSF‐treated PBMCs from 6 donors non‐infected (ni) or infected Kp52145 for 1, 3 or 5 h.
Immunoblot analysis of phospho‐STAT6 (pSTAT6) and tubulin levels in lysates from PMA‐treated THP‐1 macrophages non‐infected (ni), or infected with Kp52145 for 60 or 120 min.
arg1 mRNA levels were assessed by qPCR in PMA‐treated THP‐1 macrophages non‐infected (ni) or infected Kp52145 for 1, 3 or 5 h and treated with the STAT6 inhibitor AS1517499 or DMSO vehicle control.
il10 mRNA levels were assessed by qPCR in PMA‐treated THP‐1 macrophages non‐infected (ni) or infected Kp52145 for 1, 3 or 5 h and treated with the STAT6 inhibitor AS1517499 or DMSO vehicle control.
nos2 mRNA levels were assessed by qPCR in PMA‐treated THP‐1 macrophages non‐infected (ni) or infected Kp52145 for 1, 3 or 5 h and treated with the STAT6 inhibitor AS1517499 or DMSO vehicle control.
isg56 mRNA levels were assessed by qPCR in PMA‐treated THP‐1 macrophages non‐infected (ni) or infected Kp52145 for 1, 3 or 5 h and treated with the STAT6 inhibitor AS1517499 or DMSO vehicle control.
ido mRNA levels were assessed by qPCR in PMA‐treated THP‐1 macrophages non‐infected (ni) or infected Kp52145 for 1, 3 or 5 h and treated with the STAT6 inhibitor AS1517499 or DMSO vehicle control.
arg1 mRNA levels were assessed by qPCR in PMA‐treated THP‐1 macrophages non‐infected (ni) or infected Kp52145 for 1, 3 or 5 h and treated with IFNAR1 blocking antibody or isotype control.
ido mRNA levels were assessed by qPCR in PMA‐treated THP‐1 macrophages non‐infected (ni) or infected Kp52145 for 1, 3 or 5 h and treated with IFNAR1 blocking antibody or isotype control.
arg1 mRNA levels were assessed by qPCR in PMA‐treated THP‐1 macrophages non‐infected (ni) or infected Kp52145 for 1, 3 or 5 h and treated with IL10 blocking antibody or isotype control.
ido mRNA levels were assessed by qPCR in PMA‐treated THP‐1 macrophages non‐infected (ni) or infected Kp52145 for 1, 3 or 5 h and treated with IL10 blocking antibody or isotype control.
Immunoblot analysis of phospho‐STAT6 (pSTAT6) and tubulin levels in lysates from PMA‐treated THP‐1 macrophages non‐infected (ni), or infected with Kp52145 or the CPS mutant, strain 52145‐Δwca K2 , for 60 or 120 min.
Percentage of PMA‐treated THP‐1 macrophages with and without associated Kp52145 or 52145‐Δwca K2 positive for Arg1 5 h post infection. Bacteria were tagged with mCherry.
Percentage of PMA‐treated THP‐1 macrophages with and without associated Kp52145 or 52145‐Δwca K2 positive for CD206 5 h post infection. Bacteria were tagged with mCherry.

pparg mRNA levels were assessed by qPCR in hM‐CSF‐treated PBMCs from 6 donors non‐infected (ni) or infected Kp52145 for 1, 3 or 5 h.
mrc1 mRNA levels were assessed by qPCR in hM‐CSF‐treated PBMCs from 6 donors non‐infected (ni) or infected Kp52145 for 1, 3 or 5 h.
nos2 mRNA levels were assessed by qPCR in hM‐CSF‐treated PBMCs from 6 donors non‐infected (ni) or infected Kp52145 for 1, 3 or 5 h.
isg56 mRNA levels were assessed by qPCR in hM‐CSF‐treated PBMCs from 6 donors non‐infected (ni) or infected Kp52145 for 1, 3 or 5 h.
il1rn mRNA levels were assessed by qPCR in hM‐CSF‐treated PBMCs from 6 donors non‐infected (ni) or infected Kp52145 for 1, 3 or 5 h.
References
Publication types
MeSH terms
Associated data
- Actions
Grants and funding
LinkOut - more resources
Full Text Sources
Molecular Biology Databases
Research Materials
Miscellaneous

