

Consumer mobility and expenditure during the COVID-19 containments: Evidence from French transaction data
- PMID: 36337763
- PMCID: PMC9617688
- DOI: 10.1016/j.euroecorev.2022.104326
Consumer mobility and expenditure during the COVID-19 containments: Evidence from French transaction data
Abstract
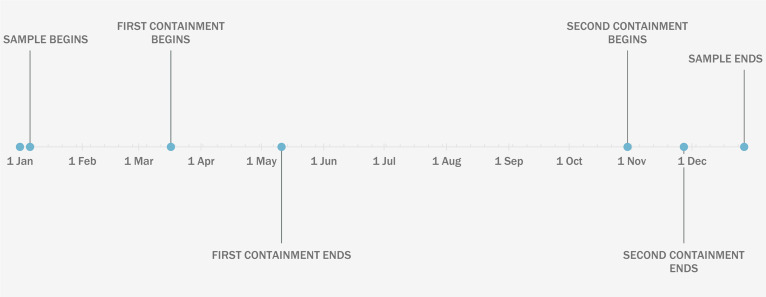
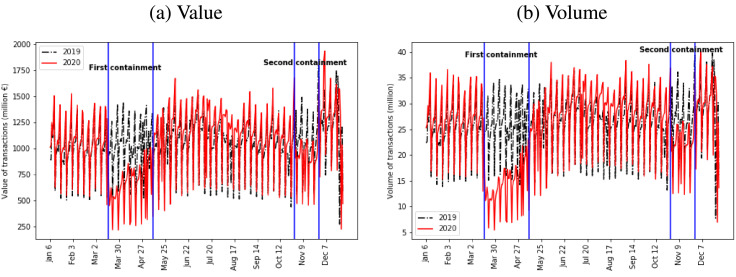
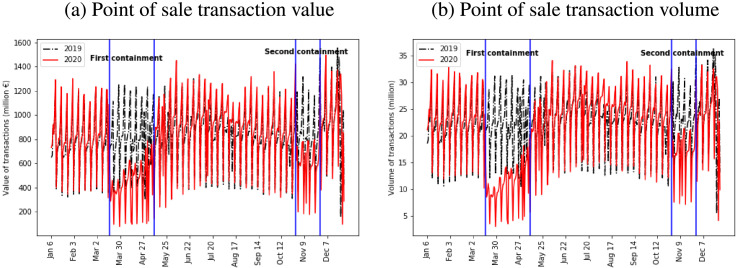
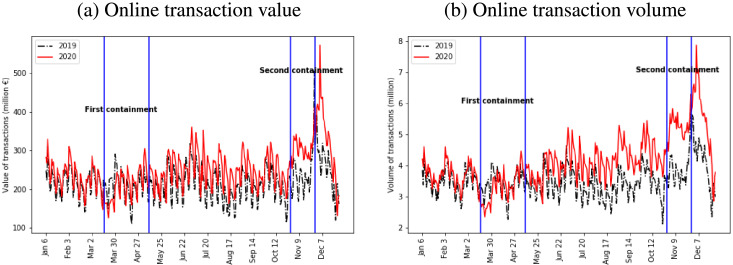
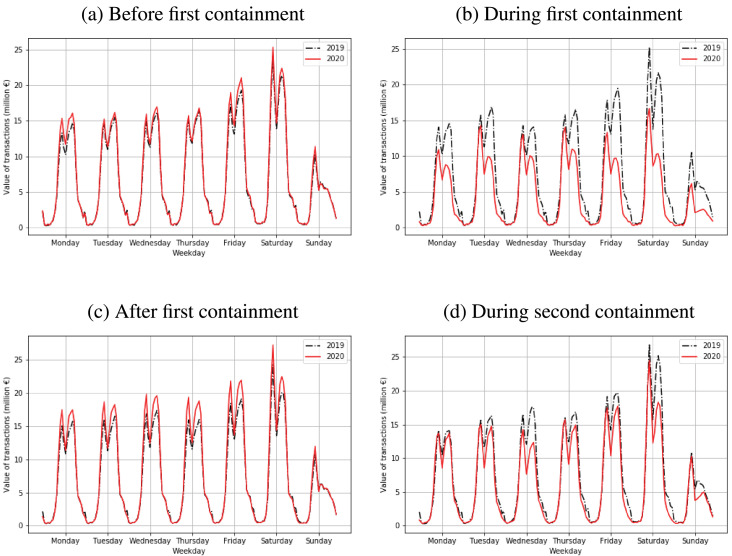
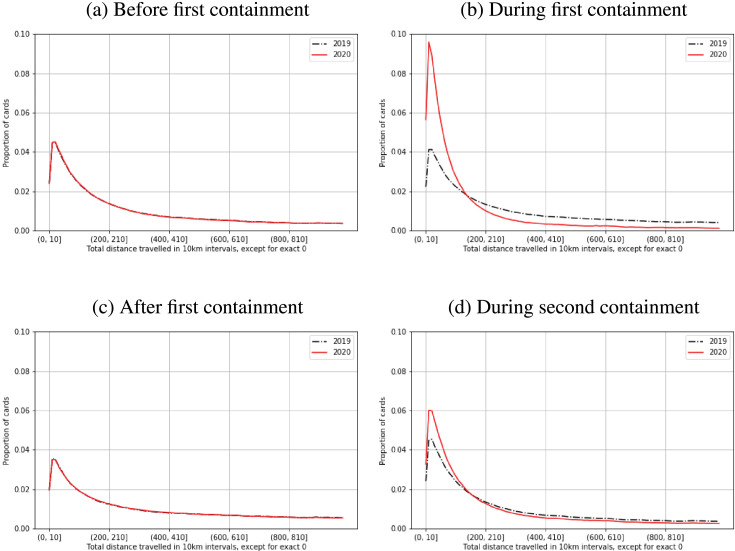
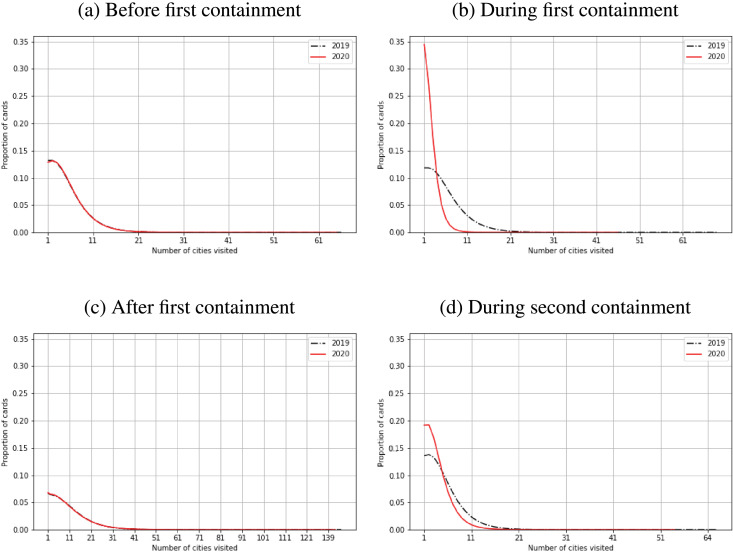
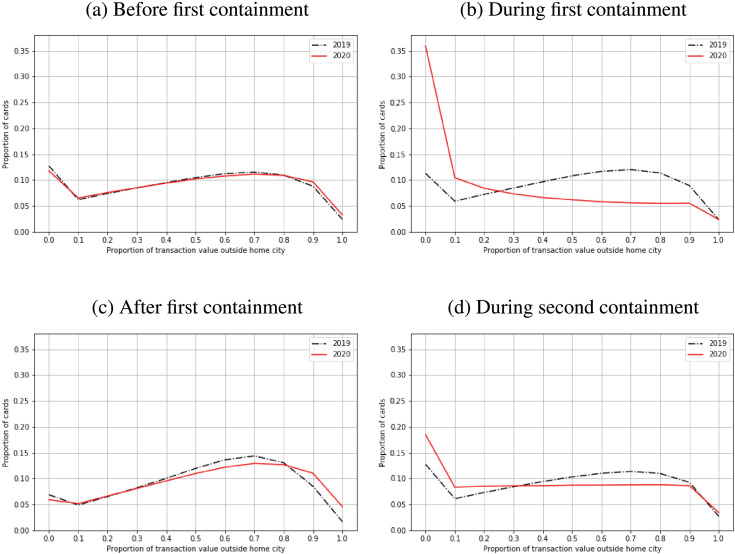
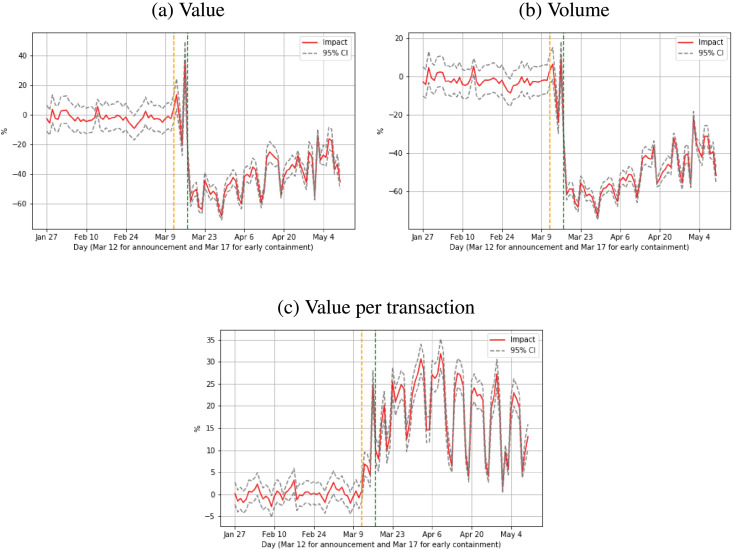
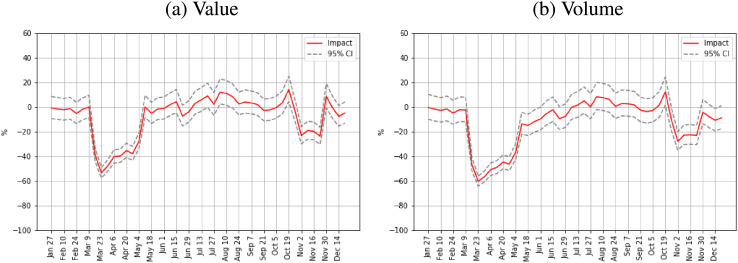
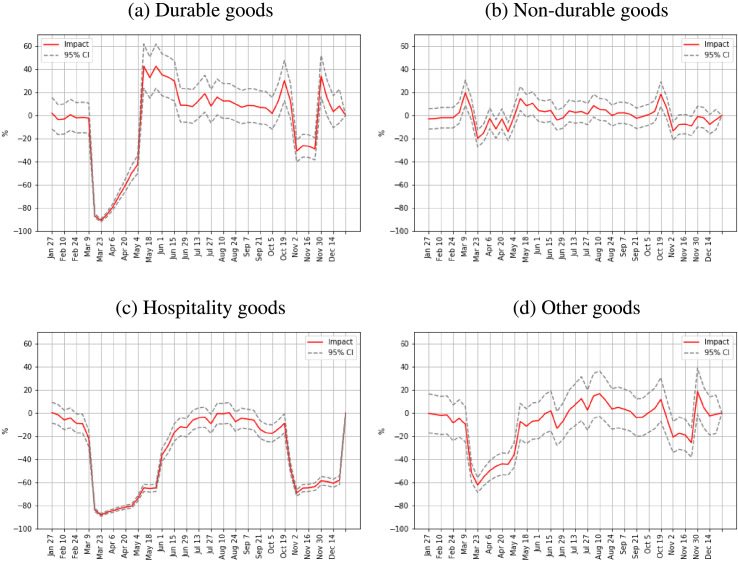
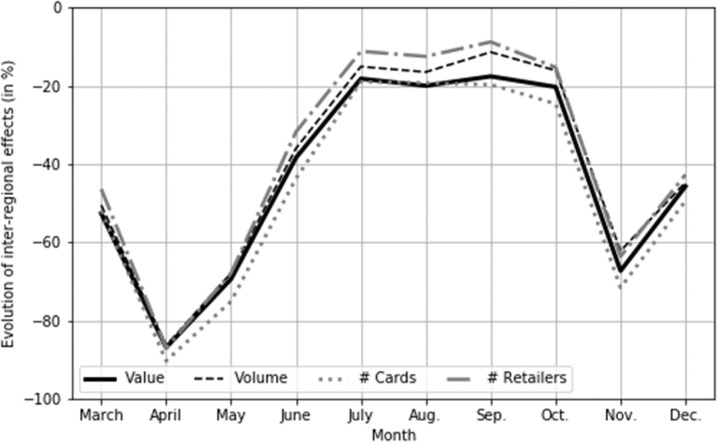
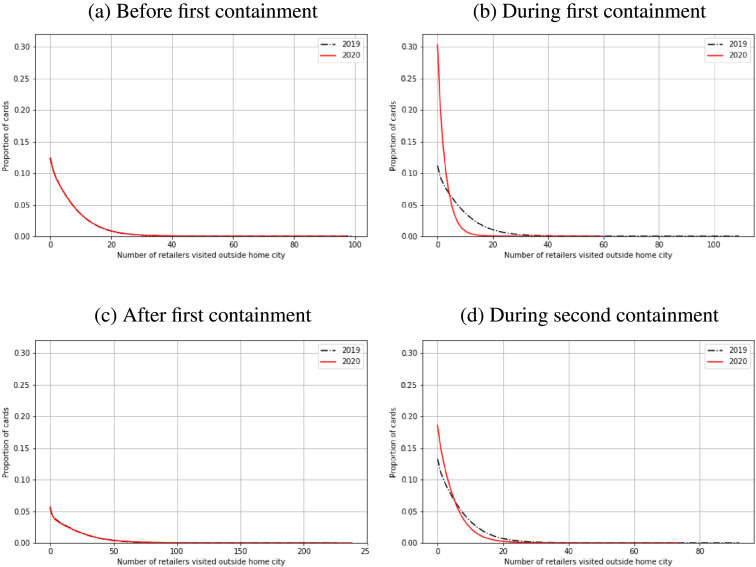
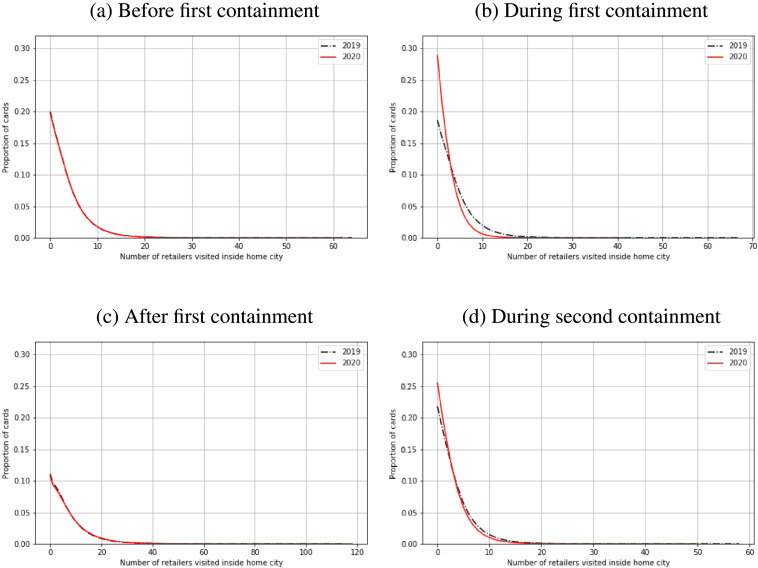
This paper investigates the effects of the pandemic containment periods in France on individuals' movements, expenditure and adaptation to the shock, using billions of French bank card transactions measured before and during the COVID-19 pandemic. We measure not only the effect on consumer expenditure, but also on quantities directly related to the containment restrictions, such as consumer mobility, number of retailers visited, and inter-regional purchases. The results show large effects on these measures of consumers' movements, as well as on both online and offline measures of expenditure, particularly in the first containment period. We also find evidence that consumers adjusted rapidly during the first containment period, mitigating the effects of mobility restrictions via an increasing shift toward online purchasing, and that the nature of the adaptation differed for different types of purchase.
Keywords: COVID-19; Consumer mobility; Consumption expenditure; Containment policy; Inter-regional trade; Transaction data.
© 2022 Elsevier B.V. All rights reserved.
Figures
References
-
- Aaronson Daniel, Sumit Agarwal, Eric French. The spending and debt response to minimum wage hikes. Amer. Econ. Rev. 2012;102(7):3111–3139. doi: 10.1257/aer.102.7.3111. URL http://www.aeaweb.org/articles?id=10.1257/aer.102.7.3111. - DOI
-
- Agarwal S., Jensen J.B., Monte Ferdinando. National Bureau of Economic Research; 2019. The Geography of Consumption: Working Paper 23616.
-
- Agarwal Sumit, Liu Chunlin, Souleles Nicholas S. The reaction of consumer spending and debt to tax rebates—Evidence from consumer credit data. J. Polit. Econ. 2007;115(6):986–1019. URL http://www.jstor.org/stable/10.1086/528721. - DOI
-
- Agarwal Sumit, Qian Wenlan. Consumption and debt response to unanticipated income shocks: Evidence from a natural experiment in Singapore. Amer. Econ. Rev. 2014;104(12):4205–4230. doi: 10.1257/aer.104.12.4205. - DOI
-
- Agarwal Sumit, Qian Wenlan, Yeung Bernard Y., Zou Xin. Mobile wallet and entrepreneurial growth. AEA Pap. Proc. 2019;109:48–53. doi: 10.1257/pandp.20191010. - DOI
LinkOut - more resources
Full Text Sources
