. 2022 Oct 17;25(11):105368.
doi: 10.1016/j.isci.2022.105368. eCollection 2022 Nov 18.

A binocular perception deficit characterizes prey pursuit in developing mice

Affiliations

A binocular perception deficit characterizes prey pursuit in developing mice

Kelsey Allen et al. iScience. .

Abstract

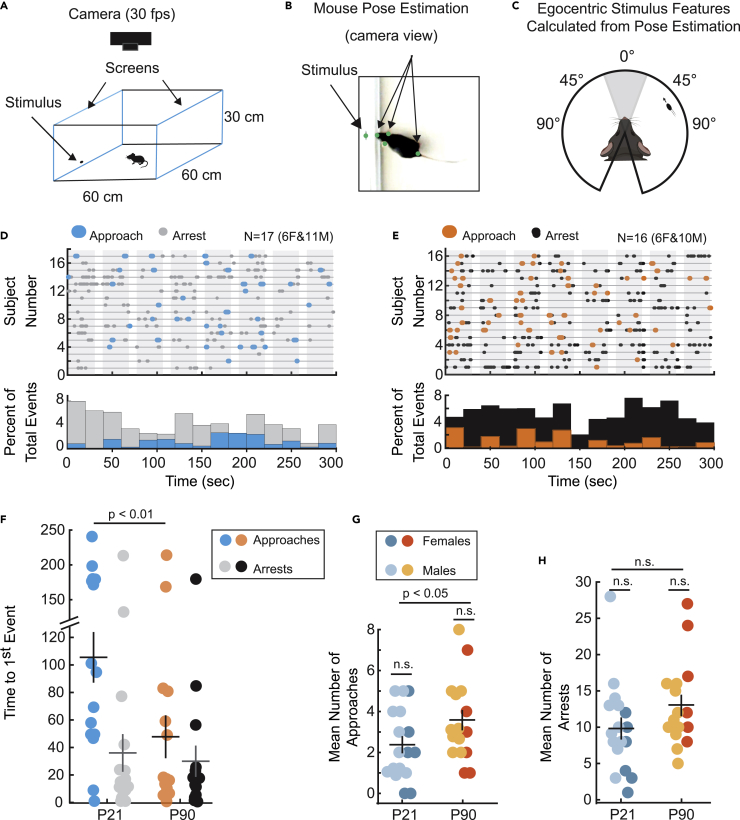
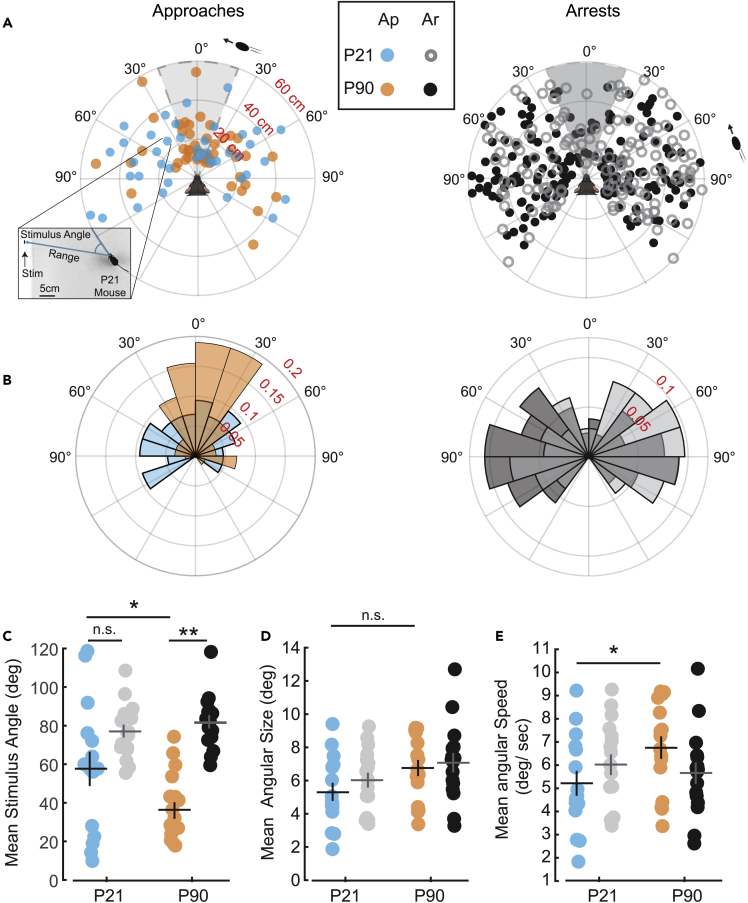
Integration of binocular information at the cellular level has long been studied in the mouse model to uncover the fundamental developmental mechanisms underlying mammalian vision. However, we lack an understanding of the corresponding ontogeny of visual behavior in mice that relies on binocular integration. To address this major outstanding question, we quantified the natural visually guided behavior of postnatal day 21 (P21) and adult mice using a live prey capture assay and a computerized-spontaneous perception of objects task (C-SPOT). We found a robust and specific binocular visual field processing deficit in P21 mice as compared to adults that corresponded to a selective increase in c-Fos expression in the anterior superior colliculus (SC) of the juveniles after C-SPOT. These data link a specific binocular perception deficit in developing mice to activity changes in the SC.

Keywords: Biological sciences; Neuroscience; Sensory neuroscience.


Conflict of interest statement

The authors declare no competing interests.

Figures

None
Graphical abstract
Figure 1
Figure 1
Analysis of natural prey capture behavior reveals a lack of binocular visual field bias to start approaches in P21 mice relative to adults (A) Normalized polar plot distributions of stimulus angles (angle between mouse bearing and position of cricket) where successful approaches in juveniles (left) versus adults (right) began. (B) Detection behavior as measured by time to start an approach by P21 mice, blue, versus P90 mice, orange. (C) Probability of cricket interception, an approach that ends in cricket contact. (D) Stimulus investigation-related behavior indicated by the duration of a contact. Welch’s t-test, N = 11 versus 10, P21 mice versus P90 mice, respectively, Error bars are +/− standard error of the mean.
Figure 2
Figure 2
C-SPOT reveals robust developmental differences in innate visual orienting behavior (A) Left, schematic of experimental arena. Blue outlines indicate location of computer monitors displaying stimuli and illuminating the environment. (B) Example frame from a recorded behavioral video overlaid with post estimates of relevant points. (C) Analysis of tracked positions in B, are used to generate estimates of egocentric visual features: relative stimulus size, speed, and position along the azimuth of the visual field (stimulus angle). (D and E) Ethograms of each subjects’ response (subject ID on y axis) over time in seconds revealing when during each stimulus “sweep” (30 s, shaded in gray) approaches (color) or arrests (gray or black) occurred from stimulus onset. Ethograms are aligned to the start of 1st stimulus presentation. Below, histograms showing the proportion of response type, either an approach (blue)or arrest (gray), that occurred during each 20 s bin of time. (F) Mean time to first orienting event of either approaches (colors) versus arrests (gray and black). (G) Mean number of approach starts and (H) Mean number of arrests. Significance determined using Welch’s t-test, N = 17 versus 16, P21 versus P90 mice, respectively. n.s. = not significant. Error bars are +/− standard error of the mean.
Figure 3
Figure 3
P21 mice show specific binocular visual field deficits at start of approach toward stimulus in the C-SPOT assay (A) Polar plot distribution of individual approach starts (Left) and arrests (Right) evoked by a virtual visual stimulus for P21 (blue) versus P90 (orange) mice. Plotted is range (cm) versus stimulus angle (degree). Inset shows a frame from a P21 behavior video where an approach started toward a stimulus from a stimulus angle of ∼35° from about 22cm away from the screen (represents blue point where call out to inset begins). (B) Normalized polar plots of approaches (Left) or arrests (Right) by age. Plotted is fraction of total events versus stimulus angle (degree). (C) Mean stimulus angle for each subject at approach starts (color) or arrests (black and gray). (D) Mean subjective size of stimulus (visual angle in degrees) when approaches (color) or arrests (black and gray) start. (E) Mean subjective speed of stimulus (degrees/sec) when approaches or arrests start. Significance determined using Welch’s t-test, with Benjamini-Hochberg procedure to correct for multiple comparisons, N = 17 versus 16, P21 versus P90 mice, respectively. n.s. = not significant, ∗ = p < 0.05, ∗∗ = p < 0.01. Error bars are +/− standard error of the mean.
Figure 4
Figure 4
c-Fos expression differences after C-SPOT in P21 versus P90 mice (A) Adaptation of visual field topography reflected in the right hemisphere of the superior colliculus of the mouse from a dorsal view, Dräger and Hubel, 1976. The cartoon is meant as general representation of visual space in the superficial SC that is observed during topographical imaging of mouse SC. We assayed for c-Fos expression differences after exposure to virtual visual stimuli that evoke approach and arrest behaviors from three key planes of coronal sections, −3.5 anterior-posterior (AP), −4.1 AP and −4.6 AP (black dashed lines spanning the SC). A = anterior, P = posterior, M = medial, L = lateral, T = temporal, N = nasal, Up = upper visual field displayed to the mouse’s left eye and Low = lower visual field. (B) Table summarizing the mean ratio of c-Fos expression (percent of cells positive for c-Fos) in mice exposed to visual stimuli in C-SPOT relative to those w/out visual stimulation in the same environment. Ratios are normalized by dividing each subject’s percent of c-Fos positive cells by the mean of the percent of c-Fos positive cells in an age-matched control group, e.g., a ratio of 2.92 means a mouse after C-SPOT had nearly 3 times as many c-Fos positive cells in a given area than their age-matched control group only exposed to the environment for the same amount of time. Significant differences are highlighted in colored and bolded entries, P21 significant differences (p < 0.05) = blue and P90 (p < 0.05) significant differences = orange, N = 10 and N = 11. S = superficial, I = intermediate and D = deep, M = medial and L = lateral. (C) Representative coronal sections of one hemisphere from each experimental group with quantified subregions highlighted. +vis = samples from mice with visual stimulation during C-SPOT, Control = mice in arena for 10 min only, no displayed stimuli. (D) Example of normalized population data obtained from the medial and lateral regions of the superior colliculus from −3.5 AP from P21 mice (blue) versus P90 mice (orange). ∗ = p < 0.05, Welch’s t-test, followed by Benjamini-Hochberg procedure, N = 10 and 11, P21 versus P90, respectively. Error bars are +/− standard error of the mean.

References

    1. Hensch T.K. Critical period regulation. Annu. Rev. Neurosci. 2004;27:549–579. - PubMed
    1. Cang J., Savier E., Barchini J., Liu X. Visual function, organization, and development of the mouse superior colliculus. Annu. Rev. Vis. Sci. 2018;4:239–262. - PubMed
    1. Leighton A.H., Lohmann C. The wiring of developing sensory circuits-from patterned spontaneous activity to synaptic plasticity mechanisms. Front. Neural Circ. 2016;10:71. - PMC - PubMed
    1. Hooks B.M., Chen C. Critical periods in the visual system: changing views for a model of experience-dependent plasticity. Neuron. 2007;56:312–326. - PubMed
    1. Tan L., Tring E., Ringach D.L., Zipursky S.L., Trachtenberg J.T. Vision changes the cellular composition of binocular circuitry during the critical period. Neuron. 2020;108:735–747.e6. - PMC - PubMed

LinkOut - more resources