. 2022 Oct 20;25(11):105395.
doi: 10.1016/j.isci.2022.105395. eCollection 2022 Nov 18.

Single-cell RNA sequencing reveals different signatures of mesenchymal stromal cell pluripotent-like and multipotent populations

Affiliations

Single-cell RNA sequencing reveals different signatures of mesenchymal stromal cell pluripotent-like and multipotent populations

Yo Oguma et al. iScience. .

Abstract

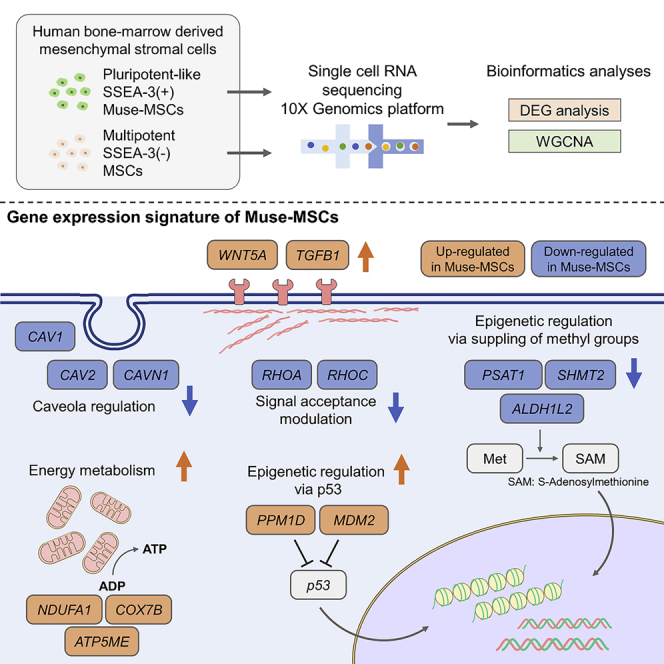
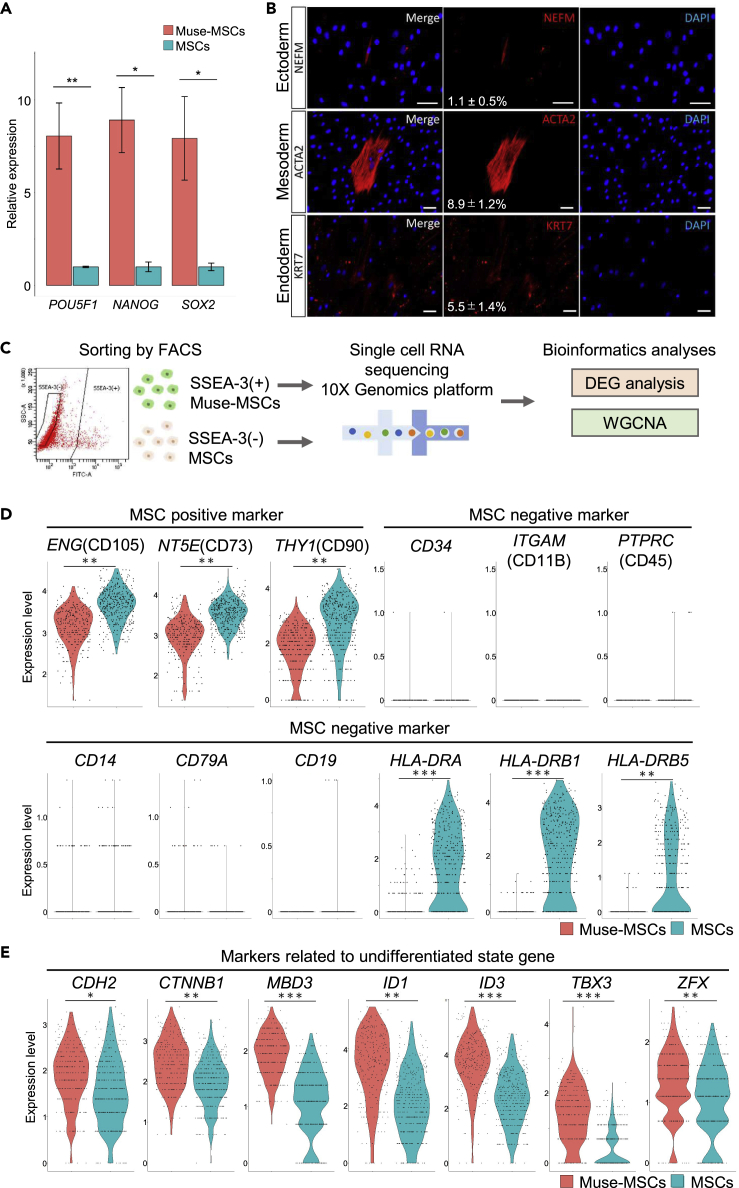
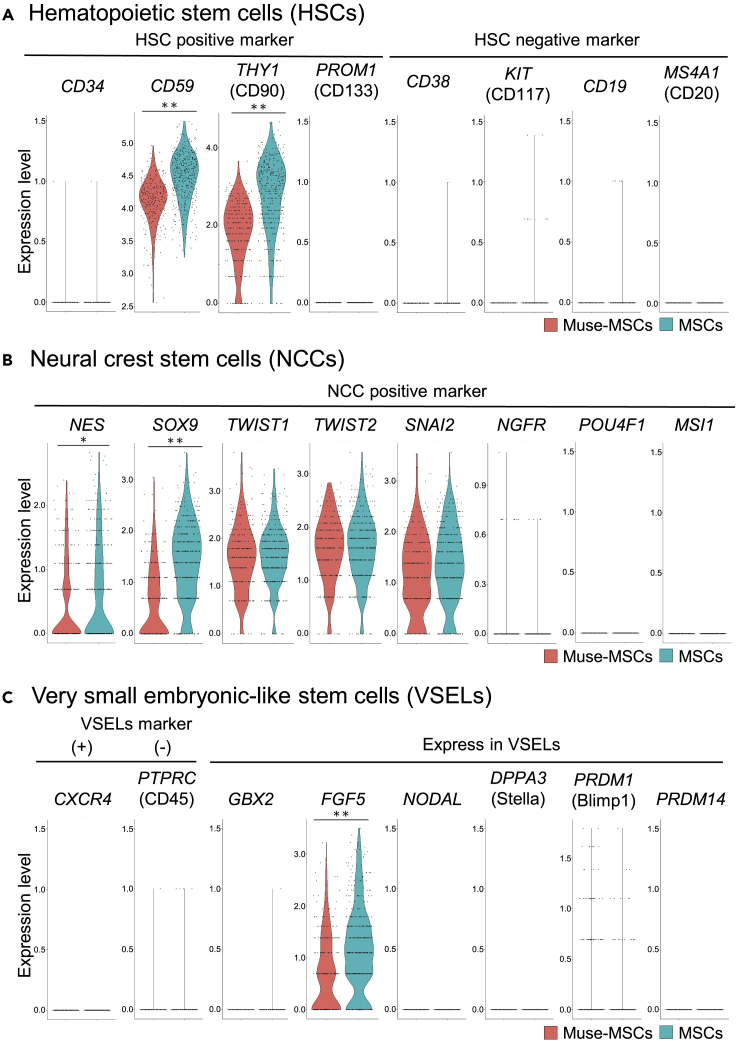
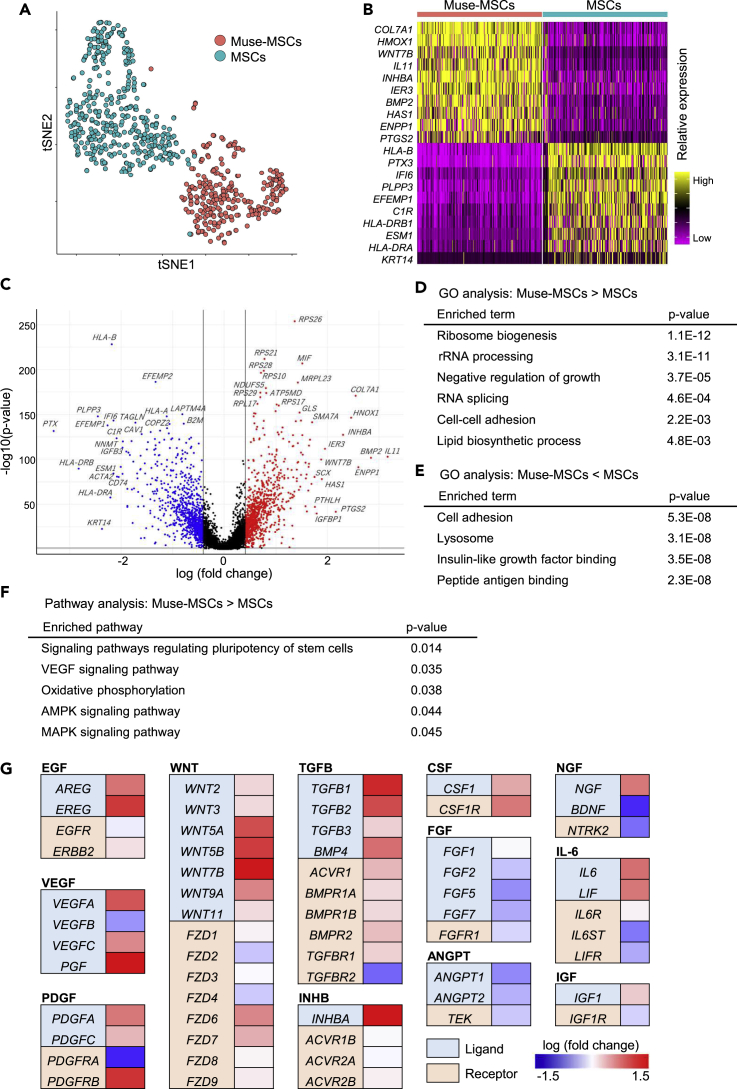
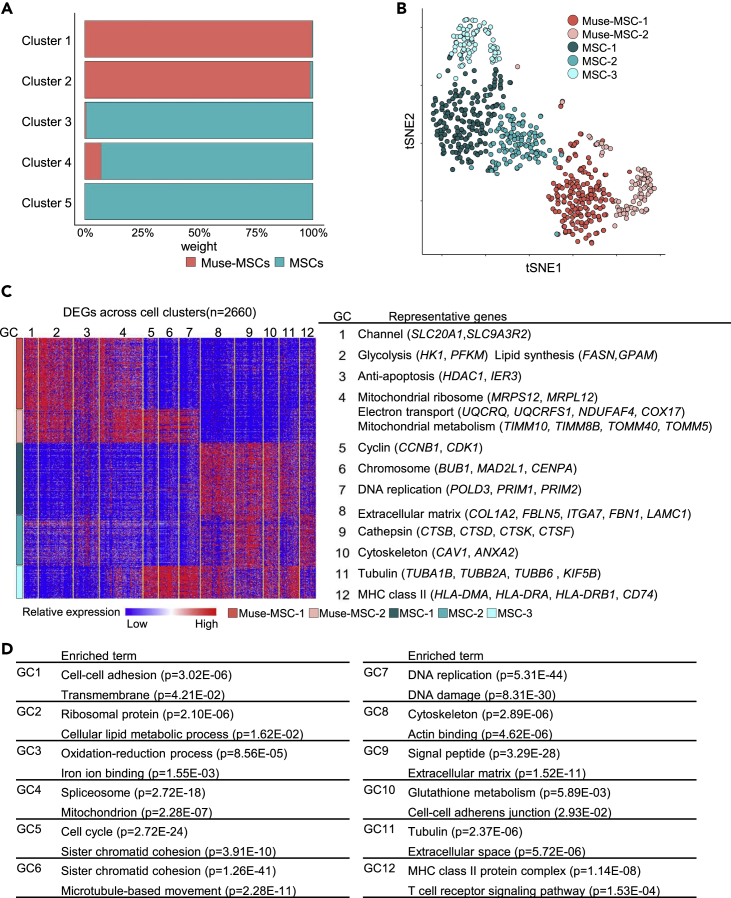
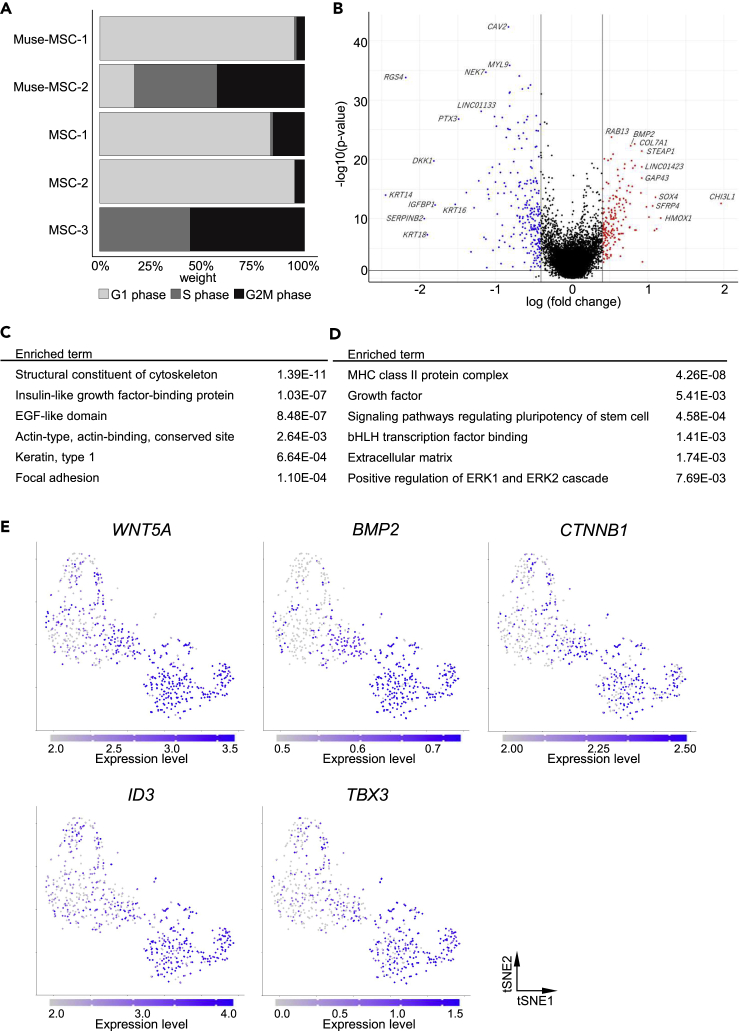
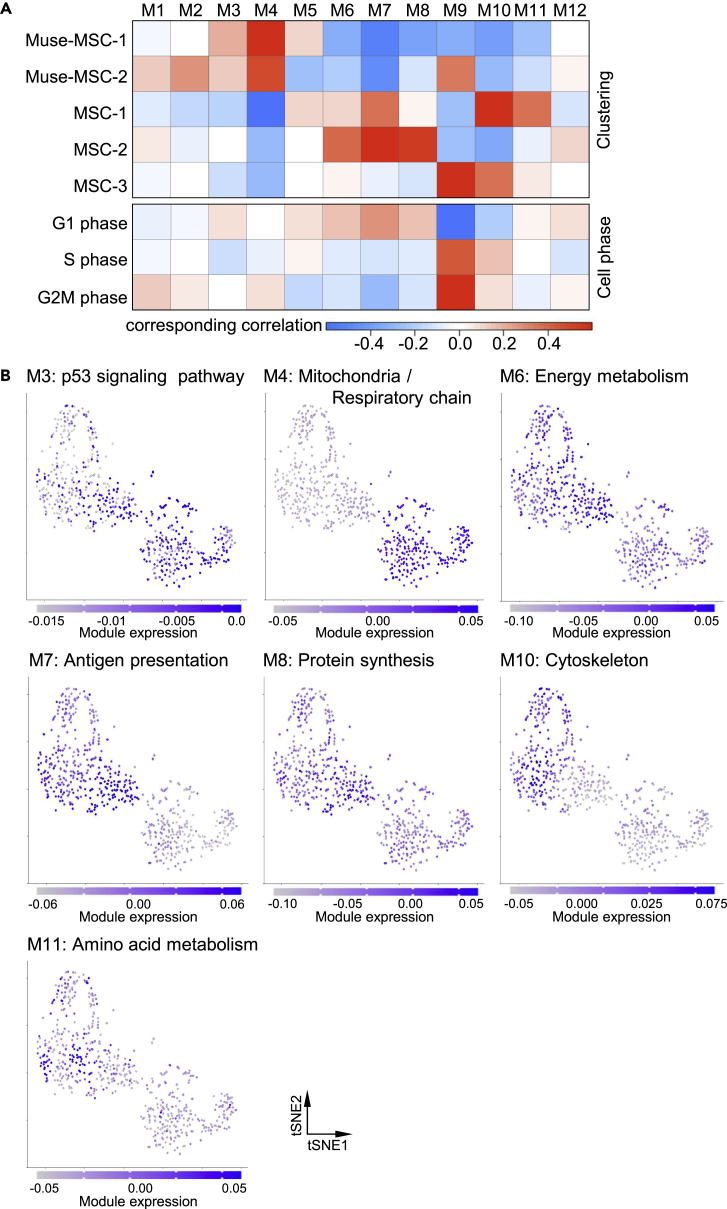
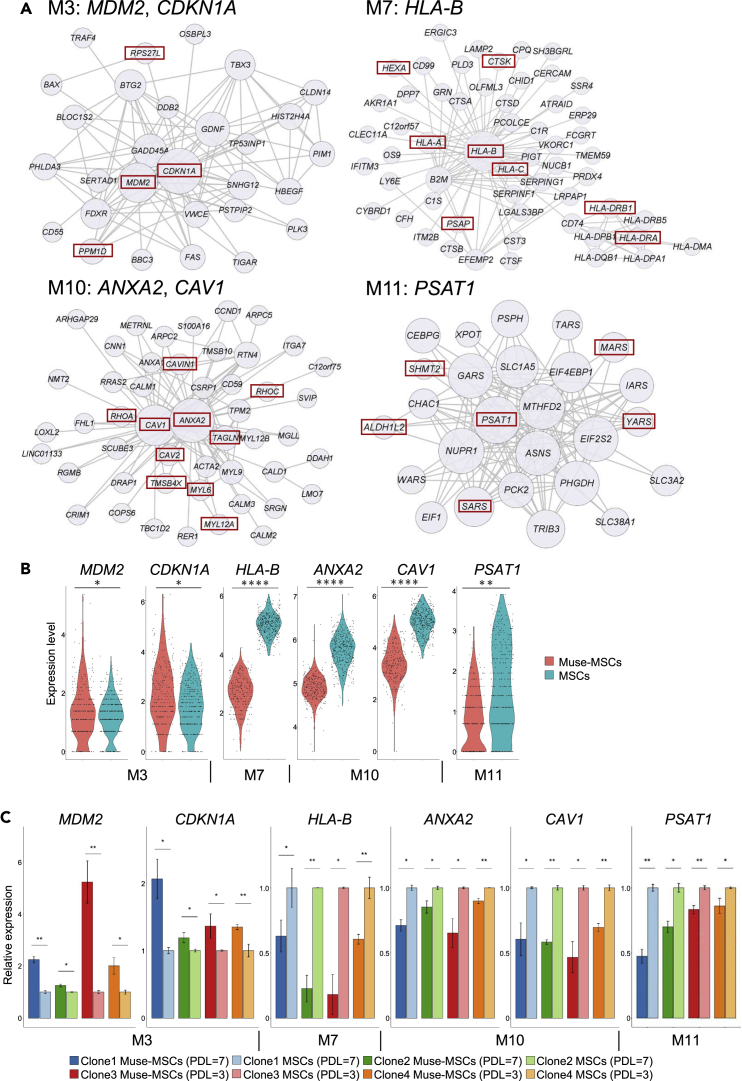
Somatic stem cells are advantageous research targets for understanding the properties required to maintain stemness. Human bone marrow-mesenchymal stromal cells (BM-MSCs) were separated into pluripotent-like SSEA-3(+) Muse cells (Muse-MSCs) and multipotent SSEA-3(-) MSCs (MSCs) and were subjected to single-cell RNA sequencing analysis. Compared with MSCs, Muse-MSCs exhibited higher expression levels of the p53 repressor MDM2; signal acceptance-related genes EGF, VEGF, PDGF, WNT, TGFB, INHB, and CSF; ribosomal protein; and glycolysis and oxidative phosphorylation. Conversely, MSCs had higher expression levels of FGF and ANGPT; Rho family and caveola-related genes; amino acid and cofactor metabolism; MHC class I/II, and lysosomal enzyme genes than Muse-MSCs. Unsupervised clustering further divided Muse-MSCs into two clusters stratified by the expression of cell cycle-related genes, and MSCs into three clusters stratified by the expression of cell cycle-, cytoskeleton-, and extracellular matrix-related genes. This study evaluating the differentiation ability of BM-MSC subpopulations provides intriguing insights for understanding stemness.

Keywords: Biological sciences; Cell biology; Omics; Stem cells research; Systems biology; Transcriptomics.


Conflict of interest statement

S. Wakao, Y. Kushida, Y. Kuroda, and M. Dezawa are parties to a co-development agreement with Life Science Institute, Inc. (LSII; Tokyo, Japan). S. Wakao and M. Dezawa have a patent for Muse cells, and the isolation method thereof is licensed to LSII.

Figures

None
Graphical abstract
Figure 1
Figure 1
Basic characteristics of Muse-MSCs and MSCs (A) Relative expression level of pluripotency markers in Muse-MSCs and MSCs isolated from BM-MSCs at PDL = 3 (clone1) that were normalized by β-actin (ACTB) in qPCR. Muse-MSCs expressed pluripotency markers at nearly 10 times higher levels than MSCs. Cells, as received from the supplier, were set as PDL = 0. Data are represented as mean ± SEM. Unpaired Student’s t-test, ∗p < 0.05; ∗∗p < 0.01. n = 3. (B) Immunocytochemistry for cells positive for neurofilament (NEFM) that belong to the ectodermal lineage, α-smooth muscle actin (ACTA2) that belong to the mesodermal lineage, and keratin-7 (KRT7) that belongs to the endodermal lineage. Cells were expanded from a single-Muse-MSC-derived cluster on a gelatin-coated dish (clone1; PDL = 7; bar = 50 μm). Percentage of positive cells for each marker (mean ± SEM) is shown in the middle column. Therefore, Muse-MSCs differentiated into triploblastic lineage cells at a single-cell level. n = 3. (C) Schematic images of single-cell analysis. SSEA-3(+)-Muse-MSCs and SSEA-3(−)-MSCs were isolated from BM-MSCs (PDL = 7) by FACS, single-cell RNA sequencing was conducted using the 10x Genomics platform, and the data were analyzed and visualized by bioinformatics analyses such as DEG analysis and WGCNA. (D) Expression of MSC-positive and -negative markers in Muse-MSCs and MSCs. Muse-MSCs and MSCs expressed representative MSC markers such as ENG (CD105), NT5E (CD73), and THY1 (CD90), while expression of MSC-negative markers such as CD34, ITGAM (CD11B), PTPRC (CD45), CD14, CD79A, and CD19 was under the detection limit. Other MSC-negative markers, HLA-DRA, HLA-DRB1, and HLA-DRB5 were detected in MSCs. MAST algorithm, ∗p < 0.05; ∗∗p < 1.0 × 10−10; ∗∗∗p < 1.0 × 10−50; ∗∗∗∗p < 1.0 × 10−100. Muse-MSCs (n = 270), MSCs (n = 381). (E) Expression of markers related to the undifferentiated state in Muse-MSCs and MSCs. Muse-MSCs expressed those markers at significantly higher levels than MSCs. MAST algorithm, ∗p < 0.05; ∗∗p < 1.0 × 10−10; ∗∗∗p < 1.0 × 10−50; ∗∗∗∗p < 1.0 × 10−100. Muse-MSCs (n = 270), MSCs (n = 381).
Figure 2
Figure 2
HSC-, NCC-, and VSEL-marker expression in Muse-MSCs and MSCs (A–C) Expression of genes known to be positive and negative for HSCs (A), NCCs (B), and VSELs (C) in Muse-MSCs and MSCs in scRNA-seq. With regard to HSC markers (A), neither Muse-MSCs nor MSCs expressed HSC-positive markers CD34 and PROM1, or negative markers CD38, KIT, CD19, and MS4A1, while CD59 and THY1, known to be positive in HSCs, were detected at higher levels in MSCs than in Muse-MSCs. Among markers that are positive for NCCs (B), NGFR, POU4F1, and MSI1 were under the detection limit in both cell types, while NES, SOX9, TWIST1/2, and SNAI2 were expressed at either similar levels in both cell types (TWIST1/2, SNAI2) or at a higher level in MSCs than in Muse-MSCs (NES, SOX9). As for VSELs (C), PTPRC, which is negative in VSELs, and CXCR4, GBX2, NODAL, DPPA3, PRDM1, and PRDM14, which are positive in VSELs, were not expressed in either cell type. FGF5, positive in VSELs, was detected at a higher level in MSCs than in Muse-MSCs. MAST algorithm, ∗p < 0.05; ∗∗p < 1.0 × 10⁻¹⁰; ∗∗∗p < 1.0 × 10−50; ∗∗∗∗p < 1.0 × 10−100. Muse-MSCs (n = 270), MSCs (n = 381).
Figure 3
Figure 3
DEG and pathway analyses (A) Muse-MSCs (n = 270) and MSCs (n = 381). plot as distinct clusters on a t-SNE plot, suggesting that they have different gene expression signatures. (B) Heatmap of the top 10 DE-Gs. Top 10 DEG were specific for Muse-MSCs and MSCs, respectively. (C) Volcano plot displaying gene expression levels in Muse-MSCs compared with MSCs. DE-Gs were defined as those with a fold-change >1.5 times or <0.67 times in Muse-MSCs compared with MSCs, with p < 0.05. Upregulated genes are shown in red, downregulated genes are shown in blue. The black lines show the boundary for the identification of up- or downregulated-genes based on the p value and fold-change. Gene expression levels differed significantly between Muse-MSCs and MSCs. DEG analysis revealed the upregulation of 1077 genes and the downregulation of 912 genes in Muse-MSCs compared with MSCs. Statistical values were calculated by the MAST algorithm. (D and E) GO analysis; upregulated (D) and downregulated (E) genes in Muse-MSCs are listed. GO analysis revealed that upregulated or downregulated genes were related to specific functions. P-value was calculated by Fisher exact test. (F) Pathway analysis of upregulated genes in Muse-MSCs suggested activated pathways in Muse-MSCs. P-value was calculated by Fisher exact test. (G) Gene expression level of ligands and receptors included in upregulated pathways in Muse-MSCs. The left column indicates protein type (ligand or receptor) encoded by each gene. Right column indicates fold-change in the gene expression level in Muse-MSCs compared with that in MSCs. Genes related to EGF-, VEGF-, PDGF-, WNT-, TGFB-, INHB-, and CSF-signaling pathways were more highly expressed in Muse-MSCs than in MSCs.
Figure 4
Figure 4
Evaluation of subpopulations by unsupervised clustering (A) Percentage of Muse-MSCs and MSCs in each cluster. Each cluster consisted primarily of either Muse-MSCs or MSCs, except cluster 4. (B) t-SNE plot of Muse-MSCs (n = 270) and MSCs (n = 381). Clusters were named according to the major cell type: Cluster 1 as Muse-MSC-1, cluster 2 as Muse-MSC-2, cluster 3 as MSC-1, cluster 4 as MSC-2, and cluster 5 as MSC-3′. Muse-MSCs were segregated into two clusters and MSCs were segregated into three clusters. (C) Heatmap shows the expression level of DE-Gs across cell clusters. Hierarchical clustering divided DE-Gs into 12 gene clusters (GC). Representative genes in each GC are listed. (D) Each GC included characteristic GO terms in each GC. P-value was calculated by Fisher exact test.
Figure 5
Figure 5
Characterization of MSC subpopulations by DEG analysis (A) Percentage of estimated cell cycle phase in each cluster. Muse-MSC-2 and MSC-3 mainly comprised cells in the S phase and G2M phase. (B) Volcano plot displaying differences in gene expression between MSC-1 and MSC-2 clusters. Genes shown in red were upregulated in the MSC-2 cluster, and those shown in blue were downregulated in the MSC-2 cluster. DEG analysis found that 186 genes were expressed at higher levels, and 247 genes were expressed at lower levels in the MSC-2 cluster than in the MSC-1 cluster. Statistical values were calculated by the MAST algorithm. (C and D) GO analysis of upregulated genes in the MSC-1 cluster (C) and of upregulated genes in the MSC-2 cluster (D). Each cluster expressed characteristic genes associated with specific functions. P-value was calculated by Fisher exact test. (E) The gene expression levels of genes related to pluripotency regulatory pathways were visualized by color intensity on t-SNE plots.
Figure 6
Figure 6
Detection of modules that contribute to Muse-MSCs (A) The Pearson correlation matrix revealed a correlation between modules and cell traits. The corresponding correlations between module expression and cell traits are shown according to the legend. Module (M) 3 and M4 showed a significant positive correlation with the trait of "Muse-MSC-1 and -2." On the other hand, M6, M7, M8, M10, and M11 showed a significant negative correlation with the trait of "Muse-MSC-1 and -2.” M6 and M7 positively correlated with the trait of "MSC-1 and -2," M10 with "MSC-1 and -3," M8 with "MSC-2," and M11 with "MSC-1." We further analyzed M3, M4, M6, M7, M8, M10, and M11 as modules that may determine the properties of Muse-MSCs. (B) The expression levels of each module were visualized by color intensity on t-SNE plots. Each cluster showed high expression of modules with significant positive correlations.
Figure 7
Figure 7
Hub gene network analysis (A) Hub gene networks of module (M) 3, 7, 10, and 11. Node size reflects the degree of connection with the other nodes. Hub genes indicated above networks are in the center of the gene network and highly correlated with other genes in the same module. Each network includes genes (red rectangles) with the same function. (B) Expression levels of hub genes MDM2 and CDKN1A from M3, HLA-B from M7, ANXA2 and CAV1 from M10, and PSAT1 from M11, in Muse-MSCs and MSCs. Muse-MSCs expressed hub genes at significantly higher (MDM2 and CDKN1A) or lower levels (HLA-B, ANXA2, CAV1, and PSAT1) than MSCs. MAST algorithm, ∗p < 0.05; ∗∗p < 1.0 × 10⁻¹⁰; ∗∗∗p < 1.0 × 10−50; ∗∗∗∗p < 1.0 × 10−100. Muse-MSCs (n = 270), MSCs (n = 381). (C) Relative expression level of hub genes in M3, 7, 10, and 11 in Muse-MSCs and MSCs collected from BM-MSCs from the four clones; clones 1 and 2 at PDL = 7; clones 3 and 4 at PDL = 3. Expression levels were normalized by β-actin (ACTB) and compared with those of each MSC clone. Muse-MSCs from the 4 clones commonly expressed MDM2 (M3) and CDKN1A (M3) at significantly higher levels than MSCs, and commonly expressed HLA-B (M7), ANXA2 (M10), CAV1 (M10), and PSAT1 (M11) at significantly lower levels than MSCs. Therefore, differences in gene expression between Muse-MSCs and MSCs in the scRNAseq analysis were reproduced by different donor-derived BM-MSCs. Data are represented as mean ± SEM. Unpaired Student’s t-test, ∗p < 0.05; ∗∗p < 0.01. n = 3.

Similar articles

Cited by

References

    1. Abe T., Aburakawa D., Niizuma K., Iwabuchi N., Kajitani T., Wakao S., Kushida Y., Dezawa M., Borlongan C.V., Tominaga T. Intravenously transplanted human multilineage-differentiating stress-enduring cells afford brain repair in a mouse lacunar stroke model. Stroke. 2020;51:601–611. doi: 10.1161/STROKEAHA.119.026589. - DOI - PubMed
    1. Acar M.B., Aprile D., Ayaz-Guner S., Guner H., Tez C., Di Bernardo G., Peluso G., Ozcan S., Galderisi U. Why do muse stem cells present an enduring stress capacity? Hints from a comparative proteome analysis. Int. J. Mol. Sci. 2021;22 doi: 10.3390/ijms22042064. - DOI - PMC - PubMed
    1. Alessio N., Ozcan S., Tatsumi K., Murat A., Peluso G., Dezawa M., Galderisi U. The secretome of MUSE cells contains factors that may play a role in regulation of stemness, apoptosis and immunomodulation. Cell Cycle. 2017;16:33–44. doi: 10.1080/15384101.2016.1211215. - DOI - PMC - PubMed
    1. Amin M., Kushida Y., Wakao S., Kitada M., Tatsumi K., Dezawa M. Cardiotrophic growth factor-driven induction of human muse cells into cardiomyocyte-like phenotype. Cell Transplant. 2018;27:285–298. doi: 10.1177/0963689717721514. - DOI - PMC - PubMed
    1. Ankrum J.A., Ong J.F., Karp J.M. Mesenchymal stem cells: immune evasive, not immune privileged. Nat. Biotechnol. 2014;32:252–260. doi: 10.1038/nbt.2816. - DOI - PMC - PubMed