. 2022 Oct 26:2022:2427987.
doi: 10.1155/2022/2427987. eCollection 2022.

m6A-Related Genes Contribute to Poor Prognosis of Hepatocellular Carcinoma

Affiliations

m6A-Related Genes Contribute to Poor Prognosis of Hepatocellular Carcinoma

Yan Zou et al. Comput Math Methods Med. .

Abstract

Background: Hepatocellular carcinoma (HCC) is one of the most common and lethal digestive system cancers worldwide. N6-methyladenosine (m6A) modification plays an essential role in diverse critical biological processes and may participate in the development and progression of HCC.

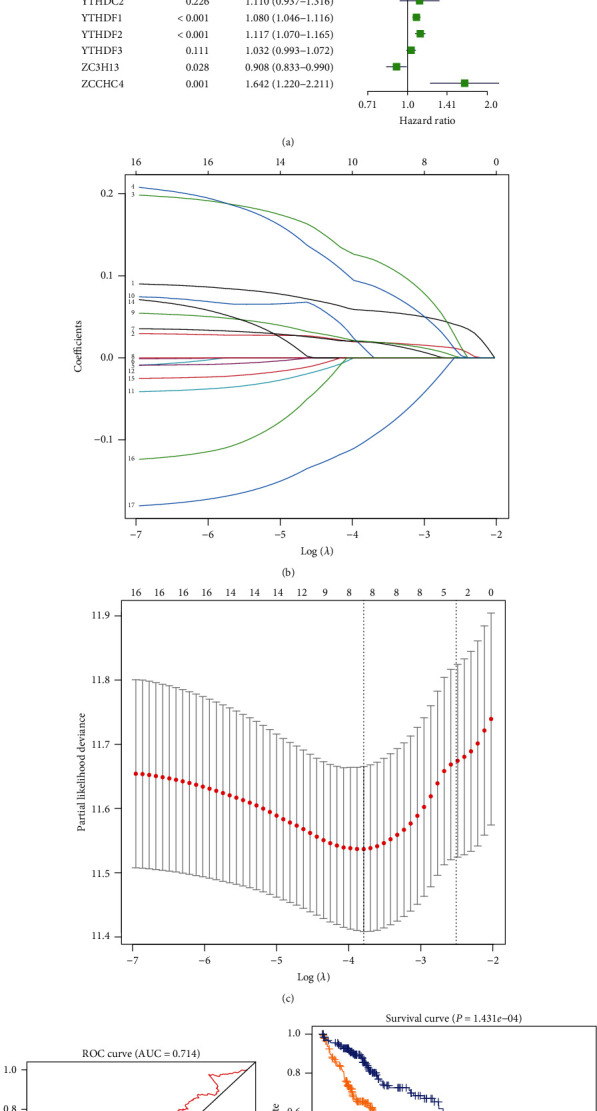
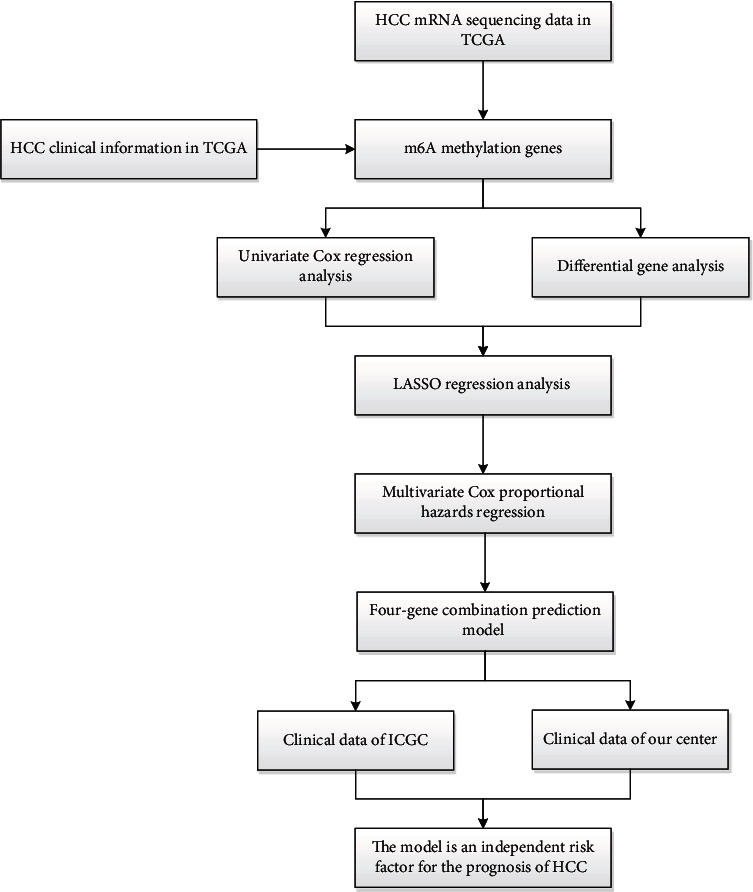
Methods: We downloaded transcriptome data and clinical data from TCGA as the training set. COX and LASSO screened prognostic m6A genes. ROC and Kaplan-Meier curve analysis evaluated the effectiveness of the model. ICGC and our center data were used as verification sets.

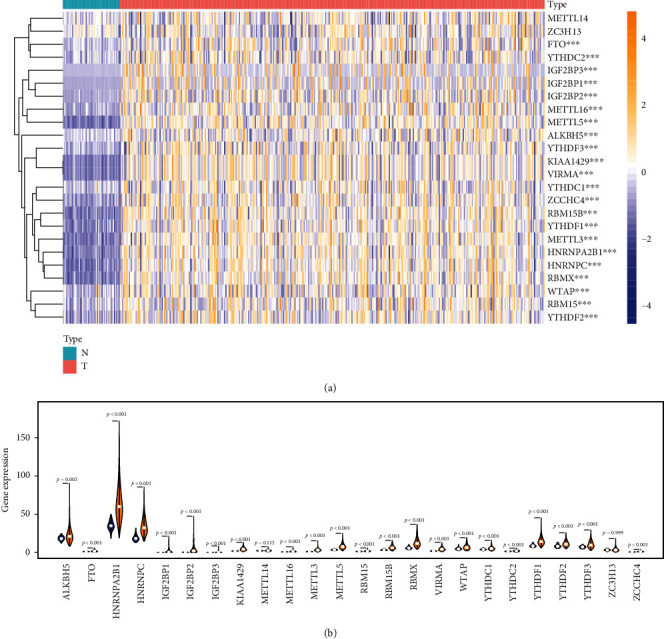
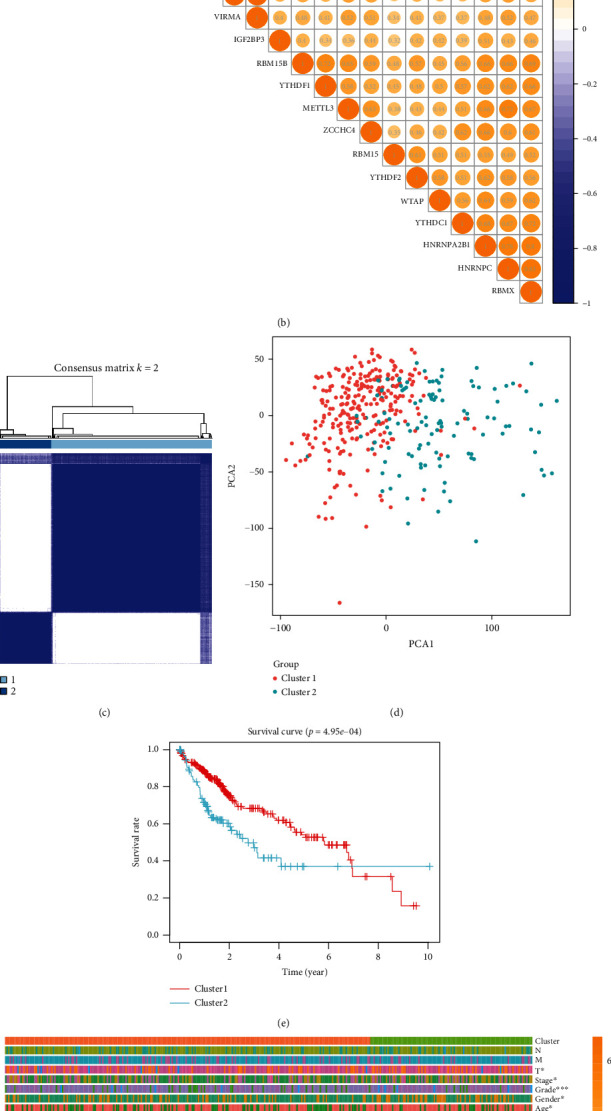
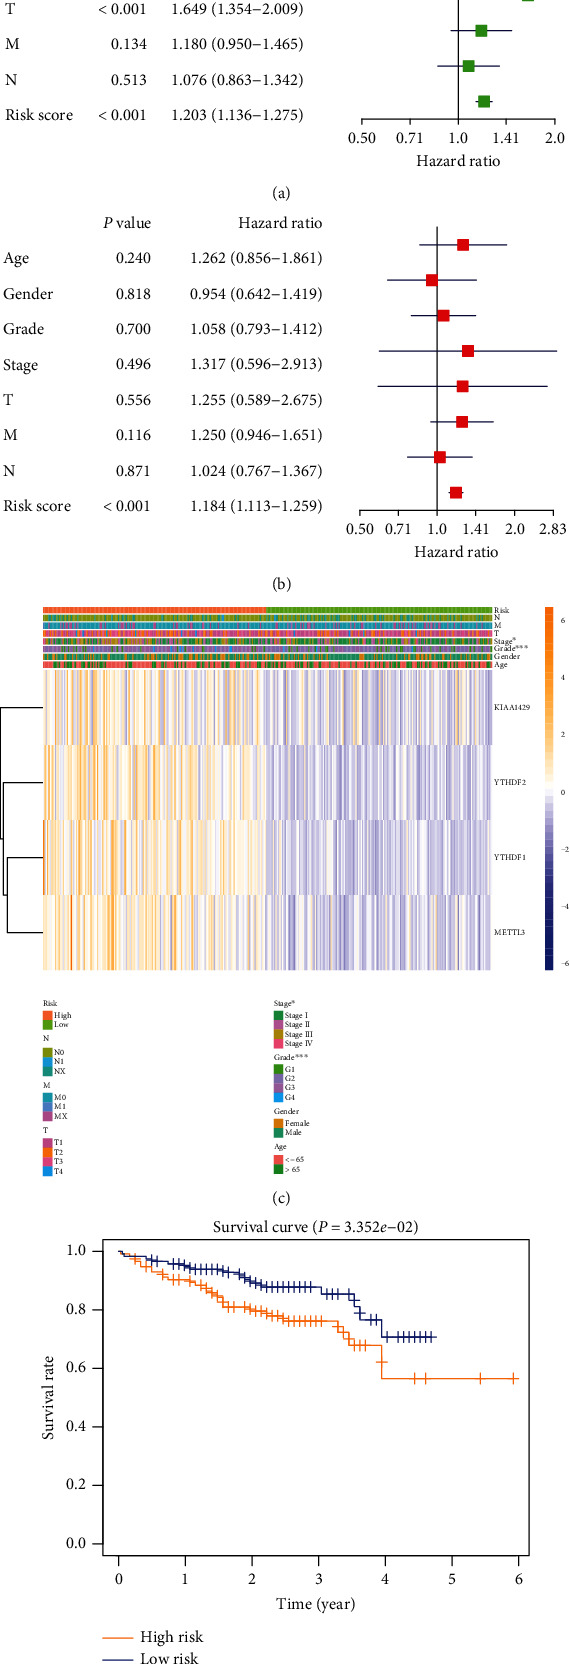
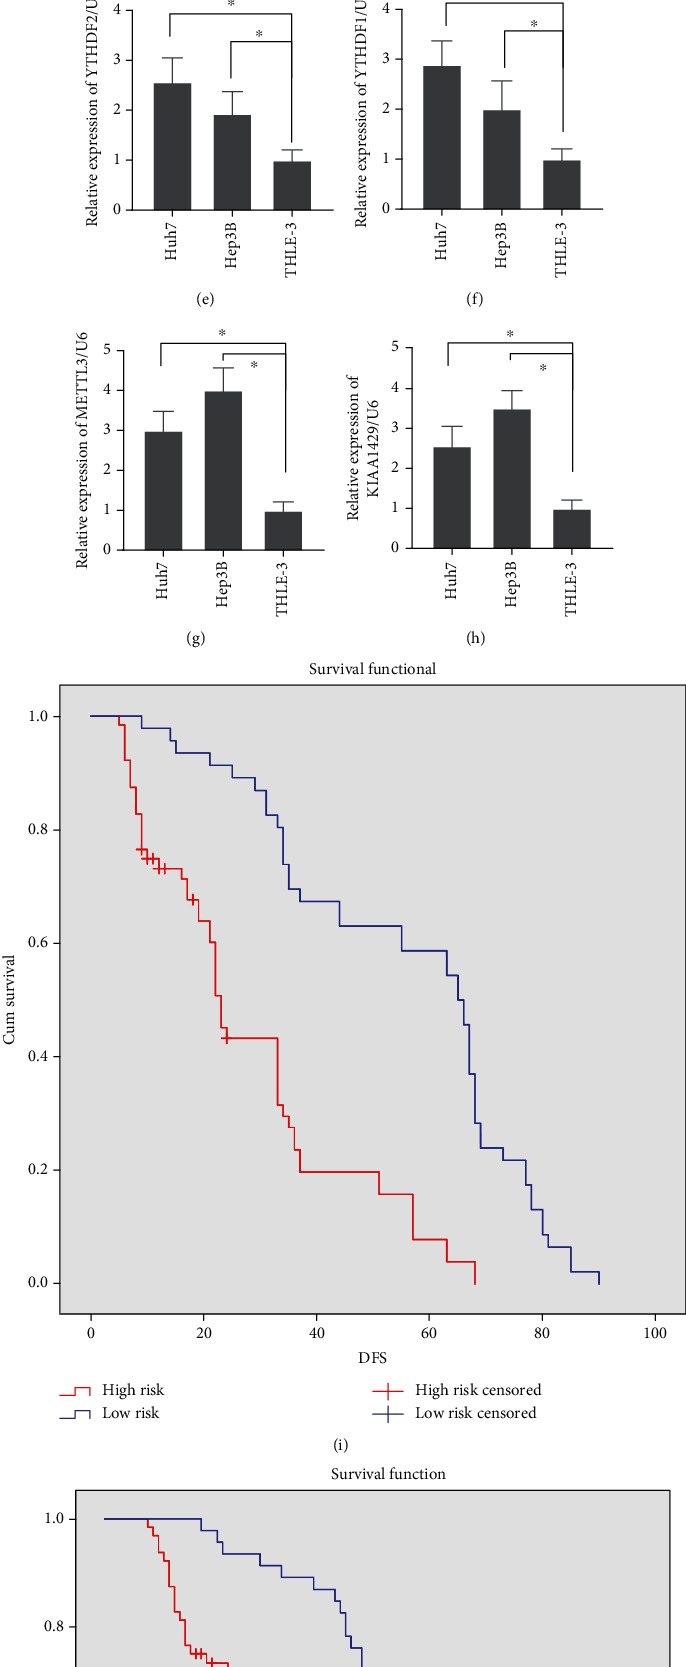
Results: We include the "writer (METTL3, METTL14, WTAP, KIAA1429, RBM15, ZC3H13)," the "reader (YTHDC1, YTHDC2, YTHDF1, YTHDF2, HNRNPC)," and the "eraser (FTO, ALKBH5)" in the study. We obtained YTHDF2, YTHDF1, METTL3, and KIAA1429 through differential analysis, survival analysis, and LASSO regression analysis. The prediction model was established based on the expression of these 4 molecules. HCC patients were divided into "high-risk" and "low-risk" groups to compare survival differences. The model suggested a poor prognosis in the validation sets.

Conclusion: The four-m6A-related-gene combination model was an independent prognostic factor of HCC and could improve the prediction of the prognosis of HCC.


Conflict of interest statement

The authors declare that they have no conflict of interest.

Figures

Figure 1
Figure 1
The expression of m6A methylation genes in HCC. (a) Heat map showed the expression of the m6A methylation genes in 374 HCC and 50 adjacent tissues. (b) Vioplot visualized the expression of 13 m6A methylation genes in different tissue samples in HCC and adjacent tissues.
Figure 2
Figure 2
Identification of coexpressed gene clusters of m6A methylation genes. (a) m6A methylation gene interaction network constructed by STRING database. (b) Spearman analysis of the correlation of m6A methylation genes in HCC. (c) Methylated genes could be clustered into two consistency matrices. (d) Principal component analysis showed that these two clusters could distinguish HCC patients well. (e) The Kaplan-Meier curve was used to analyze the overall survival of the two subgroups. (f) The heat map showed the correlation between the two subgroups and clinicopathological data.
Figure 3
Figure 3
Risk signature with m6A methylation genes. (a) Univariate Cox regression calculated the hazard ratios (HR) and 95% confidence intervals (CI) of m6A methylation genes. (b) Incorporate 8 differential genes with prognostic significance into LASSO. (c) L1-penalty of LASSO-COX regression. The dotted vertical lines at optimal log (Lambda) value: 4. (d) ROC assesses predictive model validity. (e) Patients were divided into high-risk and low-risk groups based on risk scores, and survival curves were plotted.
Figure 4
Figure 4
Relationship between risk prediction model and clinicopathological features and prognostic value. (a) Univariate Cox regression analysis showed that risk score, T stage, and TNM stage were poor prognostic factors. (b) Multivariate Cox regression analysis exhibited that risk score was an independent risk factor for the prognosis of HCC. (c) Heat map showed the expression of two m6A RNA methylation regulators in GC. The distribution of clinicopathological features was compared between high-risk and low-risk groups. (d) Based on the survival data of HCC in ICGC, the high-risk group suggested a poor prognosis.
Figure 5
Figure 5
The expression of YTHDF2, YTHDF1, METTL3, and KIAA1429 in HCC cells and tissue. (a, e) YTHDF2 was overexpressed in HCC tissue and cells. (b, f) YTHDF1 was overexpressed in HCC tissue and cells. (c, g) METTL3 was overexpressed in HCC tissue and cells. (d, h) KIAA1429 was overexpressed in HCC tissue and cells. (i, j) High risk contributed to the poor DFS and OS.
Figure 6
Figure 6
The workflow of the study.

References

    1. Reig M., Cabibbo G. Antiviral therapy in the palliative setting of HCC (BCLC-B and -C) Journal of Hepatology . 2021;74(5):1225–1233. doi: 10.1016/j.jhep.2021.01.046. - DOI - PubMed
    1. Siegel R. L., Miller K. D., Jemal A. Cancer statistics, 2020. CA: a Cancer Journal for Clinicians . 2020;70(1):7–30. doi: 10.3322/caac.21590. - DOI - PubMed
    1. Kong F. H., Ye Q. F., Miao X. Y., et al. Current status of sorafenib nanoparticle delivery systems in the treatment of hepatocellular carcinoma. Theranostics. . 2021;11(11):5464–5490. doi: 10.7150/thno.54822. - DOI - PMC - PubMed
    1. Driscoll J., Wehrkamp C., Ota Y., Thomas J., Yan I., Patel T. Biological nanotherapeutics for liver disease. Hepatology . 2021;74(5):2863–2875. doi: 10.1002/hep.31847. - DOI - PubMed
    1. van Calker D., Serchov T. The "missing heritability"--problem in psychiatry: is the interaction of genetics, epigenetics and transposable elements a potential solution? Neuroscience and Biobehavioral Reviews . 2021;126:23–42. doi: 10.1016/j.neubiorev.2021.03.019. - DOI - PubMed