Human visceral and subcutaneous adipose stem and progenitor cells retain depot-specific adipogenic properties during obesity
- PMID: 36340033
- PMCID: PMC9629396
- DOI: 10.3389/fcell.2022.983899
Human visceral and subcutaneous adipose stem and progenitor cells retain depot-specific adipogenic properties during obesity
Abstract
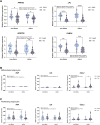
Abdominal obesity associates with cardiometabolic disease and an accumulation of lipids in the visceral adipose depot, whereas lipid accumulation in the subcutaneous depot is more benign. We aimed to further investigate whether the adipogenic properties where cell-intrinsic, or dependent on a depot-specific or obesity-produced microenvironment. We obtained visceral and subcutaneous biopsies from non-obese women (n = 14) or women living with morbid obesity (n = 14) and isolated adipose stem and progenitor cells (ASPCs) from the stromal vascular fraction of non-obese (n = 13) and obese (n = 13). Following in vitro differentiation into mature adipocytes, we observed a contrasting pattern with a lower gene expression of adipogenic markers and a higher gene expression of immunogenic markers in the visceral compared to the subcutaneous adipocytes. We identified the immunogenic factor BST2 as a marker for visceral ASPCs. The effect of obesity and insulin resistance on adipogenic and immunogenic markers in the in vitro differentiated cells was minor. In contrast, differentiation with exogenous Tumor necrosis factor resulted in increased immunogenic signatures, including increased expression of BST2, and decreased adipogenic signatures in cells from both depots. Our data, from 26 women, underscore the intrinsic differences between human visceral and subcutaneous adipose stem and progenitor cells, suggest that dysregulation of adipocytes in obesity mainly occurs at a post-progenitor stage, and highlight an inflammatory microenvironment as a major constraint of human adipogenesis.
Keywords: adipogenesis; human adipocytes; immunogenic adipocytes; obesity; subcutaneous adipocytes; visceral adipocytes.
Copyright © 2022 Mathur, Severinsen, Jensen, Naver, Schrölkamp, Laye, Watt, Nielsen, Krogh-Madsen, Pedersen and Scheele.
Conflict of interest statement
The authors declare that the research was conducted in the absence of any commercial or financial relationships that could be construed as a potential conflict of interest.
Figures


Similar articles
-
Human adipose depots' diverse functions and dysregulations during cardiometabolic disease.NPJ Metab Health Dis. 2024;2(1):34. doi: 10.1038/s44324-024-00036-z. Epub 2024 Nov 29. NPJ Metab Health Dis. 2024. PMID: 39619657 Free PMC article. Review.
-
Extracellular matrix modulates depot-specific adipogenic capacity in adipose tissue of dairy cattle.J Dairy Sci. 2024 Nov;107(11):9978-9996. doi: 10.3168/jds.2024-25040. Epub 2024 Jul 4. J Dairy Sci. 2024. PMID: 38969002
-
Reduced SIRT1 and SIRT2 expression promotes adipogenesis of human visceral adipose stem cells and associates with accumulation of visceral fat in human obesity.Int J Obes (Lond). 2020 Feb;44(2):307-319. doi: 10.1038/s41366-019-0436-7. Epub 2019 Aug 28. Int J Obes (Lond). 2020. PMID: 31462690
-
Characterization of subcutaneous and visceral de-differentiated fat cells.Mol Metab. 2025 Mar;93:102105. doi: 10.1016/j.molmet.2025.102105. Epub 2025 Jan 28. Mol Metab. 2025. PMID: 39884650 Free PMC article.
-
Dysmetabolic adipose tissue in obesity: morphological and functional characteristics of adipose stem cells and mature adipocytes in healthy and unhealthy obese subjects.J Endocrinol Invest. 2021 May;44(5):921-941. doi: 10.1007/s40618-020-01446-8. Epub 2020 Nov 3. J Endocrinol Invest. 2021. PMID: 33145726 Review.
Cited by
-
Transcriptomic analysis reveals regulation of adipogenesis via long non-coding RNA, alternative splicing, and alternative polyadenylation.Sci Rep. 2024 Jul 23;14(1):16964. doi: 10.1038/s41598-024-67648-9. Sci Rep. 2024. PMID: 39043790 Free PMC article.
-
Effects of time-restricted feeding (TRF)-model of intermittent fasting on adipose organ: a narrative review.Eat Weight Disord. 2024 Dec 24;29(1):77. doi: 10.1007/s40519-024-01709-w. Eat Weight Disord. 2024. PMID: 39719521 Free PMC article. Review.
-
Chchd10: A Novel Metabolic Sensor Modulating Adipose Tissue Homeostasis.Adv Sci (Weinh). 2025 Apr;12(15):e2408763. doi: 10.1002/advs.202408763. Epub 2025 Feb 22. Adv Sci (Weinh). 2025. PMID: 39985288 Free PMC article.
-
Adipogenic and SWAT cells separate from a common progenitor in human brown and white adipose depots.Nat Metab. 2023 Jun;5(6):996-1013. doi: 10.1038/s42255-023-00820-z. Epub 2023 Jun 19. Nat Metab. 2023. PMID: 37337126 Free PMC article.
-
Human adipose depots' diverse functions and dysregulations during cardiometabolic disease.NPJ Metab Health Dis. 2024;2(1):34. doi: 10.1038/s44324-024-00036-z. Epub 2024 Nov 29. NPJ Metab Health Dis. 2024. PMID: 39619657 Free PMC article. Review.
References
LinkOut - more resources
Full Text Sources

