. 2022 Oct 21:10:929808.
doi: 10.3389/fcell.2022.929808. eCollection 2022.

Left-right asymmetric expression of the Nodal-Lefty-Pitx2 module in developing turtle forebrain

Affiliations

Left-right asymmetric expression of the Nodal-Lefty-Pitx2 module in developing turtle forebrain

Eriko Kajikawa et al. Front Cell Dev Biol. .

Abstract

The epithalamus of zebrafish shows morphological and molecular left-right (L-R) asymmetry, but such asymmetry is not apparent in tetrapods. To provide further insight into the evolutionary diversity of brain L-R asymmetry, we have now examined the developing brains of reptile embryos for expression of Nodal, Lefty, and Pitx2. Two turtle species, the Chinese softshell turtle and the red-eared slider turtle, showed left-sided expression of these three genes in the developing forebrain, with this expression occurring after Nodal expression at the lateral plate and the L-R organizer has disappeared. Nodal activity, as revealed by the detection of phosphorylated Smad2/3, was also apparent in the neural epithelium on the left side in both turtle species. In the Chinese softshell turtle, the habenula did not show apparent asymmetry in size and the parapineal organ was absent, but the expression of Kctd12 in the habenula showed a small yet reproducible asymmetry. In contrast to the turtles, L-R asymmetric expression of Nodal, Lefty, Pitx2, or Kctd12 was not detected in the developing brain of the Madagascar ground gecko. The transcriptional enhancer (ASE) responsible for the asymmetric expression of Nodal, Lefty, and Pitx2 was conserved among reptiles, including the Chinese softshell turtle and Madagascar ground gecko. Our findings suggest that Nodal, Lefty, and Pitx2 have the potential to be asymmetrically expressed in the developing brain of vertebrates, but that their expression varies even among reptiles.

Keywords: Nodal; brain; left-right asymmetry; reptile; turtle.


Conflict of interest statement

The authors declare that the research was conducted in the absence of any commercial or financial relationships that could be construed as a potential conflict of interest.

Figures

FIGURE 1
FIGURE 1
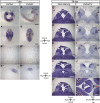
L-R asymmetric expression of Nodal, Lefty, and Pitx2 in the developing brain of the Chinese softshell turtle and red-eared slider turtle. (A–C), (E–G) Whole-mount in situ hybridization analysis of the expression domains of Nodal (A,E), Lefty (B,F), and Pitx2 (C,G) in the developing brain of Chinese softshell turtle embryos at 3 dpo (A–C) and of red-eared slider turtle embryos at 4 dpo (E–G). Top, middle, and bottom panels show left lateral views, dorsal views, and frontal sections, respectively. Domains manifesting L-R asymmetric expression are indicated by closed arrowheads. Rostral-caudal, dorsal-ventral, and L-R axes are indicated. Scale bars, 0.5 mm (top panels) and 0.2 mm (middle panels). Dorsal views, frontal sections, and higher magnification images of frontal sections of embryo in (A–C), (E–G) are shown in (A–C), (E–G), (A–C), (E–G), and (A–C), (E–G), respectively. (D,H) Nodal activity in Chinese softshell turtle (D) and red-eared slider turtle (H) embryos at 3 and 4 dpo, respectively, as determined by immunofluorescence staining of phosphorylated (p) Smad2/3 (red fluorescence). Nuclei were stained with 4′,6-diamidino-2-phenylindole (blue fluorescence). Nodal activity is asymmetric (L > R) in the diencephalon.
FIGURE 2
FIGURE 2
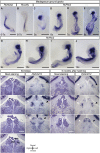
Molecular and morphological L-R asymmetry of the diencephalon in Chinese softshell turtle embryos at later stages. (A,B) Whole-mount in situ hybridization analysis of Pitx2 (A) and Not2 (B) in the developing brain of embryos at 7 dpo. Left lateral views (A,B), dorsal views (A,B), frontal sections (A,B), and higher magnification views of the frontal sections (A,B) are shown for each embryo. Closed arrowheads indicate the regions showing L-R asymmetric expression in the developing brain. Scale bars, 1.0 mm (top panels) and 0.5 mm (second from the top panels). (C–F) Nissl staining of frontal sections of embryos at 38 dpo. Sections at the level of the habenula are shown from the rostral side (C) to the caudal side (F). There was no apparent L-R asymmetry in morphology although a subtle asymmetry may exist in (D). Dotted lines in 2(D) indicate subdivision of the habenula shown in (D). MH and LH denote the medial habenula and lateral habenula, respectively. Scale bar, 0.2 mm. (G–J) Kctd12 expression in the habenula as examined by in situ hybridization with frontal sections of embryos at 38 dpo. Frontal sectional levels in (G–J) are similar to those in (C–F), respectively. Regions positive for Kctd12 expression on the right and left sides are indicated by white and black arrowheads, respectively. (K) Nissl-stained section of a Chinese softshell turtle at 38 dpo. The pineal organ is marked by the red arrowhead.
FIGURE 3
FIGURE 3
Lack of L-R asymmetric expression of Nodal, Lefty, and Pitx2 in the developing brain of the Madagascar ground gecko. (A–J) Whole-mount in situ hybridization analysis of Nodal (A), Lefty (B), and Pitx2 (C–J) expression in the developing brain of gecko embryos. These genes are not expressed in the developing brain, whereas their expression is apparent in other regions. The embryos were obtained before oviposition (9–10 days after the previous oviposition) (A–F) or at 0 to 1 dpo (G–J). The number of somites (s) is indicated for each embryo. Scale bars, 0.5 mm. (K–P) The habenula of gecko at the 50–52 dpo. Nissl staining of frontal sections at the level of the habenula is shown from the rostral side (K) to the caudal side (M). Dotted lines in (L′’) indicate the subdivision of the habenula shown in section (L). MdH, MvH, and LH denote the medial dorsal habenula, medial ventral habenula, and lateral habenula, respectively. Kctd12 expression in the habenula as examined by in situ hybridization with frontal sections are shown in (N–P). Frontal sectional levels in (N) to ( p ) are similar to those in (K) to (M), respectively. Regions positive for Kctd12 expression on the right and left sides are indicated by white and black arrowheads, respectively. (Q–V) The habenula of gecko at 5 months after hatching. Nissl staining of frontal sections at the level of the habenula are shown from the rostral side (Q) to the caudal side (S). Kctd12 expression in the habenula as examined by in situ hybridization with frontal sections are shown in (T–V). Frontal sectional levels in (T–V) are similar to those in (Q–S), respectively. Regions positive for Kctd12 expression on the right and left sides are indicated by white and black arrowheads, respectively.
FIGURE 4
FIGURE 4
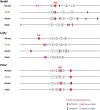
Transcriptional enhancer (ASE) sequences of Nodal, Lefty, and Pitx2 genes of amniotes. FoxH1-binding sequences (red and pink boxes) present within a 30-kbp region of Nodal, Lefty, and Pitx2 genes of mouse (Mus musculus), reptiles, and chicken (Gallus) are shown. Analysis of Nodal genes was previously performed (Kajikawa et al., 2020). For mouse, which has two Lefty genes, Lefty2 is shown. Red closed and open boxes correspond to AATCCACA and TGTGGATT, respectively. Pink closed and open boxes denote ATT [AC or CA]ACA and TGT [GT or TG]ATT, respectively. Numbered boxes indicate exons. Turtle and gecko refer to the Chinese softshell turtle (Pelodiscus sinensis) and Madagascar ground gecko (Paroedura picta), respectively. Nodal, Lefty, and Pitx2 genes of other turtles (green sea turtle and painted turtle) show similar configurations.

Similar articles

Cited by

References

    1. Aizawa H., Amo R., Okamoto H. (2011). Phylogeny and ontogeny of the habenular structure. Front. Neurosci. 5, 138. 10.3389/fnins.2011.00138 - DOI - PMC - PubMed
    1. Bianco I. H., Wilson S. W. (2009). The habenular nuclei: A conserved asymmetric relay station in the vertebrate brain. Philos. Trans. R. Soc. Lond. B Biol. Sci. 364, 1005–1020. 10.1098/rstb.2008.0213 - DOI - PMC - PubMed
    1. Concha M. L., Burdine R. D., Russell C., Schier A. F., Wilson S. W. (2000). A nodal signaling pathway regulates the laterality of neuroanatomical asymmetries in the zebrafish forebrain. Neuron 28, 399–409. 10.1016/s0896-6273(00)00120-3 - DOI - PubMed
    1. Concha M. L., Russell C., Regan J. C., Tawk M., Sidi S., Gilmour D. T., et al. (2003). Local tissue interactions across the dorsal midline of the forebrain establish CNS laterality. Neuron 39, 423–438. 10.1016/s0896-6273(03)00437-9 - DOI - PubMed
    1. Concha M. L., Wilson S. W. (2001). Asymmetry in the epithalamus of vertebrates. J. Anat. 199, 63–84. 10.1046/j.1469-7580.2001.19910063.x - DOI - PMC - PubMed

LinkOut - more resources