. 2022 Oct 19;7(43):38576-38588.
doi: 10.1021/acsomega.2c04027. eCollection 2022 Nov 1.

Simple Assessment of Red Blood Cell Deformability Using Blood Pressure in Capillary Channels for Effective Detection of Subpopulations in Red Blood Cells

Affiliations

Simple Assessment of Red Blood Cell Deformability Using Blood Pressure in Capillary Channels for Effective Detection of Subpopulations in Red Blood Cells

Yang Jun Kang et al. ACS Omega. .

Abstract

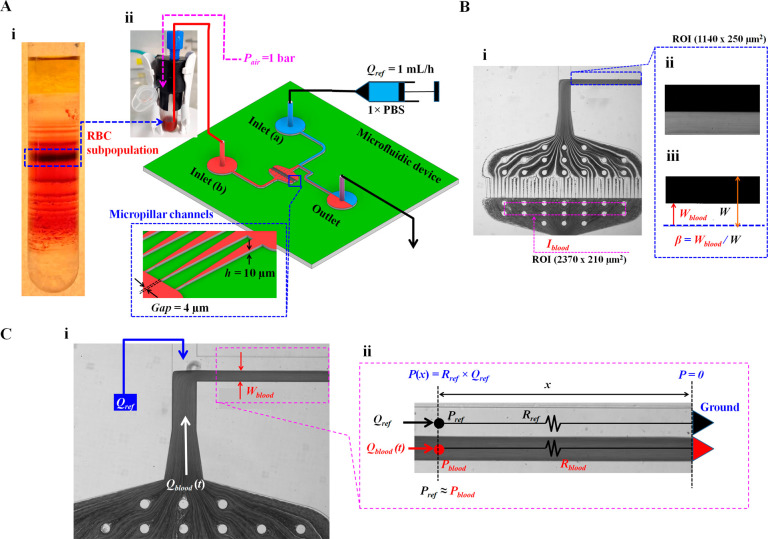
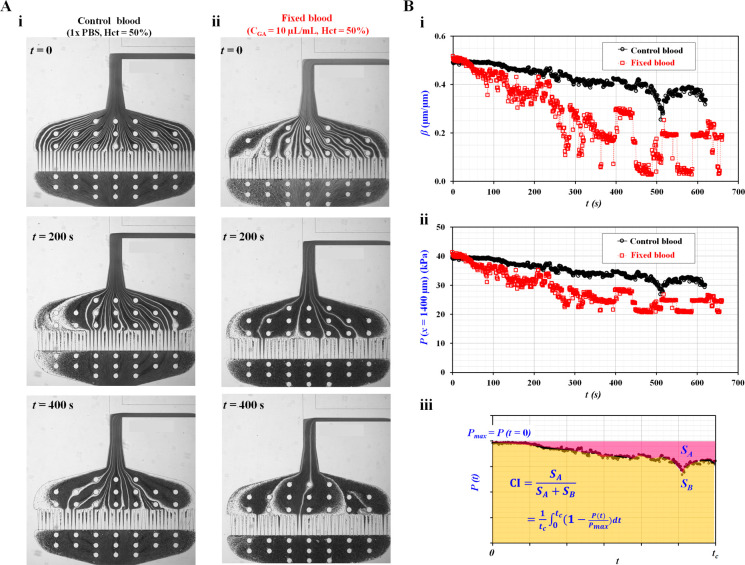
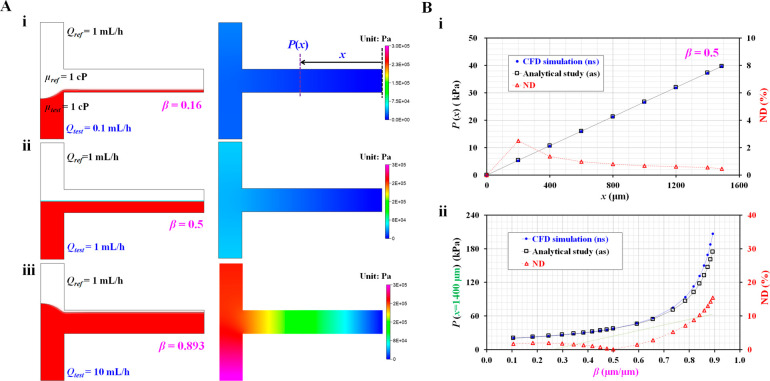
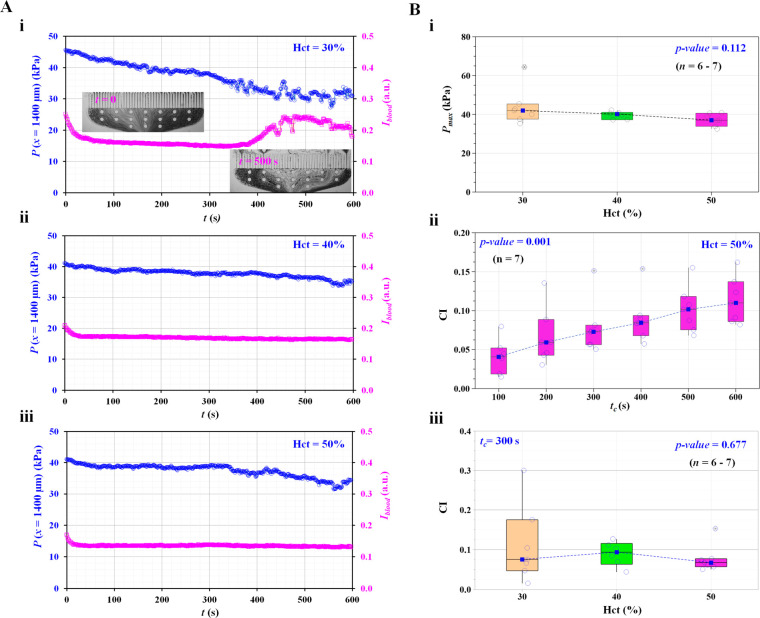
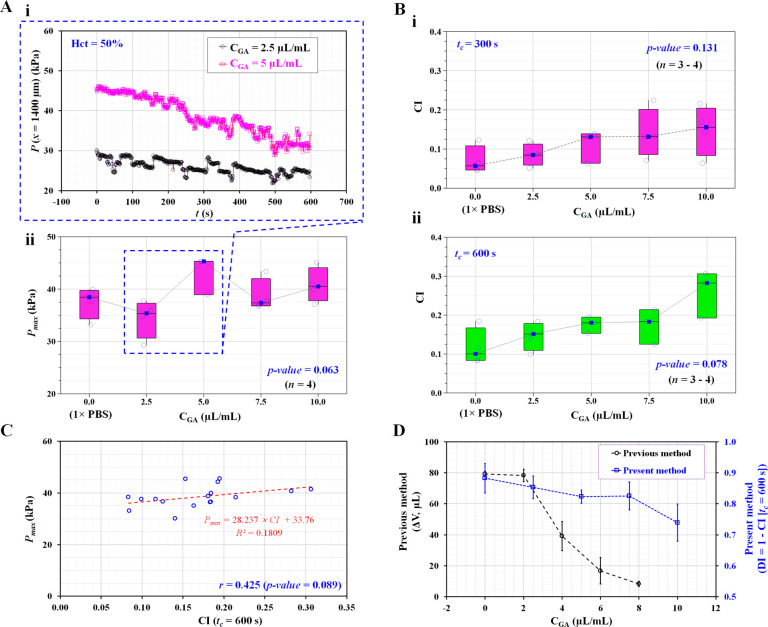
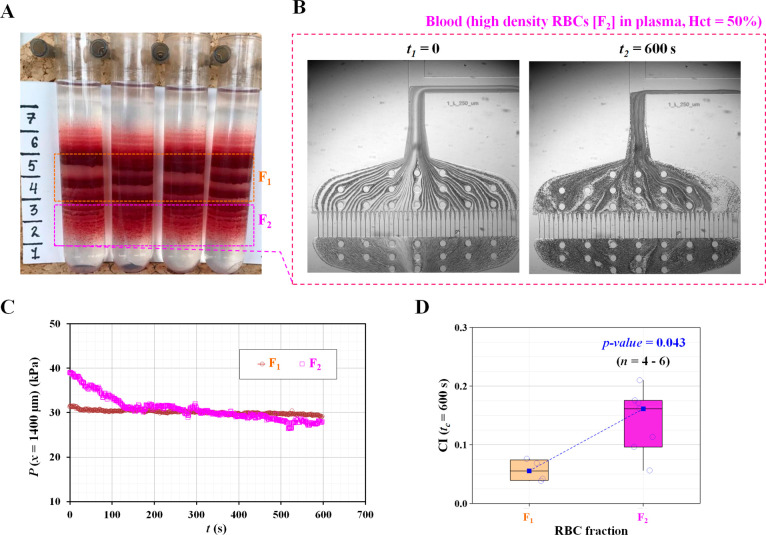
Assessment of red blood cell (RBC) deformability as a biomarker requires expensive equipment to induce and monitor deformation. In this study, we present a simple method for quantifying RBC deformability. We designed a microfluidic channel consisting of a micropillar channel and a coflowing channel connected in series. When blood (loading volume = 100 μL) was injected continuously into the device under constant pressure (1 bar), we monitored the boundary position of the blood and the reference flow in the coflowing channel. A decrease in the deformability of RBCs results in a growing pressure drop in the micropillar channel, which is mirrored by a decrease in blood pressure in the coflowing channel. Analysis of this temporal variation in blood pressure allowed us to define the clogging index (CI) as a new marker of RBC deformability. As a result of the analytical study and numerical simulation, we have demonstrated that the coflowing channel may serve as a pressure sensor that allows the measurement of blood pressure with accuracy. We have shown experimentally that a higher hematocrit level (i.e., more than 40%) does not have a substantial influence on CI. The CI tended to increase to a higher degree in glutaraldehyde-treated hardened RBCs. Furthermore, we were able to resolve the difference in deformability of RBCs between two different RBC density subfractions in human blood. In summary, our approach using CI provides reliable information on the deformability of RBCs, which is comparable to the readouts obtained by ektacytometry. We believe that our microfluidic device would be a useful tool for evaluating the deformability of RBCs, which does not require expensive instruments (e.g., high-speed camera) or time-consuming micro-PIV analysis.


Conflict of interest statement

The authors declare no competing financial interest.

Figures

Figure 1
Figure 1
Microfluidic-based deformability measurement for the effective monitoring of minor subpopulations in RBCs. (A) Schematic diagram of experimental setup including Percoll density gradient for collecting subpopulations in RBCs and a microfluidic system for measuring the RBCs’ deformability. (i) RBC subpopulation depending on the difference in density using the Percoll density gradient. (ii) Microfluidic system including a microfluidic device, a pressure controller for blood, and a syringe pump for reference fluid (1× PBS). The microfluidic device consists of two inlets (a, b), an outlet, and T-shaped channels (width [W] = 250 μm, and depth [h] = 10 μm). A micropillar channel (gap = 4 μm) is positioned between inlet a and the coflowing channel. Blood sample (0.1 mL approximately) was supplied into 1 mL tube. Using the pressure controller, blood was supplied into inlet a at a constant pressure of Pblood = 1 bar. The syringe pump is used to supply reference fluid into inlet b at the constant flow rate of Qref = 1 mL/h. (B) Two regions-of-interest (ROIs) selected for quantifying image intensity (Iblood) and interface in coflowing streams (β). (i) Iblood was calculated by averaging image intensity of blood flows based on ROI (2370 × 210 μm2) selected in the upstream of pillar channels. (ii) The grayscale image of the coflowing channel with ROI 1140 × 250 μm2 was cropped after subtracting each grayscale image from the background image. (iii) Using a digital image procedure, the grayscale image was converted to a binary image. A blood-filled width (Wblood) was then calculated by averaging interfacial locations over the ROI. The β was defined as β = Wblood/W. (C) Simple mathematical model with a discrete fluidic circuit model for evaluating blood pressure in the coflowing channel (Pblood). (i) Coflowing channel filled with blood sample and reference fluid. Both fluids flow at the flow rates of Qref and Qblood. Here, Qblood is not specified and varied over time. (ii) Discrete fluidic circuit model of coflowing channel composed of fluidic resistances (Rref, Rblood) and flow rates (Qref, Qblood). Here, subscript ref and blood mean reference fluid and blood sample, respectively. As both fluid streams have the same pressure (i.e., Pref = Pblood = P), blood pressure at a specific location [P(x)] is estimated analytically as P(x) = Rref × Qref. ▶ represents P = 0 as the ground condition.
Figure 2
Figure 2
Definition of clogging index (CI) using temporal variations of blood pressure (P). Control blood (Hct = 50%) was prepared by adding normal RBCs into 1× PBS. Additionally, fixed blood (Hct = 50%) was prepared by adding fixed RBCs with 10 μL of glutaraldehyde solution into 1× PBS. (A) Variations of microscopic images over time with respect to control blood and fixed blood. (i) Variation of the microscopic image of control blood over time (t) (t = 0, 200, and 400 s). (ii) Variation of the microscopic image of fixed blood with respect to specific time (t) (t = 0, 200, and 400 s). (B) Temporal variation of pressure (P) and definition of clogging index (CI). (i) Temporal variations of β with respect to control blood and fixed blood. (ii) Temporal variations of P(x = 1400 μm) with respect to control blood and fixed blood. (iii) Calculation of clogging index (CI) and deformability index (DI) using temporal variations of P(t) obtained for t = tc. Here, maximum pressure (Pmax) was defined as P(t = 0) = Pmax. Using temporal variations of P, SA and SB were quantified as SA = ∫0t=tc(PmaxP[t]) dt and SB = ∫0t=tcPmax dt, respectively. Based on the definition of CI (CI = SA/[SA + SB]), the CI was expressed analytically as CI = formula image.
Figure 3
Figure 3
Validation of the analytical formula of blood pressure by means of numerical simulation. (A) Numerical simulation with respect to interfacial location (β). We assume both fluids had the same viscosity (i.e., μref = μtest = 1 cP). Flow rate of reference fluid was fixed at Qref = 1 mL/h. Flow rate of test fluid was only changed to set a specific value of β. (i) Variations of blood pressure distributions along the coflowing channel at β = 0.16 (Qtest = 0.1 mL/h). (ii) Variations of blood pressure distributions along the coflowing channel at β = 0.5 (Qtest = 1 mL/h). (iii) Variations of blood pressure distributions along the coflowing channel at β = 0.893 (Qtest = 10 mL/h). (B) Quantitative comparison between analytical study and CFD simulation. (i) Variations of P and normalized difference (ND) with respect to location (x) and individual method. (ii) Variations of P(x = 1400 μm) and ND with respect to β and individual method.
Figure 4
Figure 4
Contribution of hematocrit (Hct) to clogging index (CI). (A) Quantitative evaluation of pressure (P) and image intensity (Iblood) with respect to hematocrit of blood sample and elapsed time. (i) Temporal variations of P and Iblood for normal blood (Hct = 30%). Inset shows microscopic images captured at a specific times (t) (t = 0 and 500 s). (ii) Temporal variations of P and Iblood for normal blood (Hct = 40%). (iii) Temporal variations of P and Iblood for normal blood (Hct = 50%). (B) Variations of CI and Pmax with respect to Hct. (i) Variations of Pmax with respect to Hct. (ii) Variations of CI with respect to tc. Hematocrit of blood sample was fixed at Hct = 50%. (iii) Variations of CI with respect to Hct. Integration time (tc) was fixed at tc = 300 s.
Figure 5
Figure 5
Quantitative evaluation of clogging index versus degree in RBCs’ deformability. The degree in RBCs’ deformability was controlled by exposing normal RBCs to different concentrations of GA solution. Hardened blood (Hct = 50%) was then prepared by adding fixed RBCs into 1× PBS. (A) Contribution of concentration of GA solution to Pmax. (i) Temporal variations of P(x = 1400 μm) with respect to CGA = 2.5 and 5 μL/mL. (ii) Variations of Pmax with respect to CGA. (B) Variations of CI with respect to CGA and acquisition time (tc). (i) Variations of CI with respect to CGA and tc = 300 s. (ii) Variations of CI with respect to CGA and tc = 600 s. (C) Linear correlation between Pmax and CI. (D) Quantitative comparison of RBCs’ deformability between the previous method (i.e., ΔV = Ac0t=tcU dt; Ac, cross-sectional area; and U, average velocity) and present method (i.e., DI = 1 – CI) with respect to CGA.
Figure 6
Figure 6
Quantitative evaluation of RBCs’ deformability with respect to density of RBCs. Percoll density gradient centrifugation was used to segregate RBCs depending on difference in density. (A) Snapshot showing the difference in density of RBCs. For convenience, two fractions of RBCs (F1, normal density; F2, high density) were selected to quantify RBCs’ deformability with respect to density difference. (B) Microscopic images captured at specific times (t) (t = 0 and 600 s) for blood sample prepared from the F2 fraction. (C) Temporal variations of P(x = 1400 μm) with respect to F1 and F2. (D) Variations of clogging index (CI) with respect to the RBC fraction (F1 and F2).

Similar articles

Cited by

References

    1. Paul R.; Zhou Y.; Nikfar M.; Razizadeh M.; Liu Y. Quantitative absorption imaging of red blood cells to determine physical and mechanical properties. RSC Adv. 2020, 10, 38923–38936. 10.1039/D0RA05421F. - DOI - PMC - PubMed
    1. Skalak R.; Branemark P.-I. Deformation of red blood cells in capillaries. Science 1969, 164, 717–719. 10.1126/science.164.3880.717. - DOI - PubMed
    1. Huisjes R.; Bogdanova A.; Solinge W.W.v.; Schiffelers R. M.; Kaestner L.; Wijk R.v. Squeezing for life - properties of red blood cell deformability. Front. Physiol. 2018, 9, 656.10.3389/fphys.2018.00656. - DOI - PMC - PubMed
    1. Pivkin I. V.; Peng Z.; Karniadakis G. E.; Buffet P. A.; Dao M.; Suresh S. Biomechanics of red blood cells in human spleen and consequences for physiology and disease. Proc. Natl. Acad. Sci. U. S. A. 2016, 113, 7804–7809. 10.1073/pnas.1606751113. - DOI - PMC - PubMed
    1. Neri S.; Swinkels D. W.; Matlung H. L.; Bruggen R.v. Novel concepts in red blood cell clearance. Curr. Opin. Hematol. 2021, 28, 438–444. 10.1097/MOH.0000000000000679. - DOI - PubMed