A nomogram model based on preoperative grey-scale US features and routine serum biomarkers to predict the outcome of infants with biliary atresia after Kasai portoenterostomy
- PMID: 36340714
- PMCID: PMC9631934
- DOI: 10.3389/fped.2022.972855
A nomogram model based on preoperative grey-scale US features and routine serum biomarkers to predict the outcome of infants with biliary atresia after Kasai portoenterostomy
Abstract
Objective: To establish a nomogram to predict the outcome of biliary atresia (BA) infants 3-months post- Kasai portoenterostomy (KPE).
Methods: BA Infants who underwent KPE from two hospitals were included in the training (n = 161) and validation cohorts (n = 64). A logistic regression equation (Equation A) for predicting the serum total bilirubin (TBIL) level 3-month post-KPE was established in the training cohort. Then, a nomogram was developed based on Equation A in the training cohort and validated in the validation cohort. Moreover, a new equation (Equation B) was generated based on the nomogram and the size of the enlarged hilar lymph nodes (LNs) in the validation cohort. The predictive performance of the nomogram was evaluated by the receiver operating characteristic (ROC) curve and by calculating the area under the ROC curve (AUC), sensitivity, specificity, and positive (PPV) and negative (NPV) prediction values.
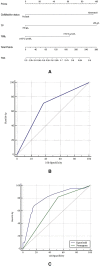
Results: A nomogram based on gallbladder morphology and serum levels of TBIL and total protein (TP) was established with AUC (95%CI) of 0.673 (0.595, 0.745) and 0.647 (0.518, 0.763), sensitivity (95%CI) of 71.4% (62.1%,79.6%) and 81.8% (59.7%,94.8%), specificity (95%CI) of 63.3% (48.3%,76.6%) and 47.6% (32.0%,63.6%), PPV (95%CI) of 81.6% (72.5%,88.9%) and 45.0% (29.3%,61.5%), and NPV (95%CI) 49.2% (36.4%,62.1%) and 83.3% (62.6%,95.3%), respectively, in the training and validation cohorts. Furthermore, in the validation cohort, the AUC (95%CI) of Equation B was 0.798 (95%CI: 0.679, 0.888), which was significantly higher than that of the nomogram (P = 0.042).
Conclusion: A nomogram based on the pre-KPE gallbladder morphology, TBIL, and TP to predict the outcome of BA 3-months post-KPE is established. Moreover, the addition of the size of the enlarged hilar LNs into the nomogram further improves its predictive value.
Keywords: Kasai portoenterostomy; biliary taresia; hilar lymph nodes; nomogram; prognostic prediction.
© 2022 Weng, Ye, Zhou, Chen, Ling, Fang, Liu, Wu, Qiu and Lyu.
Conflict of interest statement
The authors declare that the research was conducted in the absence of any commercial or financial relationships that could be construed as a potential conflict of interest.
Figures


Similar articles
-
Porta hepatis lymph nodes on US: not only identify biliary atresia but also predict outcomes after Kasai portoenterostomy surgery.Insights Imaging. 2024 Jun 20;15(1):154. doi: 10.1186/s13244-024-01735-3. Insights Imaging. 2024. PMID: 38900331 Free PMC article.
-
A Nomogram Predicting the Prognosis of Children With Biliary Atresia After Hepatoportoenterostomy.Front Pediatr. 2021 Feb 24;9:641318. doi: 10.3389/fped.2021.641318. eCollection 2021. Front Pediatr. 2021. PMID: 33718307 Free PMC article.
-
2D shear wave elastography combined with age and serum biomarkers prior to kasai surgery predicts native liver survival of biliary atresia infants.J Intern Med. 2020 Nov;288(5):570-580. doi: 10.1111/joim.13097. Epub 2020 Jun 4. J Intern Med. 2020. PMID: 32496659
-
Biomarkers for the diagnosis and post-Kasai portoenterostomy prognosis of biliary atresia: a systematic review and meta-analysis.Sci Rep. 2021 Jun 3;11(1):11692. doi: 10.1038/s41598-021-91072-y. Sci Rep. 2021. PMID: 34083585 Free PMC article.
-
Adjuvant steroid treatment following Kasai portoenterostomy and clinical outcomes of biliary atresia patients: an updated meta-analysis.World J Pediatr. 2017 Feb;13(1):20-26. doi: 10.1007/s12519-016-0052-8. Epub 2016 Oct 15. World J Pediatr. 2017. PMID: 27830578 Review.
References
LinkOut - more resources
Full Text Sources

