. 2022 Oct 26:2022:2205616.
doi: 10.1155/2022/2205616. eCollection 2022.

Association between Sensitivity to Thyroid Hormone Indices and Bone Mineral Density in US Males

Affiliations

Association between Sensitivity to Thyroid Hormone Indices and Bone Mineral Density in US Males

Shuai Chen et al. Int J Endocrinol. .

Abstract

Objectives: Thyroid hormone is acknowledged as a pivotal factor in skeletal development and adult bone maintenance. However, available data about the relationship between sensitivity to thyroid hormone and bone mineral density (BMD) remain limited and conflicting. The purpose of the study was to explore the complex relationship between sensitivity to thyroid hormone indices and BMD using cross-sectional analysis.

Methods: An overall sample of 3,107 males from the National Health and Nutrition Examination Survey (NHANES) was studied in the study. The thyroid hormone sensitivity indices included free triiodothyronine/tree thyroxine (FT3/FT4), thyroid-stimulating hormone index (TSHI), thyrotroph thyroxine resistance index (TT4RI), and thyroid feedback quantile-based index (TFQI). Given the complex study design and sample weights, the correlation between sensitivity to thyroid hormone indices and BMD was evaluated through multivariate linear regression models, and extra subgroup analyses were performed to examine the robustness of the results.

Results: Among the 3,107 participants, we demonstrated that FT3/FT4 was negatively correlated with lumbar BMD (β = -0.0.35, 95% CI: -0.084-0.013, P < 0.05). In the terms of central sensitivity to thyroid hormone, TFQI showed a significant negative relationship with the BMD of the lumbar (β = -0.018, 95% CI: -0.033 to -0.003, P < 0.05), total femur (β = -0.020, 95% CI: -0.035 to -0.006, P < 0.01), and femur neck (β = -0.018, 95% CI: -0.031 to -0.005, P < 0.01). In the subgroup analyses stratified by body mass index (BMI), the significant negative correlation between TFQI and lumbar BMD remained in the male participants with BMI between 18.5 and 24.9 kg/m2.

Conclusions: Decreased indices of sensitivity to thyroid hormones are strongly associated with increased lumbar BMD, suggesting that the dysfunction of peripheral and central response to thyroid hormone might contribute to bone loss. In addition, FT3/FT4 and TFQI were considered to be the preferable indicators to guide the prevention and clinical treatment of osteoporosis.


Conflict of interest statement

The authors declare that they have no conflicts of interest.

Figures

Figure 1
Figure 1
Study flowchart.
Figure 2
Figure 2
The association between FT3/FT4 and lumbar BMD. (a) Each black point represents a sample. (b) Solid red line represents the smooth curve fit between variables. Blue bands represent the 95% of confidence interval from the fit. Age, race, education, physical activity, smoking behavior, alcohol behavior, BMI, hypertension, diabetes, HbAlc, albumin, blood urea nitrogen, total calcium, cholesterol, creatinine, phosphorus, triglycerides, and uric acid were adjusted.
Figure 3
Figure 3
The association between TFQI and lumbar BMD. (a) Each black point represents a sample. (b) Solid red line represents the smooth curve fit between variables. Blue bands represent the 95% of confidence interval from the fit. Age, race, education, physical activity, smoking behavior, alcohol behavior, BMI, hypertension, diabetes, HbAlc, albumin, blood urea nitrogen, total calcium, cholesterol, creatinine, phosphorus, triglycerides, and uric acid were adjusted.
Figure 4
Figure 4
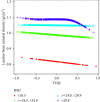
The association between TFQI and lumbar bone mineral density stratified by BMI. Age, race, education, physical activity, smoking behavior, alcohol behavior, BMI, hypertension, diabetes, HbAlc, albumin, blood urea nitrogen, total calcium, cholesterol, creatinine, phosphorus, triglycerides, and uric acid were adjusted.

Similar articles

Cited by

References

    1. Kanis J. A., Cooper C., Rizzoli R., Reginster J. Y. European guidance for the diagnosis and management of osteoporosis in postmenopausal women. Osteoporosis International . 2019;30(1):3–44. doi: 10.1007/s00198-018-4704-5. - DOI - PMC - PubMed
    1. Zhang X., Chen K., Chen X., et al. Integrative analysis of genomics and transcriptome data to identify regulation networks in female osteoporosis. Front Genet . 2020;11 doi: 10.3389/fgene.2020.600097.600097 - DOI - PMC - PubMed
    1. Wright N. C., Looker A. C., Saag K. G., et al. The recent prevalence of osteoporosis and low bone mass in the United States based on bone mineral density at the femoral neck or lumbar spine. Journal of Bone and Mineral Research . 2014;29(11):2520–2526. doi: 10.1002/jbmr.2269. - DOI - PMC - PubMed
    1. Tanha K., Fahimfar N., Nematollahi S., et al. Annual incidence of osteoporotic hip fractures in Iran: a systematic review and meta-analysis. BMC Geriatr . 2021;21(1):p. 668. doi: 10.1186/s12877-021-02603-1. - DOI - PMC - PubMed
    1. Williams S. A., Daigle S. G., Weiss R., Wang Y., Arora T., Curtis J. R. Economic burden of osteoporosis-related fractures in the US medicare population. Ann. Pharmacother. . 2021;55(7):821–829. doi: 10.1177/1060028020970518. - DOI - PMC - PubMed

LinkOut - more resources