. 2022 Oct 20:13:1009087.
doi: 10.3389/fneur.2022.1009087. eCollection 2022.

Can cochlear implantation prevent cognitive decline in the long-term follow-up?

Affiliations

Can cochlear implantation prevent cognitive decline in the long-term follow-up?

Christiane Völter et al. Front Neurol. .

Abstract

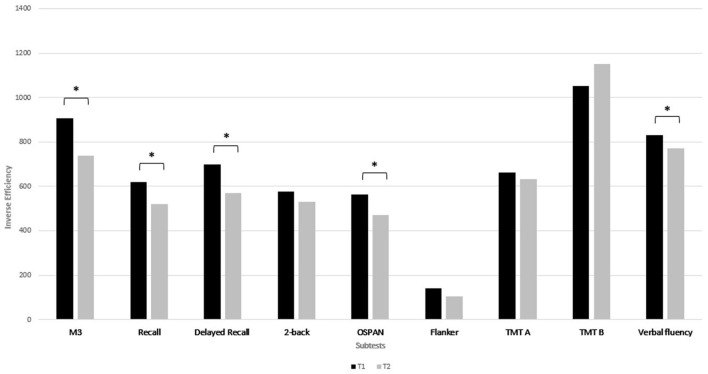
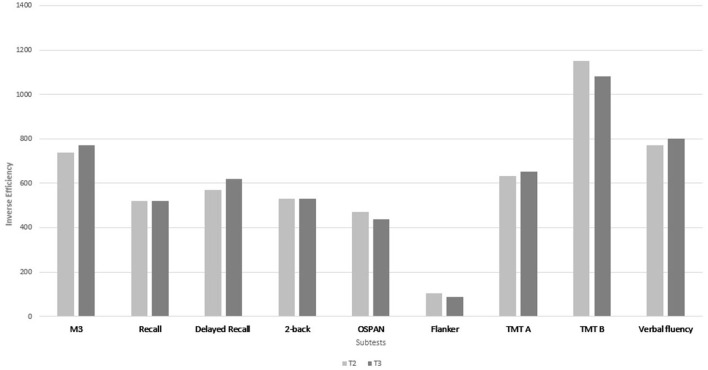
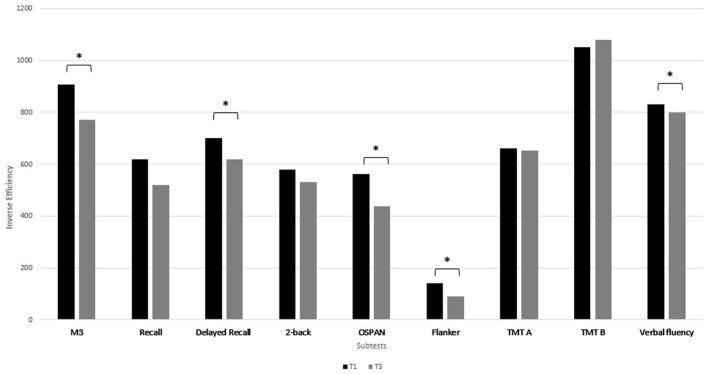
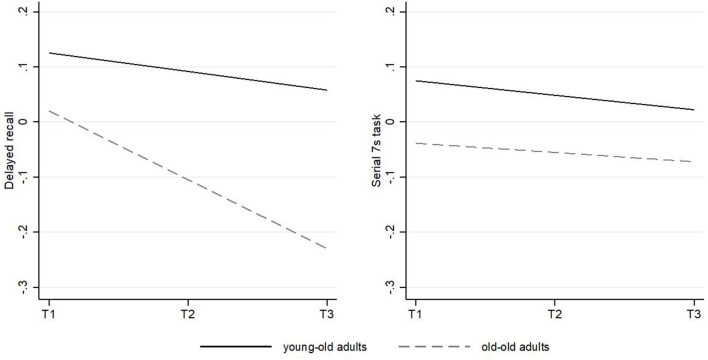
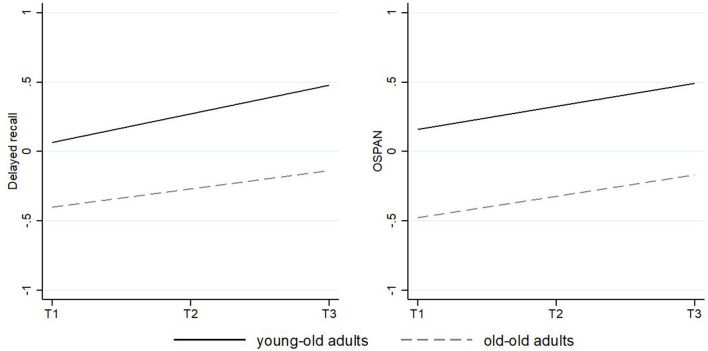
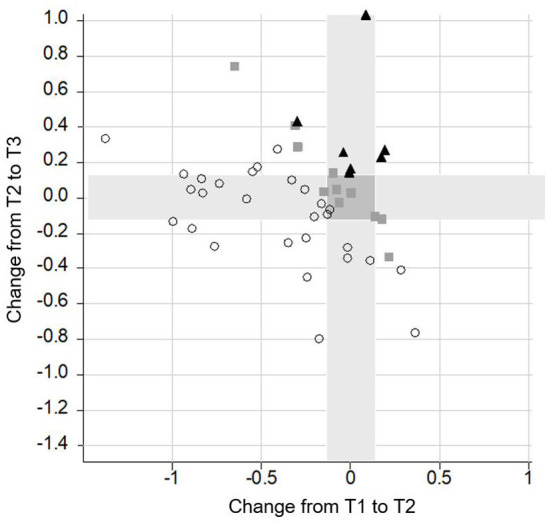
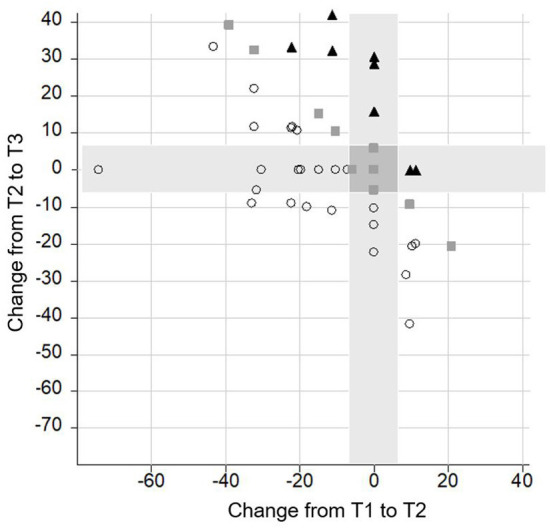
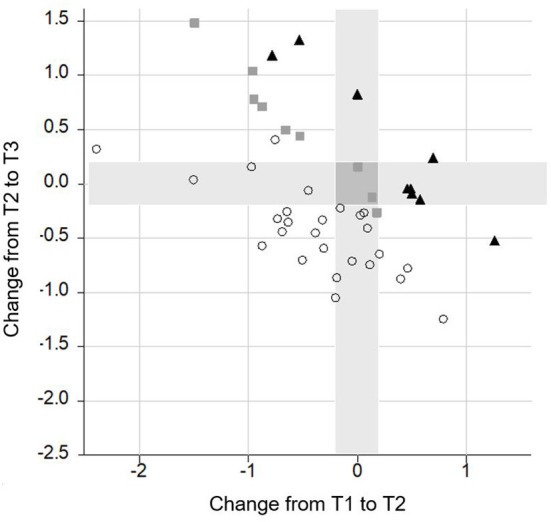
Cognitive function and hearing are known to both decline in older adults. As hearing loss is proposed to be one modifiable risk factor for dementia, the impact of auditory rehabilitation on cognitive decline has been gaining increasing attention. Despite a large number of studies, long-term data are still rare. In a large prospective longitudinal monocentric study, 50 adults (aged ≥ 50 years) with severe postlingual bilateral hearing loss received a cochlear implant (CI). They underwent comprehensive neurocognitive testing prior to implantation (T1), at 12 months (T2) and up to 65 months (T3) after implantation. Various cognitive subdomains such as attention, inhibition, working memory, verbal fluency, mental flexibility and (delayed) recall were assessed by the computer-based non-auditory test battery ALAcog©. The observed trajectories of two exemplary cognitive subdomains (delayed recall and working memory) were then fitted over time using multilevel growth models to adjust for sociodemographic covariates and compared with 5-year longitudinal data from a sample of older adults from the representative Survey of Health, Aging and Retirement in Europe (SHARE) study. Postoperatively, auditory functions improved from 6.98% (SD 12.83) to 57.29% (SD 20.18) in monosyllabic speech understanding. Cognitive functions significantly increased from T1 to T3 in attention (p = 0.001), delayed recall (p = 0.001), working memory (OSPAN; p = 0.001), verbal fluency (p = 0.004), and inhibition (p = 0.002). A closer look at follow-up revealed that cognitive improvement could be detected between T1 and T2 and thereafter remained stable in all subtests (p ≥ 0.06). Additional longitudinal analysis confirmed these findings in a rigorous multilevel approach in two exemplary cognitive subdomains. In contrast to the SHARE data, there was no evidence for age-differential associations over time in CI recipients. This suggests that older adults benefit equally from cochlear implantation. CI users with worse preoperative cognitive skills experienced the most benefit (p < 0.0001). Auditory rehabilitation by cochlear implantation has a stimulating effect on cognitive functions beyond an improvement in speech understanding and an increased well-being. Large multicenter studies using standardized protocols have to be undertaken in the future to find out whether hearing restoration might help to prevent cognitive decline.

Keywords: auditory rehabilitation; cochlear implant; dementia; hearing loss; prevention.


Conflict of interest statement

Authors CV, JT, and SD have received reimbursement of scientific meeting participation fees and accommodation expenses, as well as honoraria for preparing continuing medical education events and funding for research projects that they initiated, from MED-EL. The remaining authors declare that the research was conducted in the absence of any commercial or financial relationships that could be construed as a potential conflict of interest.

Figures

Figure 1
Figure 1
Median of the IE (inverse efficiency) of the neurocognitive subtests at T1 and at T2. A lower IE score indicates a better performance. *Indicates a p-value of p < 0.005 after Bonferroni correction.
Figure 2
Figure 2
Median of the IE (inverse efficiency) of the neurocognitive subtests at T2 and at T3. A lower IE score indicates a better performance. Between T2 and T3 no significant change was found in any cognitive subtest after Bonferroni correction.
Figure 3
Figure 3
Median of the IE (inverse efficiency) of the neurocognitive subtests at T1 and at T3. A lower IE score indicates a better performance. *Indicates a p-value of p < 0.005 after Bonferroni correction.
Figure 4
Figure 4
Predicted change of performance in delayed recall and the Serial 7s task in the SHARE sample over time. The solid slope shows the trajectory for young-old adults with an average age mean of 60.51 years; the dashed slope shows the trajectory for old-old adults with an average age mean of 69.59 years. Slopes are controlled for all covariates.
Figure 5
Figure 5
Predicted change of performance in delayed recall and the OSPAN in the cochlear implant sample over time. The solid slope shows the trajectory for young-old adults with an average age mean of 56.73 years; the dashed slope shows the trajectory for old-old adults with an average age mean of 72.50 years. Slopes are controlled for all covariates.
Figure 6
Figure 6
Change of performance in the M3 task. Lower scores indicate a better performance. Each symbol represents a person according to their change from T1 to T2 (x-axis) and T2 to T3 (y-axis). The overall change of the person from T1 to T3 is indicated by different shapes (▴ = poor performance; ■ = stable performance; ○ = improved performance). All symbols right from the vertical grey bar indicate a decrease in performance from T1 to T2. All symbols above the horizontal grey bar represent a poorer performance from T2 to T3. Giving an example, the lowest dot on the right side indicates a decrease in performance from T1 to T2. In contrast, from T2 to T3 there was an increase in performance. In total, the subject improved from T1 to T3 and therefore, it was labeled by a dot. Furthermore, the highest square which you can find is on the left side of the vertical grey bar. This means that it increased from T1 to T2. From T2 to T3 performance decreased, as the square is above the horizontal grey bar. In total, this subject remained stable and therefore, it was labeled by a square.
Figure 7
Figure 7
Change of performance in the delayed recall task. Lower scores indicate a better performance. Each symbol represents a person according to their change from T1 to T2 (x-axis) and T2 to T3 (y-axis). The overall change of the person from T1 to T3 is indicated by different shapes (▴ = poor performance; ■ = stable performance; ○ = improved performance).
Figure 8
Figure 8
Change of performance in the Flanker task. Lower scores indicate a better performance. Each symbol represents a person according to their change from T1 to T2 (x-axis) and T2 to T3 (y-axis). The overall change of the person from T1 to 3 is indicated by different shapes (▴ = poor performance; ■ = stable performance; ○ = improved performance).
Figure 9
Figure 9
Change of performance in the OSPAN task. Lower scores indicate a better performance. Each symbol represents a person according to their change from T1 to T2 (x-axis) and T2 to T3 (y-axis). The overall change of the person from T1 to 3 is indicated by different shapes (▴ = poor performance; ■ = stable performance; ○ = improved performance).

Similar articles

Cited by

References

    1. Michel J-P, Sadana R. “Healthy aging” concepts and measures. J Am Med Dir Assoc. (2017) 18:460–4. 10.1016/j.jamda.2017.03.008 - DOI - PubMed
    1. Rowe JW, Kahn RL. Successful Aging. Gerontologist. (1997) 37:433–40. 10.1093/geront/37.4.433 - DOI - PubMed
    1. WHO. World FAILING to Address Dementia Challenge. (2021). Available online at: https://www.who.int/news/item/02-09-2021-world-failing-to-address-dement... (accessed July 19, 2022).
    1. Tisher A, Salardini A. A comprehensive update on treatment of dementia. Semin Neurol. (2019) 02:167–78. 10.1055/s-0039-1683408 - DOI - PubMed
    1. Livingston G, Huntley J, Sommerlad A, Ames D, Ballard C, Banerjee S, et al. . Dementia prevention, intervention, and care: 2020 report of the Lancet Commission. Lancet. (2020) 396:413–46. 10.1016/S0140-6736(20)30367-6 - DOI - PMC - PubMed