Immune-associated pivotal biomarkers identification and competing endogenous RNA network construction in post-operative atrial fibrillation by comprehensive bioinformatics and machine learning strategies
- PMID: 36341343
- PMCID: PMC9630466
- DOI: 10.3389/fimmu.2022.974935
Immune-associated pivotal biomarkers identification and competing endogenous RNA network construction in post-operative atrial fibrillation by comprehensive bioinformatics and machine learning strategies
Abstract
Background: Atrial fibrillation (AF) is the most common arrhythmia. Previous studies mainly focused on identifying potential diagnostic biomarkers and treatment strategies for AF, while few studies concentrated on post-operative AF (POAF), particularly using bioinformatics analysis and machine learning algorithms. Therefore, our study aimed to identify immune-associated genes and provide the competing endogenous RNA (ceRNA) network for POAF.
Methods: Three GSE datasets were downloaded from the GEO database, and we used a variety of bioinformatics strategies and machine learning algorithms to discover candidate hub genes. These techniques included identifying differentially expressed genes (DEGs) and circRNAs (DECs), building protein-protein interaction networks, selecting common genes, and filtering candidate hub genes via three machine learning algorithms. To assess the diagnostic value, we then created the nomogram and receiver operating curve (ROC). MiRNAs targeting DEGs and DECs were predicted using five tools and the competing endogenous RNA (ceRNA) network was built. Moreover, we performed the immune cell infiltration analysis to better elucidate the regulation of immune cells in POAF.
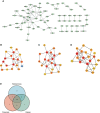
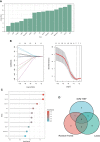
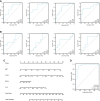
Results: We identified 234 DEGs (82 up-regulated and 152 down-regulated) of POAF via Limma, 75 node genes were visualized via PPI network, which were mainly enriched in immune regulation. 15 common genes were selected using three CytoHubba algorithms. Following machine learning selection, the nomogram was created based on the four candidate hub genes. The area under curve (AUC) of the nomogram and individual gene were all over 0.75, showing the ideal diagnostic value. The dysregulation of macrophages may be critical in POAF pathogenesis. A novel circ_0007738 was discovered in POAF and the ceRNA network was eventually built.
Conclusion: We identified four immune-associated candidate hub genes (C1QA, C1R, MET, and SDC4) for POAF diagnosis through the creation of a nomogram and evaluation of its diagnostic value. The modulation of macrophages and the ceRNA network may represent further therapy methods.
Keywords: bioinformatics analysis; competing endogenous RNA network; diagnosis; immune and inflammation; machine learning; post-operative atrial fibrillation.
Copyright © 2022 Zhou, Wu, Ni, Hong, Xiao, Liu and Yu.
Conflict of interest statement
The authors declare that the research was conducted in the absence of any commercial or financial relationships that could be construed as a potential conflict of interest.
Figures


Similar articles
-
Immune-associated biomarkers identification for diagnosing carotid plaque progression with uremia through systematical bioinformatics and machine learning analysis.Eur J Med Res. 2023 Feb 23;28(1):92. doi: 10.1186/s40001-023-01043-4. Eur J Med Res. 2023. PMID: 36823662 Free PMC article.
-
Identification of Immune-Associated Genes in Diagnosing Aortic Valve Calcification With Metabolic Syndrome by Integrated Bioinformatics Analysis and Machine Learning.Front Immunol. 2022 Jul 4;13:937886. doi: 10.3389/fimmu.2022.937886. eCollection 2022. Front Immunol. 2022. PMID: 35865542 Free PMC article.
-
Analysis of infiltrated immune cells in left atriums from patients with atrial fibrillation and identification of circRNA biomarkers for postoperative atrial fibrillation.Front Genet. 2022 Dec 9;13:1003366. doi: 10.3389/fgene.2022.1003366. eCollection 2022. Front Genet. 2022. PMID: 36568366 Free PMC article.
-
Identification of biomarkers associated with pediatric asthma using machine learning algorithms: A review.Medicine (Baltimore). 2023 Nov 24;102(47):e36070. doi: 10.1097/MD.0000000000036070. Medicine (Baltimore). 2023. PMID: 38013370 Free PMC article. Review.
-
Peripheral blood MicroRNAs as biomarkers of schizophrenia: expectations from a meta-analysis that combines deep learning methods.World J Biol Psychiatry. 2024 Jan-Feb;25(1):65-81. doi: 10.1080/15622975.2023.2258975. Epub 2023 Sep 13. World J Biol Psychiatry. 2024. PMID: 37703215 Review.
Cited by
-
APOC1 exacerbates renal fibrosis through the activation of the NF-κB signaling pathway in IgAN.Front Pharmacol. 2023 May 25;14:1181435. doi: 10.3389/fphar.2023.1181435. eCollection 2023. Front Pharmacol. 2023. PMID: 37305534 Free PMC article.
-
Machine learning in the prediction and detection of new-onset atrial fibrillation in ICU: a systematic review.J Anesth. 2024 Jun;38(3):301-308. doi: 10.1007/s00540-024-03316-6. Epub 2024 Apr 9. J Anesth. 2024. PMID: 38594589 Free PMC article.
-
Gene modules and genes associated with postoperative atrial fibrillation: weighted gene co-expression network analysis and circRNA-miRNA-mRNA regulatory network analysis.J Thorac Dis. 2023 Sep 28;15(9):4949-4960. doi: 10.21037/jtd-23-1179. Epub 2023 Sep 26. J Thorac Dis. 2023. PMID: 37868904 Free PMC article.
References
MeSH terms
Substances
LinkOut - more resources
Full Text Sources
Medical
Miscellaneous

