

Integrated time-series transcriptomic and metabolomic analyses reveal different inflammatory and adaptive immune responses contributing to host resistance to PRRSV
- PMID: 36341362
- PMCID: PMC9631489
- DOI: 10.3389/fimmu.2022.960709
Integrated time-series transcriptomic and metabolomic analyses reveal different inflammatory and adaptive immune responses contributing to host resistance to PRRSV
Abstract
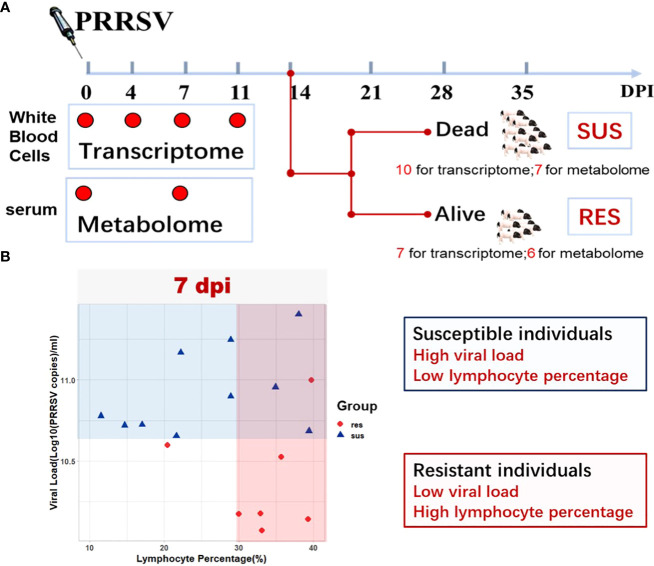
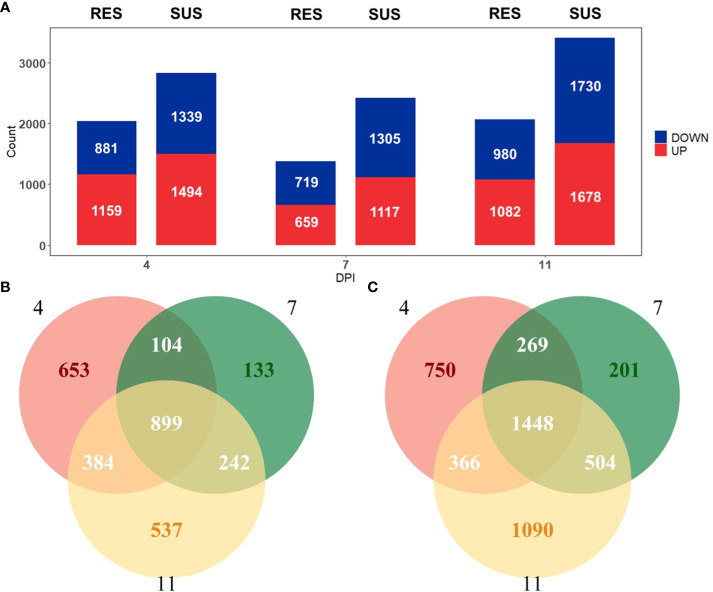
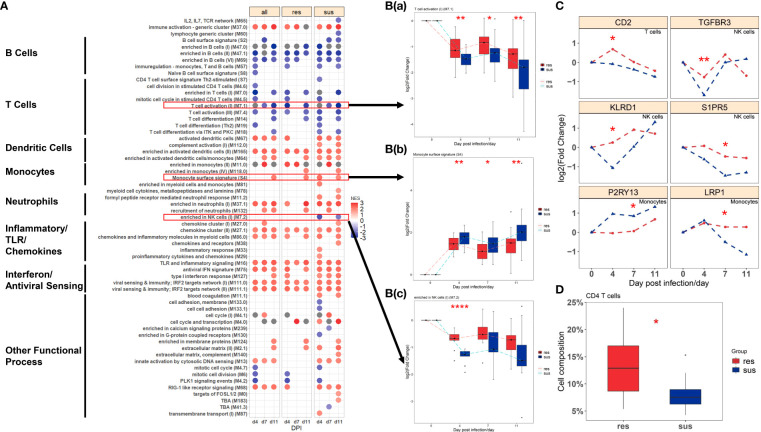
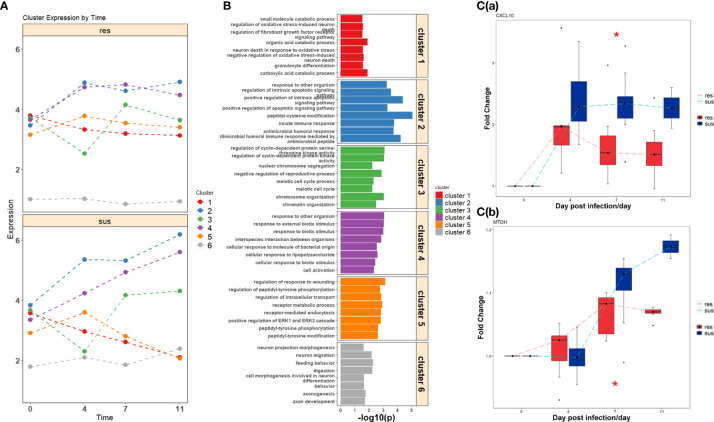
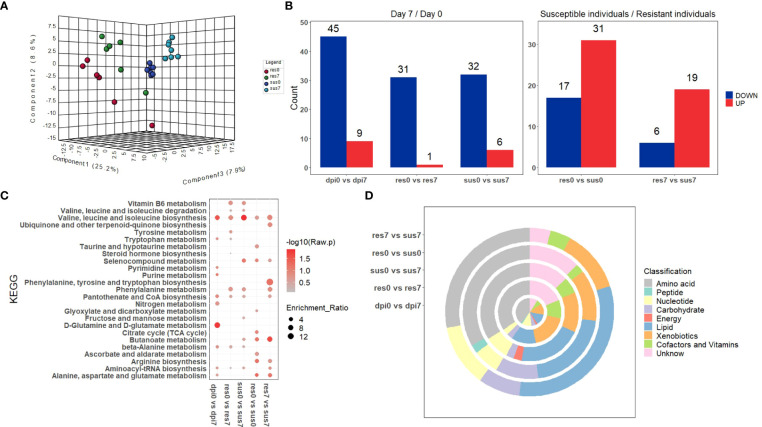
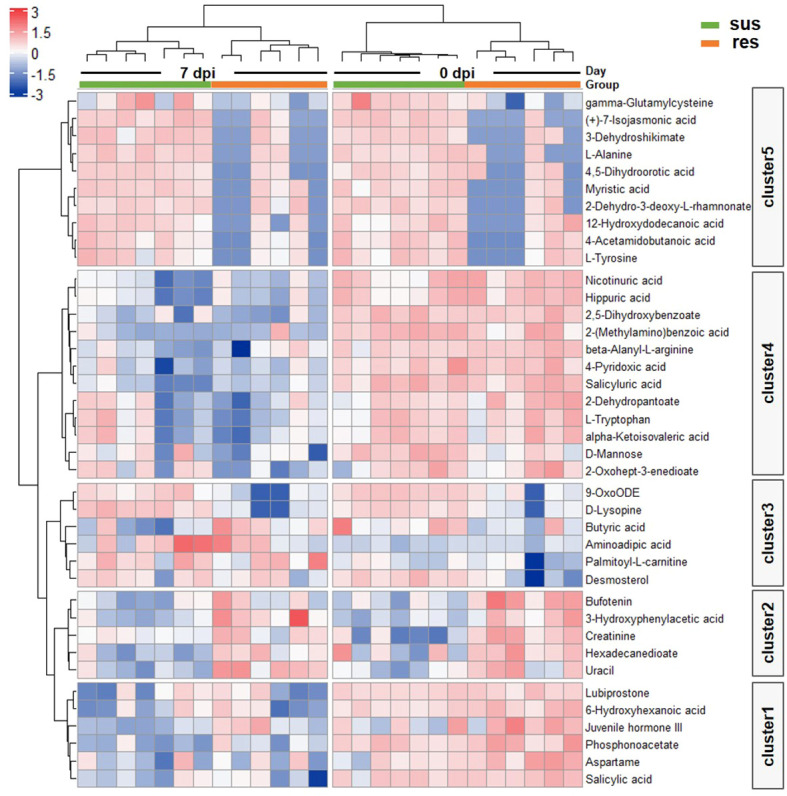
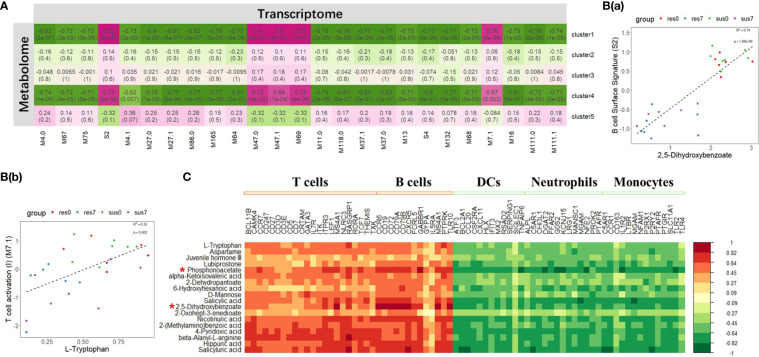
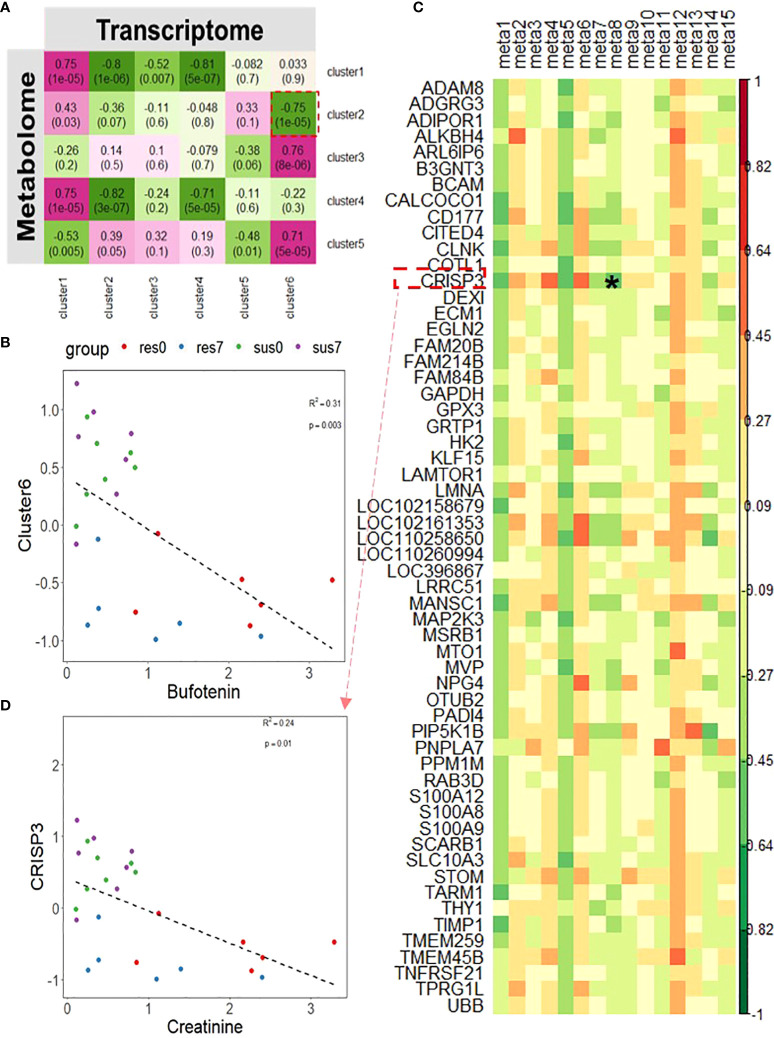
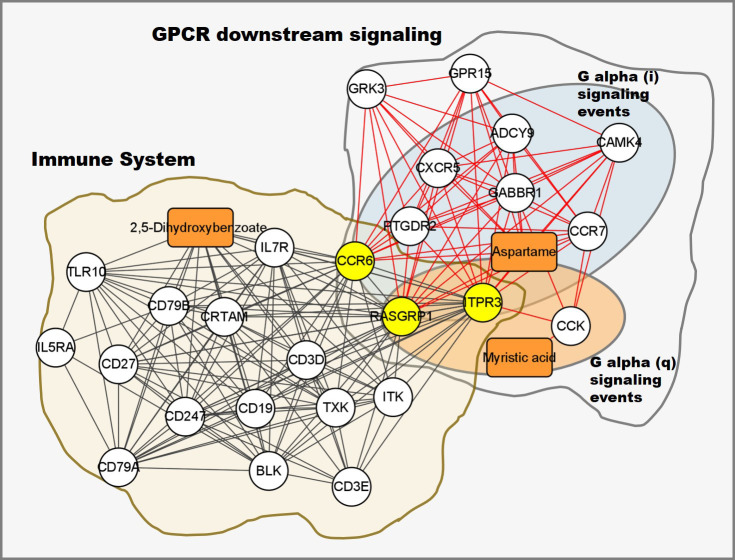
Porcine reproductive and respiratory syndrome virus (PRRSV) is a highly contagious disease that affects the global pig industry. To understand mechanisms of susceptibility/resistance to PRRSV, this study profiled the time-serial white blood cells transcriptomic and serum metabolomic responses to PRRSV in piglets from a crossbred population of PRRSV-resistant Tongcheng pigs and PRRSV-susceptible Large White pigs. Gene set enrichment analysis (GSEA) illustrated that PRRSV infection up-regulated the expression levels of marker genes of dendritic cells, monocytes and neutrophils and inflammatory response, but down-regulated T cells, B cells and NK cells markers. CIBERSORT analysis confirmed the higher T cells proportion in resistant pigs during PRRSV infection. Resistant pigs showed a significantly higher level of T cell activation and lower expression levels of monocyte surface signatures post infection than susceptible pigs, corresponding to more severe suppression of T cell immunity and inflammatory response in susceptible pigs. Differentially expressed genes between resistant/susceptible pigs during the course of infection were significantly enriched in oxidative stress, innate immunity and humoral immunity, cell cycle, biotic stimulated cellular response, wounding response and behavior related pathways. Fourteen of these genes were distributed in 5 different QTL regions associated with PRRSV-related traits. Chemokine CXCL10 levels post PRRSV infection were differentially expressed between resistant pigs and susceptible pigs and can be a promising marker for susceptibility/resistance to PRRSV. Furthermore, the metabolomics dataset indicated differences in amino acid pathways and lipid metabolism between pre-infection/post-infection and resistant/susceptible pigs. The majority of metabolites levels were also down-regulated after PRRSV infection and were significantly positively correlated to the expression levels of marker genes in adaptive immune response. The integration of transcriptome and metabolome revealed concerted molecular events triggered by the infection, notably involving inflammatory response, adaptive immunity and G protein-coupled receptor downstream signaling. This study has increased our knowledge of the immune response differences induced by PRRSV infection and susceptibility differences at the transcriptomic and metabolomic levels, providing the basis for the PRRSV resistance mechanism and effective PRRS control.
Keywords: PRRSV; Tongcheng pigs; adaptive immunity; disease resistance; inflammatory response; metabolome; transcriptome.
Copyright © 2022 Wu, Han, Wu, Wang, Su, Shen, Guan, Michal, Jiang, Liu and Zhou.
Conflict of interest statement
The authors declare that the research was conducted in the absence of any commercial or financial relationships that could be construed as a potential conflict of interest.
Figures
Similar articles
-
Transcriptome Differences in Porcine Alveolar Macrophages from Tongcheng and Large White Pigs in Response to Highly Pathogenic Porcine Reproductive and Respiratory Syndrome Virus (PRRSV) Infection.Int J Mol Sci. 2017 Jul 12;18(7):1475. doi: 10.3390/ijms18071475. Int J Mol Sci. 2017. PMID: 28704922 Free PMC article.
-
Identification of Differentially Expressed Non-coding RNA in Porcine Alveolar Macrophages from Tongcheng and Large White Pigs Responded to PRRSV.Sci Rep. 2018 Oct 23;8(1):15621. doi: 10.1038/s41598-018-33891-0. Sci Rep. 2018. PMID: 30353051 Free PMC article.
-
Pig immune response to general stimulus and to porcine reproductive and respiratory syndrome virus infection: a meta-analysis approach.BMC Genomics. 2013 Apr 3;14:220. doi: 10.1186/1471-2164-14-220. BMC Genomics. 2013. PMID: 23552196 Free PMC article.
-
Role of genetic factors in different swine breeds exhibiting varying levels of resistance/susceptibility to PRRSV.Virus Res. 2023 Mar;326:199057. doi: 10.1016/j.virusres.2023.199057. Epub 2023 Feb 3. Virus Res. 2023. PMID: 36731630 Free PMC article. Review.
-
Innate and adaptive immunity against Porcine Reproductive and Respiratory Syndrome Virus.Vet Immunol Immunopathol. 2015 Sep 15;167(1-2):1-14. doi: 10.1016/j.vetimm.2015.07.003. Epub 2015 Jul 17. Vet Immunol Immunopathol. 2015. PMID: 26209116 Free PMC article. Review.
Cited by
-
Cell deconvolution-based integrated time-series network of whole blood transcriptome reveals systemic antiviral activities and cell-specific immunological changes against PRRSV infection.Vet Res. 2025 Jan 22;56(1):19. doi: 10.1186/s13567-025-01451-w. Vet Res. 2025. PMID: 39844283 Free PMC article.
-
Genetic background influences pig responses to porcine reproductive and respiratory syndrome virus.Front Vet Sci. 2023 Oct 20;10:1289570. doi: 10.3389/fvets.2023.1289570. eCollection 2023. Front Vet Sci. 2023. PMID: 37929286 Free PMC article. Review.
-
Early Highly Pathogenic Porcine Reproductive and Respiratory Syndrome Virus Infection Induces Necroptosis in Immune Cells of Peripheral Lymphoid Organs.Viruses. 2025 Feb 20;17(3):290. doi: 10.3390/v17030290. Viruses. 2025. PMID: 40143222 Free PMC article.
-
Integrative transcriptomic profiling of mRNA, miRNA, circRNA, and lncRNA in alveolar macrophages isolated from PRRSV-infected porcine.Front Immunol. 2023 Aug 24;14:1258778. doi: 10.3389/fimmu.2023.1258778. eCollection 2023. Front Immunol. 2023. PMID: 37691924 Free PMC article.
-
RNA-Seq Analysis of Peripheral Whole Blood from Dairy Bulls with High and Low Antibody-Mediated Immune Responses-A Preliminary Study.Animals (Basel). 2023 Jul 5;13(13):2208. doi: 10.3390/ani13132208. Animals (Basel). 2023. PMID: 37444006 Free PMC article.
References
-
- Dwivedi V, Manickam C, Patterson R, Dodson K, Weeman M, Renukaradhya GJ. Intranasal delivery of whole cell lysate of mycobacterium tuberculosis induces protective immune responses to a modified live porcine reproductive and respiratory syndrome virus vaccine in pigs. Vaccine (2011) 29(23):4067–76. doi: 10.1016/j.vaccine.2011.03.005 - DOI - PMC - PubMed
Publication types
MeSH terms
LinkOut - more resources
Full Text Sources