. 2022 Oct 20:13:994259.
doi: 10.3389/fimmu.2022.994259. eCollection 2022.

Identification and validation of a tyrosine metabolism-related prognostic prediction model and characterization of the tumor microenvironment infiltration in hepatocellular carcinoma

Affiliations

Identification and validation of a tyrosine metabolism-related prognostic prediction model and characterization of the tumor microenvironment infiltration in hepatocellular carcinoma

Yangying Zhou et al. Front Immunol. .

Abstract

Background: Hepatocellular carcinoma (HCC) is an aggressive and heterogeneous disease characterized by high morbidity and mortality. The liver is the vital organ that participates in tyrosine catabolism, and abnormal tyrosine metabolism could cause various diseases, including HCC. Besides, the tumor immune microenvironment is involved in carcinogenesis and can influence the patients' clinical outcomes. However, the potential role of tyrosine metabolism pattern and immune molecular signature is poorly understood in HCC.

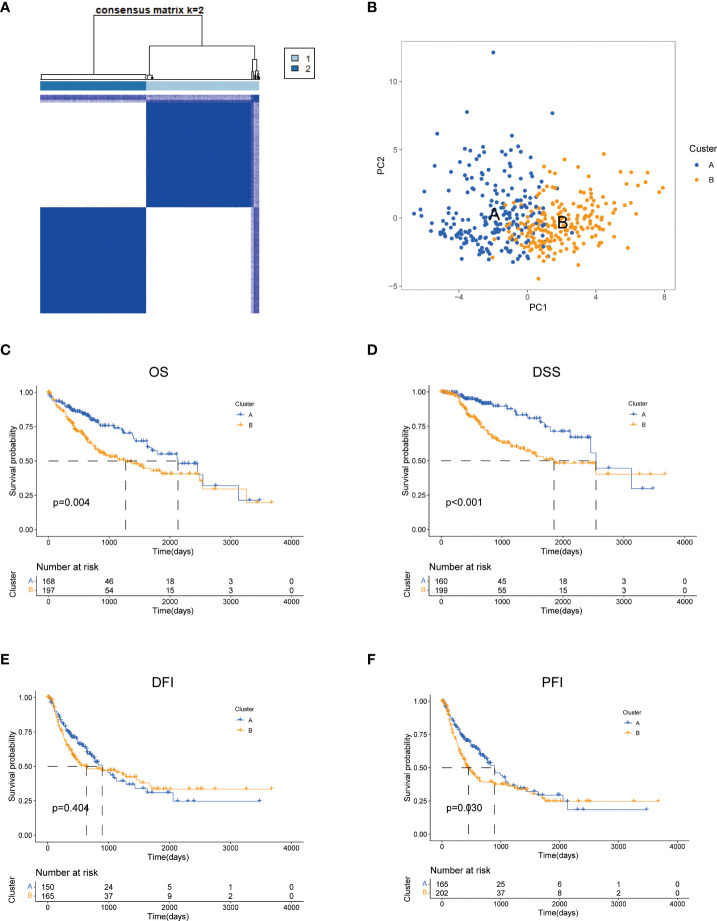
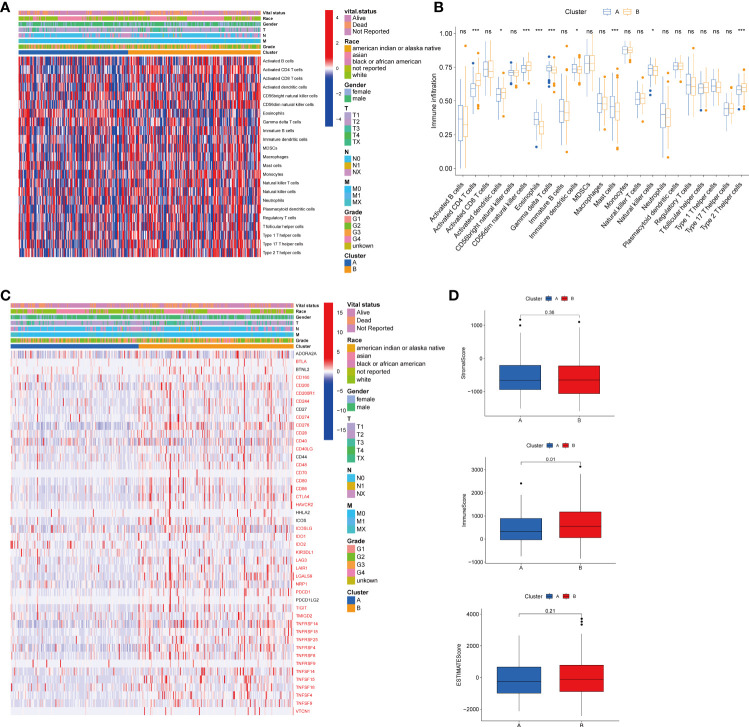
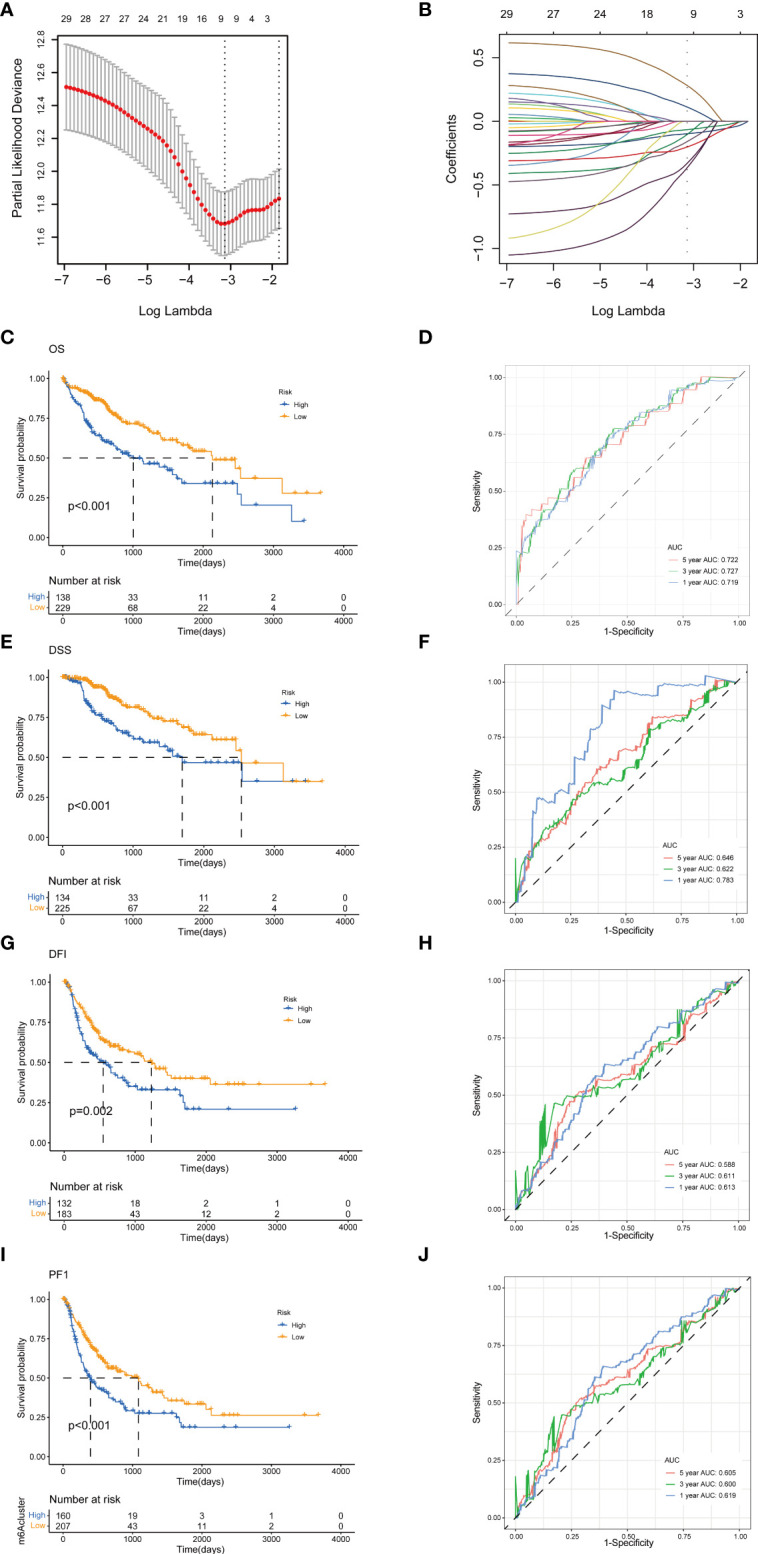
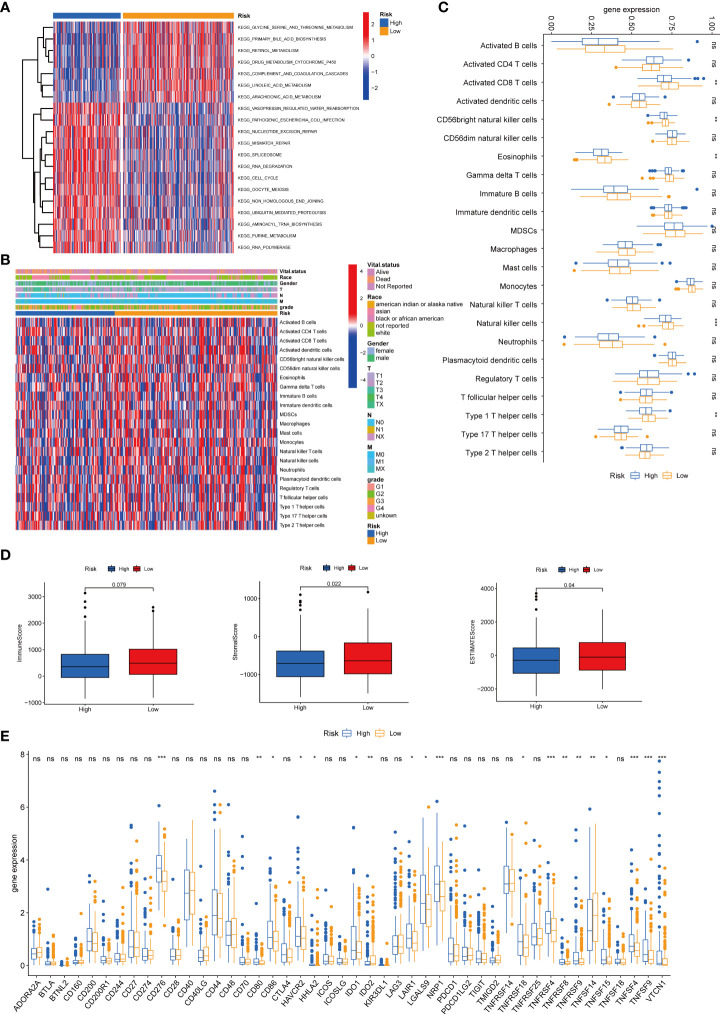
Methods: Gene expression, somatic mutations, copy number variation data, and clinicopathological information of HCC were downloaded from The Cancer Genome Atlas (TCGA) database. GSE14520 from the Gene Expression Omnibus (GEO) databases was used as a validation dataset. We performed unsupervised consensus clustering of tyrosine metabolism-related genes (TRGs) and classified patients into distinct molecular subtypes. We used ESTIMATE algorithms to evaluate the immune infiltration. We then applied LASSO Cox regression to establish the TRGs risk model and validated its predictive performance.

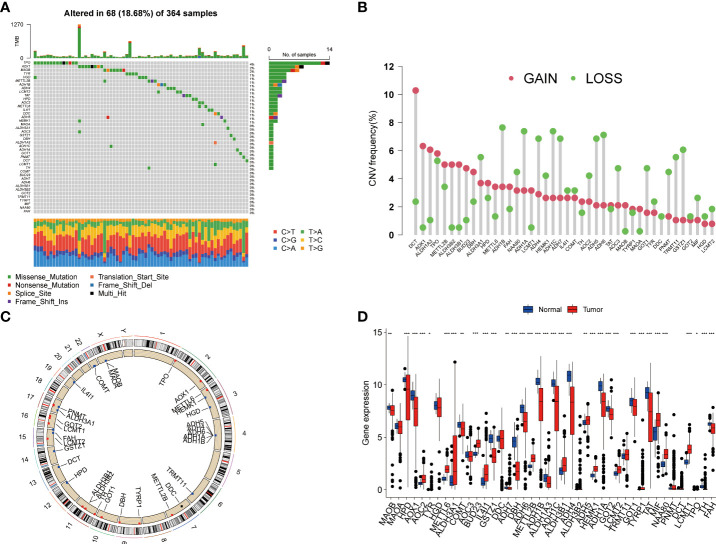
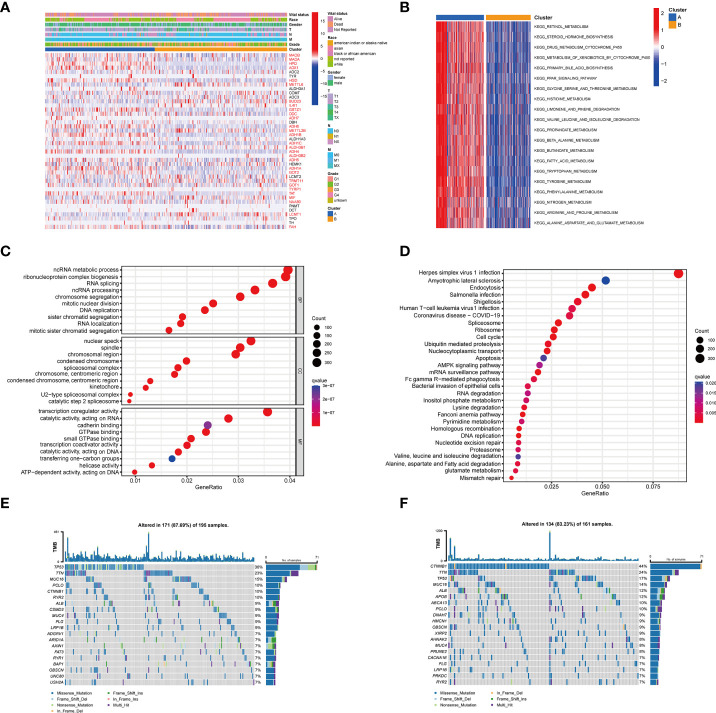
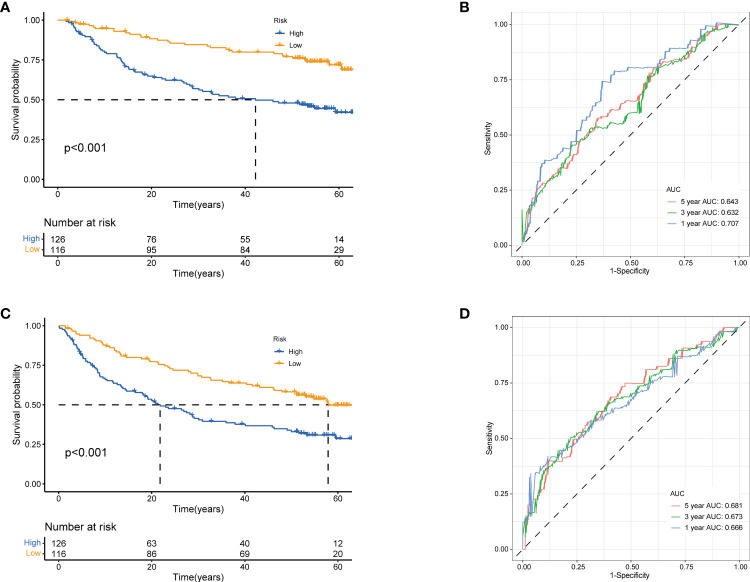
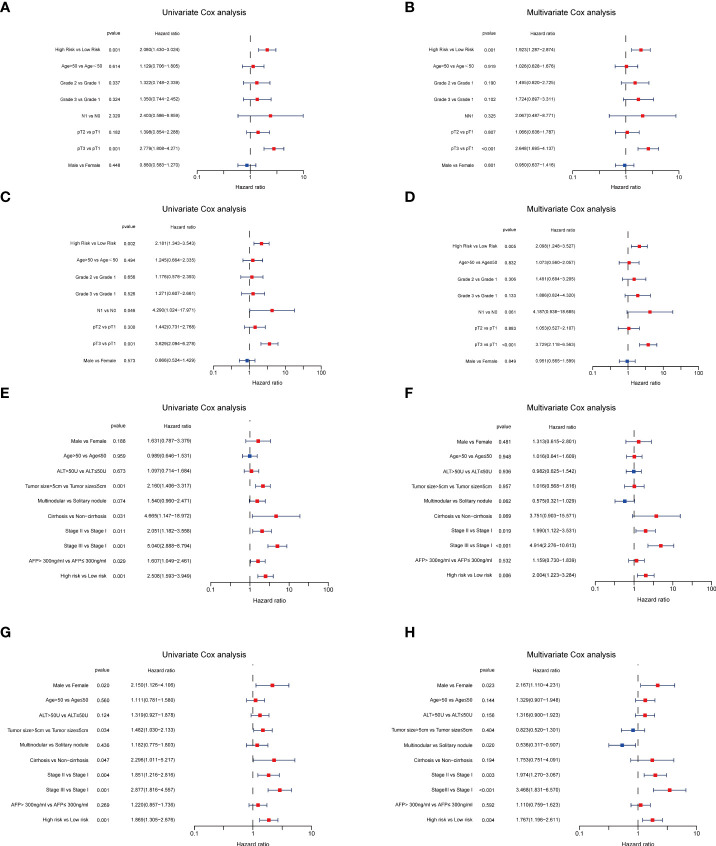
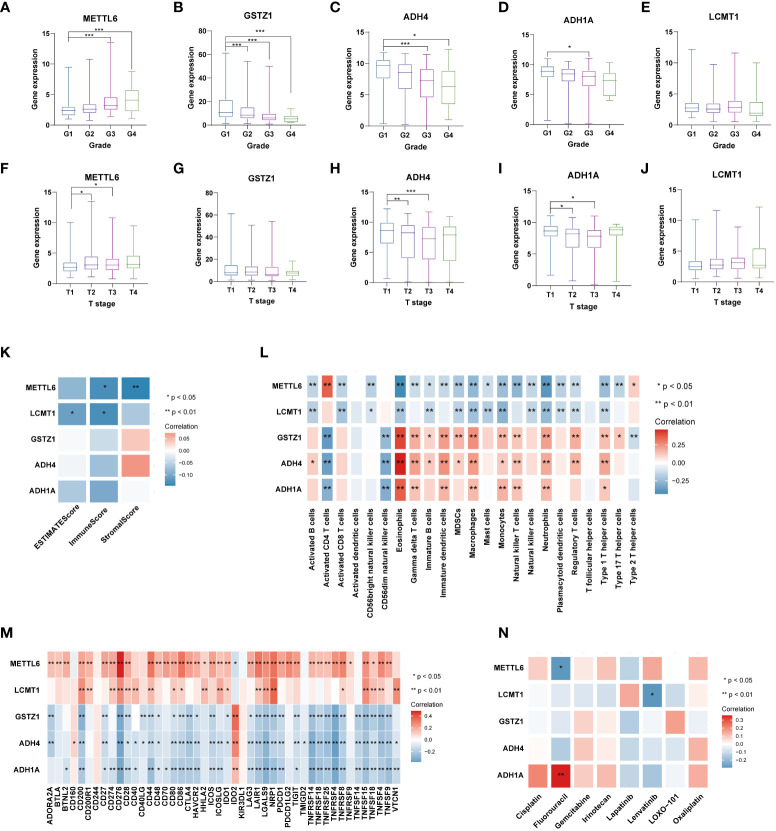
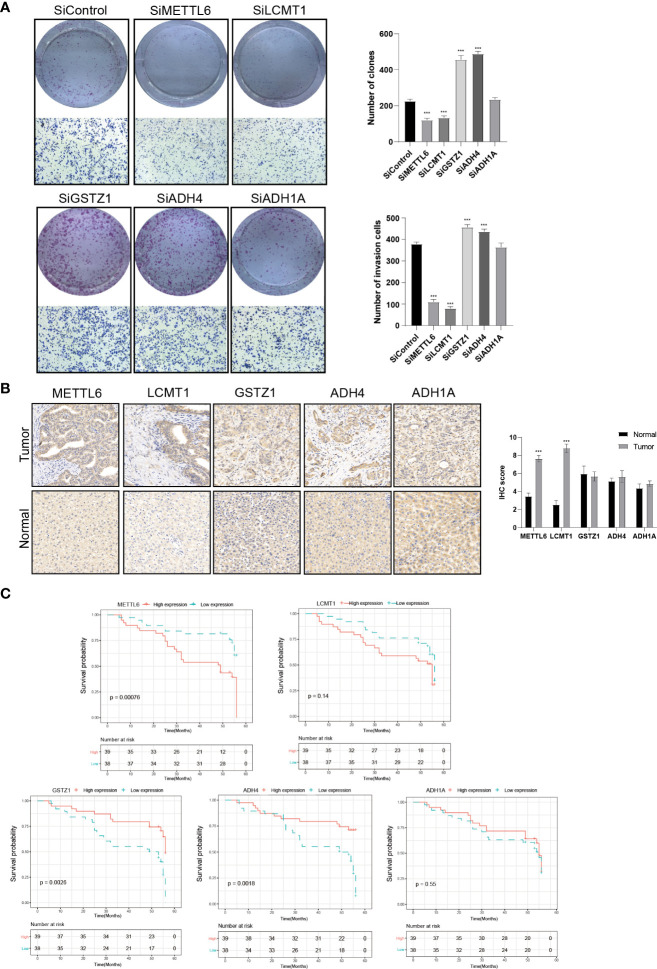
Results: In this study, we first described the alterations of 42 TRGs in HCC cohorts and characterized the clinicopathological characteristics and tumor microenvironmental landscape of the two distinct subtypes. We then established a tyrosine metabolism-related scoring system and identified five TRGs, which were highly correlated with prognosis and representative of this gene set, namely METTL6, GSTZ1, ADH4, ADH1A, and LCMT1. Patients in the high-risk group had an inferior prognosis. Univariate and multivariate Cox proportional hazards regression analysis also showed that the tyrosine metabolism-related signature was an independent prognostic indicator. Besides, receiver operating characteristic curve (ROC) analysis demonstrated the predictive accuracy of the TRGs signature that could reliably predict 1-, 3-, and 5-year survival in both TCGA and GEO cohorts. We also got consistent results by performing clone formation and invasion analysis, and immunohistochemical (IHC) assays. Moreover, we also discovered that the TRGs signature was significantly associated with the different immune landscapes and therapeutic drug sensitivity.

Conclusion: Our comprehensive analysis revealed the potential molecular signature and clinical utilities of TRGs in HCC. The model based on five TRGs can accurately predict the survival outcomes of HCC, improving our knowledge of TRGs in HCC and paving a new path for guiding risk stratification and treatment strategy development for HCC patients.

Keywords: hepatocellular carcinoma; immunotherapy; prognosis model; tumor microenvironment; tyrosine metabolism.


Conflict of interest statement

The authors declare that the research was conducted in the absence of any commercial or financial relationships that could be construed as a potential conflict of interest.

Figures

Figure 1
Figure 1
Genetic variations and transcriptional expression of TRGs in HCC. (A) The distribution and mutation frequencies of 42 TRGs in the TCGA HCC cohort. (B) Frequencies of CNV alterations of TRGs in HCC. The height of the column represents the alteration frequency. (C) Locations of CNV alterations in TRGs on chromosomes. (D) Expression distributions of 44 TRGs between HCC tumor and normal tissues. *p < 0.05, **p < 0.01, ***p < 0.001. TRGs, tyrosine metabolism-related genes; HCC, hepatocellular carcinoma; TCGA, The Cancer Genome Atlas; CNV, copynumber variation.
Figure 2
Figure 2
Characteristics of two TRGs subtypes divided by consistent clustering. (A) Consensus heatmap matrix and correlations areas of two clusters (k = 2). (B) PCA analysis demonstrates a distinctive difference between the two clusters. Univariate analysis shows 44 TRGs related to the OS (C), the DSS (D), the DFI (E), and the PFI (F). OS, overall survival; DSS, disease-specific survival; DFI, disease-free interval; DFI, progression-free interval.
Figure 3
Figure 3
Clinicopathological features, enrichment analysis and mutation landscape of two TRGs clusters. (A) Differences in clinicopathologic characteristics and expression levels of TRGs between the two subtypes. (B) GSVA of biological pathways between two subtypes, in which blue inhibited and red represent activated pathways, respectively. (C) GO enrichment analysis shows the BP, CC, and MF of two TRGs subtypes. (D) The bubble plot depicted the KEGG pathway enrichment analysis of the two clusters. (E) Mutation landscape of TRGs cluster (A–F) Mutation landscape of TRGs cluster (B) GSVA, gene set variation analysis; GO, gene ontology; BP, biological process; CC, cellular component; MF, molecular function; KEGG, Kyoto Encyclopedia of Genes and Genomes; TRGs, tyrosine metabolism-related genes.
Figure 4
Figure 4
Correlations of tumor immune cell microenvironments and two HCC subtypes. (A) Heatmap of the tumor-infiltrating cells and clinical features in two HCC subtypes. (B) Expression abundance of 23 infiltrating immune cell types in the two HCC subtypes. (C) Immune checkpoints heatmap between the two subtypes, the red mark representing the checkpoints that are differentially expressed, with p < 0.05. (D) Correlations between the TME score and the two HCC subtypes. HCC, hepatocellular carcinoma; TME, tumor microenvironment. *p < 0.05, ***p < 0.001, ns, no significant difference.
Figure 5
Figure 5
Construction of tyrosine metabolism-related genes prognostic model in the training set. (A) Ten-time cross-validation for tuning parameter selection by LASSO regression. (B) The screening of coefficients under LASSO analysis. A vertical line is drawn at the value chosen by 10‐fold cross‐validation of overall survival. Kaplan-Meier curves for survival outcomes of the two risk subtypes according to the OS (C), DSS (E), DFI (G), and PFI (I) (log-rank tests, p< 0.01). ROC curves to predict the sensitivity and specificity of 1-, 3-, and 5-year survival rates according to the risk score based on the OS (D), DSS (F), DFI (H), and PFI (J). LASSO, least absolute shrinkage and selection operator; OS, overall survival; DSS, disease-specific survival; DFI, disease-free interval; PFI, progression-free interval; ROC, receiver operating characteristic.
Figure 6
Figure 6
Validation of prognostic model based on TRGs. Kaplan-Meier survival curves of high- and low-risk groups in validation dataset GSE14520 (A), OS. (C), RFS (log-rank tests, p<.001). The receiver operating characteristic curve for predicting 1-year, 3-year, and 5-year OS (B) and RFS (D) of HCC patients in GSE14520. TRGs, tyrosine metabolism-related genes; HCC, hepatocellular carcinoma; RFS, relapse-free survival.
Figure 7
Figure 7
Independent prognosis analyses of TRGs risk model in TCGA and GES14520 HCC cohorts. (A, B), Univariate and Multivariate Cox regression of risk score based on OS in TCGA HCC cohort. (C, D), Univariate and Multivariate Cox regression of risk score based on DSS in TCGA HCC cohort. (E, F), Univariate and Multivariate Cox regression of risk score based on OS in GSE14520 HCC cohort. (G, H), Univariate and Multivariate Cox regression of risk score based on RFS in GSE14520 HCC cohort. TRGs, tyrosine metabolism-related genes; HCC, hepatocellular carcinoma; TCGA, The Cancer Genome Atlas; OS, overall survival; DSS, disease-specific survival; RFS, relapse-free survival.
Figure 8
Figure 8
Correlations of tumor immune cell microenvironments and two TRGs prognostic subtypes. (A) GSVA of biological pathways between two risk groups, in which red represent activated and blue inhibited pathways, respectively. (B) Heatmap of the clinicopathologic characteristics and tumor-infiltrating cells in the two risk groups. (C) Expression abundance of 23 infiltrating immune cell types in the two risk subtypes. (D) Correlations between the TME score and the two risk subtypes. (E) Expression of immune checkpoints between the two risk subtypes. *p < 0.05, **p < 0.01, ***p < 0.001, ns, no significant difference. TRGs, tyrosine metabolism-related genes; GSVA, gene set variation analysis; TME, tumor microenvironment.
Figure 9
Figure 9
Analysis of five TRGs for the prognostic signature, and their correlations of tumor immune infiltrating cells and therapeutic drugs. The boxplot showing the relationship of METTL6 (A), GSTZ1 (B), ADH4 (C), ADH1A (D), and LCMT1 (E) expression and grade stratification. The boxplot depicting the correlation of METTL6 (F), GSTZ1 (G), ADH4 (H), ADH1A (I), and LCMT1 (J) expression and T stage. (K) The correlation of five TRGs and TME score. (L) The relationship between five TRGs and 23 activated immune cells. (M) The correlation of five TRGs and immune checkpoints. (N) The relationship between five TRGs and common therapeutic drugs for HCC. *p<0.05, **p< 0.01, ***p < 0.001. TRGs, tyrosine metabolism-related genes; TME, tumor microenvironment.
Figure 10
Figure 10
Validation of the Five prognostic TRGs by functional analysis. (A) Clone formation and invasion analysis of Hep3B cells depleted with the five TRGs. (B) IHC analysis of the five TRGs in the Xiangya HCC cohort (n = 97), including normal liver tissue (n = 20) and HCC tumor tissues (n = 77). (C) Kaplan-Meier curve analysis of the five TRGs in HCC patients. Patients were divided into high- and low-expression groups based on the median expression of each gene. TRGs, tyrosine metabolism-related genes; HCC, hepatocellular carcinoma; IHC, immunohistochemistry. ***p < 0.001.

Similar articles

Cited by

References

    1. Siegel RL, Miller KD, Fuchs HE, Jemal A. Cancer statistics, 2022. CA: Cancer J Clin (2022) 72(1):7–33. doi: 10.3322/caac.21708 - DOI - PubMed
    1. Sung H, Ferlay J, Siegel RL, Laversanne M, Soerjomataram I, Jemal A, et al. . Global cancer statistics 2020: GLOBOCAN estimates of incidence and mortality worldwide for 36 cancers in 185 countries. CA: Cancer J Clin (2021) 71(3):209–49. doi: 10.3322/caac.21660 - DOI - PubMed
    1. Jiang Y, Sun A, Zhao Y, Ying W, Sun H, Yang X, et al. . Proteomics identifies new therapeutic targets of early-stage hepatocellular carcinoma. Nature (2019) 567(7747):257–61. doi: 10.1038/s41586-019-0987-8 - DOI - PubMed
    1. Forner A, Reig M, Bruix J. Hepatocellular carcinoma. Lancet (London England) (2018) 391(10127):1301–14. doi: 10.1016/S0140-6736(18)30010-2 - DOI - PubMed
    1. Krishnan MS, Rajan Kd A, Park J, Arjunan V, Garcia Marques FJ, Bermudez A, et al. . Genomic analysis of vascular invasion in HCC reveals molecular drivers and predictive biomarkers. Hepatol (Baltimore Md) (2021) 73(6):2342–60. doi: 10.1002/hep.31614 - DOI - PMC - PubMed

Publication types