

Common molecular mechanism and immune infiltration patterns of thoracic and abdominal aortic aneurysms
- PMID: 36341412
- PMCID: PMC9633949
- DOI: 10.3389/fimmu.2022.1030976
Common molecular mechanism and immune infiltration patterns of thoracic and abdominal aortic aneurysms
Abstract
Background: Aortic disease (aortic aneurysm (AA), dissection (AD)) is a serious threat to patient lives. Little is currently known about the molecular mechanisms and immune infiltration patterns underlying the development and progression of thoracic and abdominal aortic aneurysms (TAA and AAA), warranting further research.
Methods: We downloaded AA (includes TAA and AAA) datasets from the GEO database. The potential biomarkers in TAA and AAA were identified using differential expression analysis and two machine-learning algorithms. The discrimination power of the potential biomarkers and their diagnostic accuracy was assessed in validation datasets using ROC curve analysis. Then, GSEA, KEGG, GO and DO analyses were conducted. Furthermore, two immuno-infiltration analysis algorithms were utilized to analyze the common immune infiltration patterns in TAA and AAA. Finally, a retrospective clinical study was performed on 78 patients with AD, and the serum from 6 patients was used for whole exome sequencing (WES).
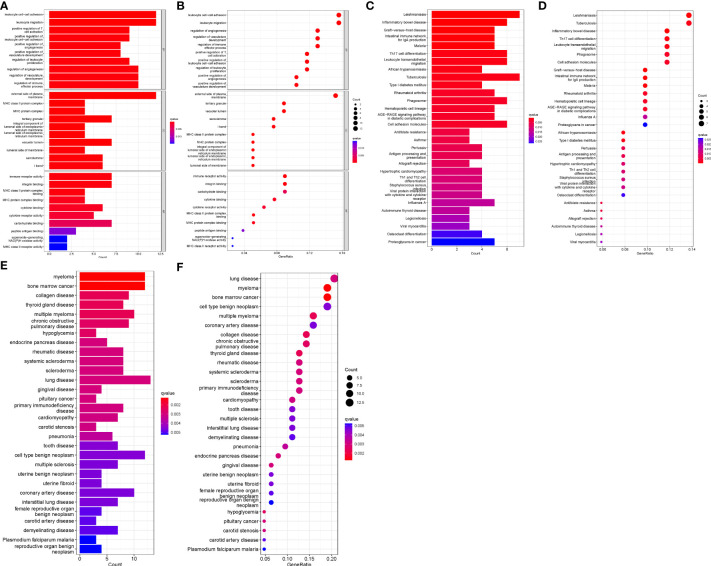
Results: The intersection of TAA and AAA datasets yielded 82 differentially expressed genes (DEGs). Subsequently, the biomarkers (CX3CR1 and HBB) were acquired by screening using two machine-learning algorithms and ROC curve analysis. The functional analysis of DEGs showed significant enrichment in inflammation and regulation of angiogenic pathways. Immune cell infiltration analysis revealed that adaptive and innate immune responses were closely linked to AA progression. However, neither CX3CR1 nor HBB was associated with B cell-mediated humoral immunity. CX3CR1 expression was correlated with macrophages and HBB with eosinophils. Finally, our retrospective clinical study revealed a hyperinflammatory environment in aortic disease. The WES study identified disease biomarkers and gene variants, some of which may be druggable.
Conclusion: The genes CX3CR1 and HBB can be used as common biomarkers in TAA and AAA. Large numbers of innate and adaptive immune cells are infiltrated in AA and are closely linked to the development and progression of AA. Moreover, CX3CR1 and HBB are highly correlated with the infiltration of immune cells and may be potential targets of immunotherapeutic drugs. Gene mutation research is a promising direction for the treatment of aortic disease.
Keywords: aortic aneurysms; biomarkers; immune cell infiltration; machine-learning; whole exome sequencing.
Copyright © 2022 He, Zhan, Cai, Yu, Wei, Quan, Huang, Liu, Li, Liu and Pan.
Conflict of interest statement
The authors declare that the research was conducted in the absence of any commercial or financial relationships that could be construed as a potential conflict of interest.
Figures


Similar articles
-
Construction of the miRNA/Pyroptosis-Related Molecular Regulatory Axis in Abdominal Aortic Aneurysm: Evidence From Transcriptome Data Combined With Multiple Machine Learning Approaches Followed by Experiment Validation.J Immunol Res. 2024 Oct 30;2024:1429510. doi: 10.1155/2024/1429510. eCollection 2024. J Immunol Res. 2024. PMID: 39512836 Free PMC article.
-
A nomoscore of four genes for predicting the rupture risk in abdominal aortic aneurysm patients with osteoarthritis.Gene. 2024 Dec 30;931:148877. doi: 10.1016/j.gene.2024.148877. Epub 2024 Aug 22. Gene. 2024. PMID: 39173977
-
Interleukin 2 receptor subunit beta as a novel hub gene plays a potential role in the immune microenvironment of abdominal aortic aneurysms.Gene. 2022 Jun 15;827:146472. doi: 10.1016/j.gene.2022.146472. Epub 2022 Apr 4. Gene. 2022. PMID: 35381314
-
Comparative Analysis of Circular RNAs Expression and Function between Aortic and Intracranial Aneurysms.Curr Drug Targets. 2024;25(13):866-884. doi: 10.2174/0113894501319306240819052840. Curr Drug Targets. 2024. PMID: 39219419 Free PMC article. Review.
-
Synchronous and Metachronous Thoracic Aortic Aneurysms in Patients With Abdominal Aortic Aneurysms: A Systematic Review and Meta-Analysis.J Am Heart Assoc. 2020 Nov 3;9(21):e017468. doi: 10.1161/JAHA.120.017468. Epub 2020 Oct 26. J Am Heart Assoc. 2020. PMID: 33103575 Free PMC article.
Cited by
-
Cellular, Molecular and Clinical Aspects of Aortic Aneurysm-Vascular Physiology and Pathophysiology.Cells. 2024 Feb 1;13(3):274. doi: 10.3390/cells13030274. Cells. 2024. PMID: 38334666 Free PMC article. Review.
-
Sex-Specific Characteristics of Perivascular Fat in Aortic Aneurysms.J Clin Med. 2025 Apr 29;14(9):3071. doi: 10.3390/jcm14093071. J Clin Med. 2025. PMID: 40364103 Free PMC article. Review.
-
A bibliometric and visualization analysis of global trends and frontiers on macrophages in abdominal aortic aneurysms research.Medicine (Baltimore). 2024 Oct 25;103(43):e40274. doi: 10.1097/MD.0000000000040274. Medicine (Baltimore). 2024. PMID: 39470505 Free PMC article.
-
Innovation in pathogenesis and management of aortic aneurysm.World J Exp Med. 2024 Jun 20;14(2):91408. doi: 10.5493/wjem.v14.i2.91408. eCollection 2024 Jun 20. World J Exp Med. 2024. PMID: 38948412 Free PMC article. Review.
-
Deciphering the causal association and underlying transcriptional mechanisms between telomere length and abdominal aortic aneurysm.Front Immunol. 2024 Aug 21;15:1438838. doi: 10.3389/fimmu.2024.1438838. eCollection 2024. Front Immunol. 2024. PMID: 39234237 Free PMC article.
References
-
- Wanhainen A, Verzini F, Van Herzeele I, Allaire E, Bown M, Cohnert T, et al. . Editor’s choice - European society for vascular surgery (ESVS) 2019 clinical practice guidelines on the management of abdominal aorto-iliac artery aneurysms. Eur J Vasc Endovasc Surg (2019) 57:8–93. doi: 10.1016/j.ejvs.2018.09.020 - DOI - PubMed
Publication types
MeSH terms
Substances
LinkOut - more resources
Full Text Sources