. 2022 Oct 20:13:1038349.
doi: 10.3389/fimmu.2022.1038349. eCollection 2022.

Helicobacter pylori-infected human neutrophils exhibit impaired chemotaxis and a uropod retraction defect

Affiliations

Helicobacter pylori-infected human neutrophils exhibit impaired chemotaxis and a uropod retraction defect

Allan Prichard et al. Front Immunol. .

Abstract

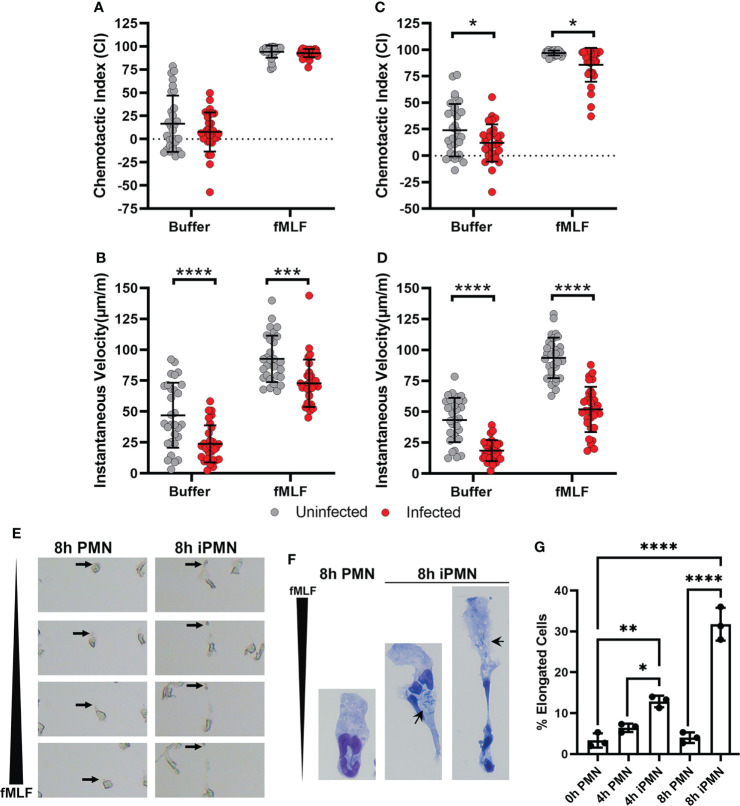
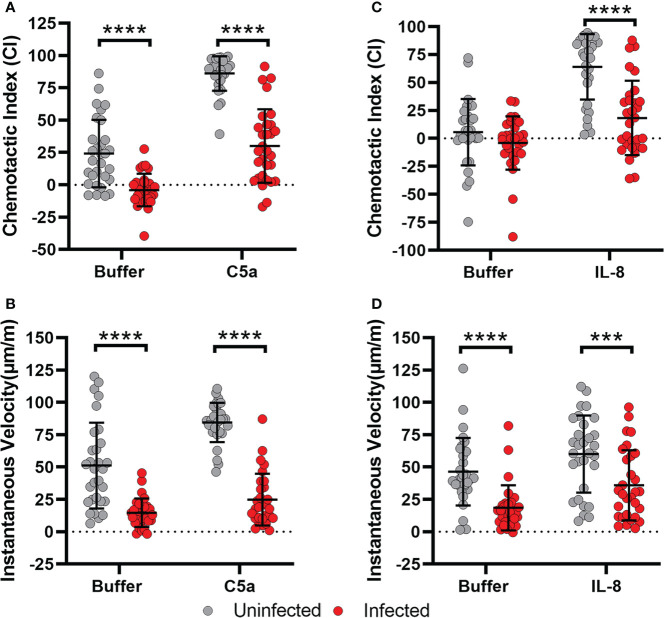
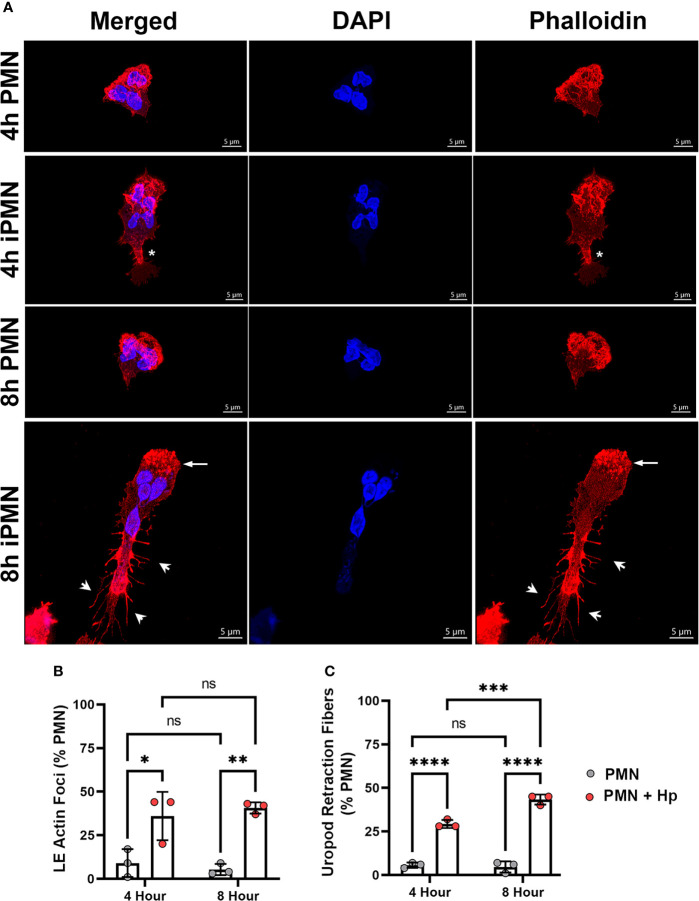
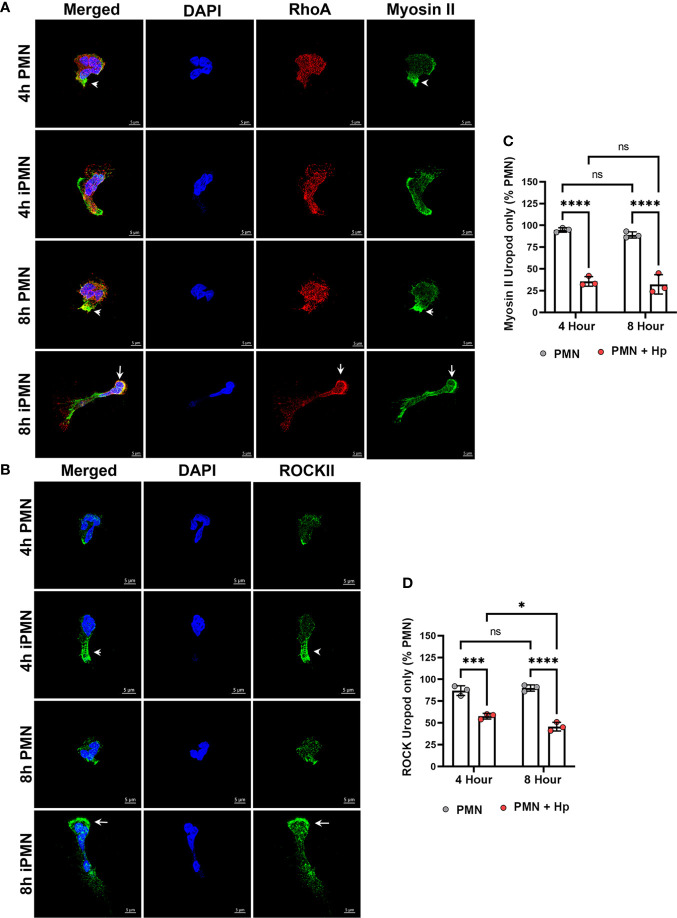
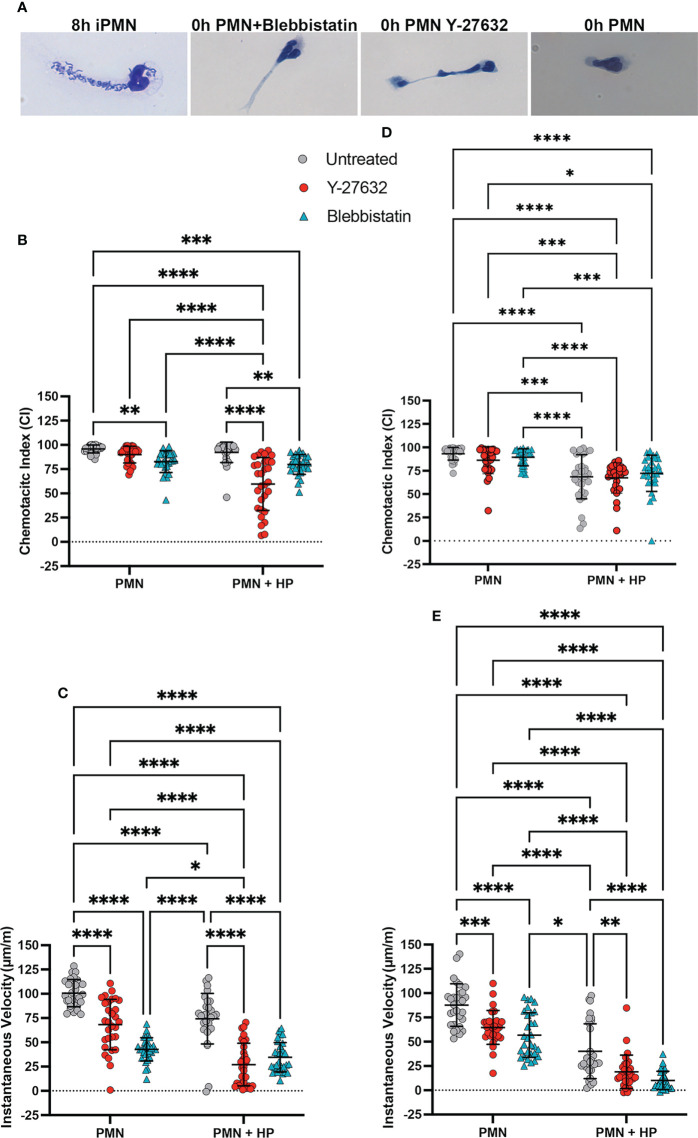
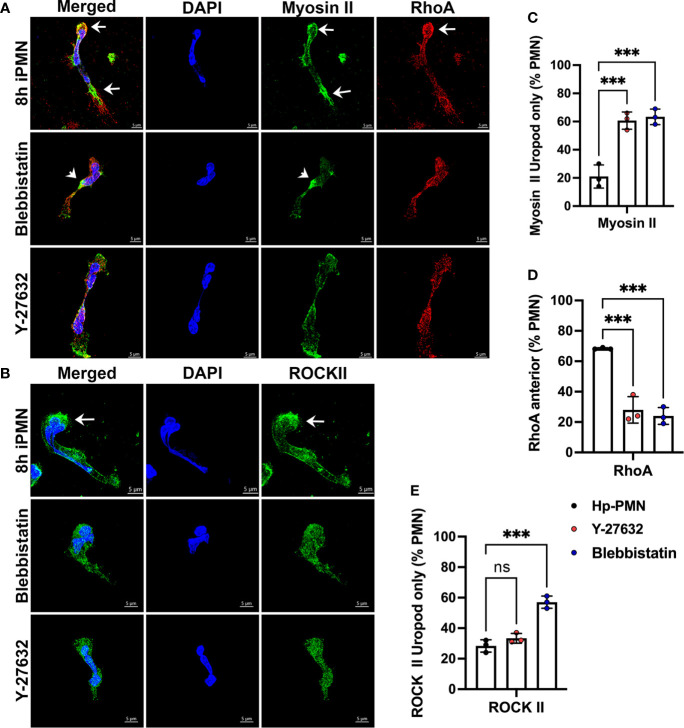
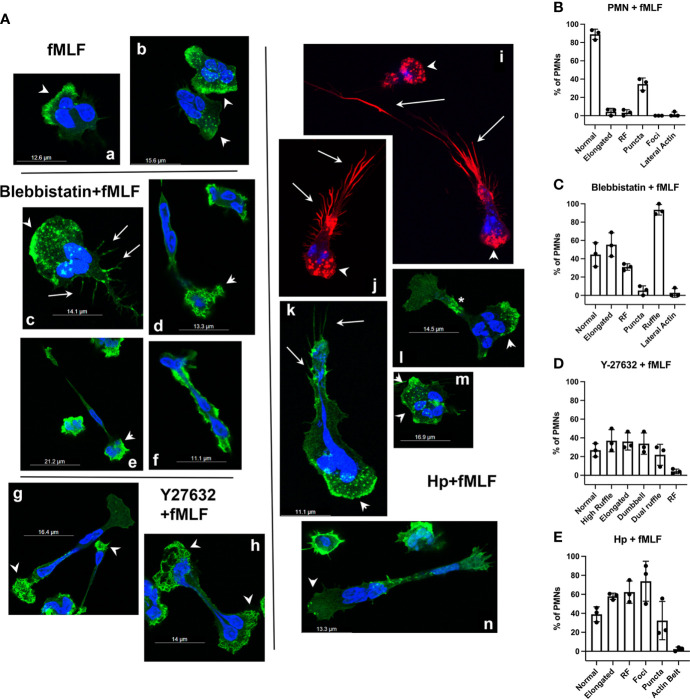
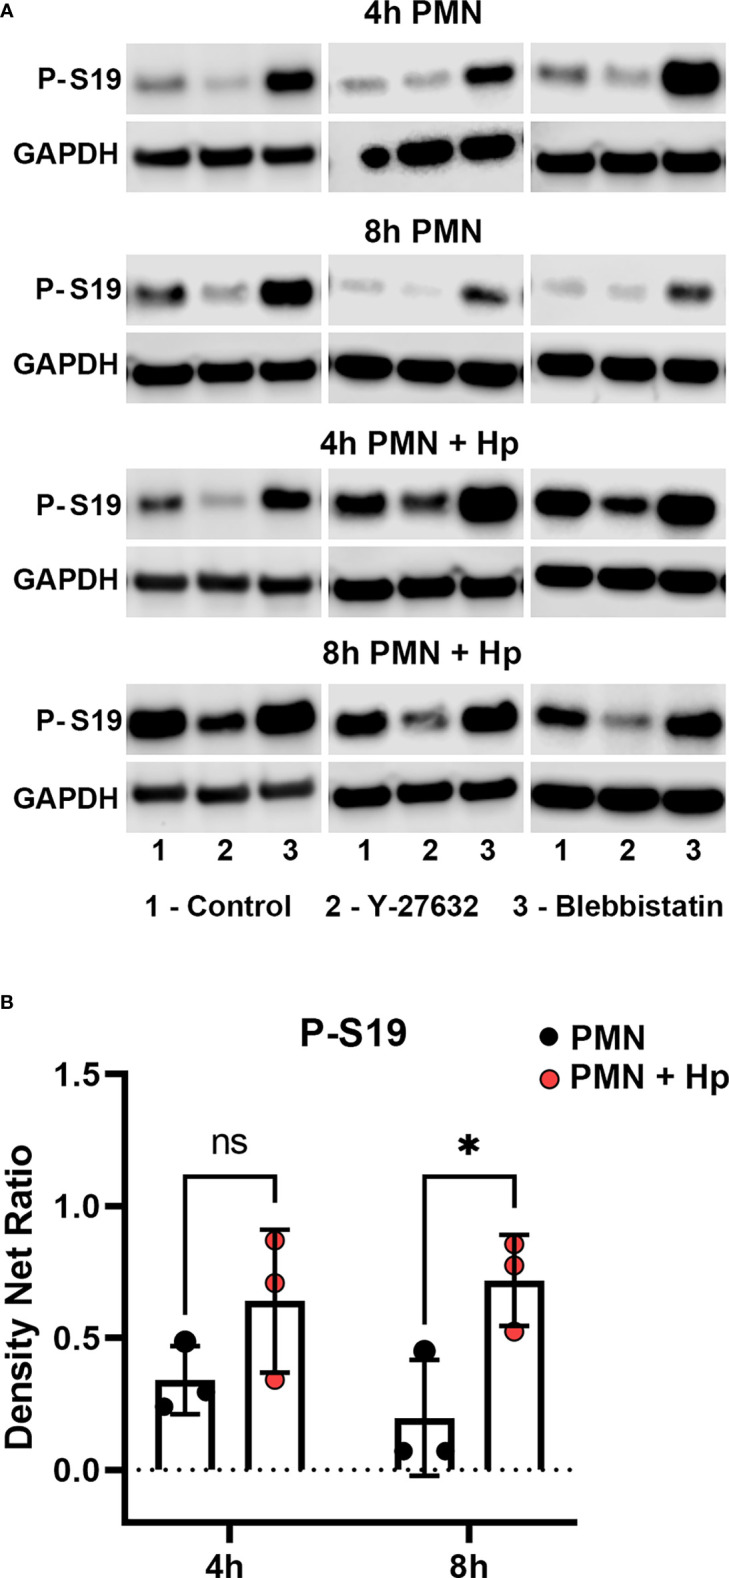
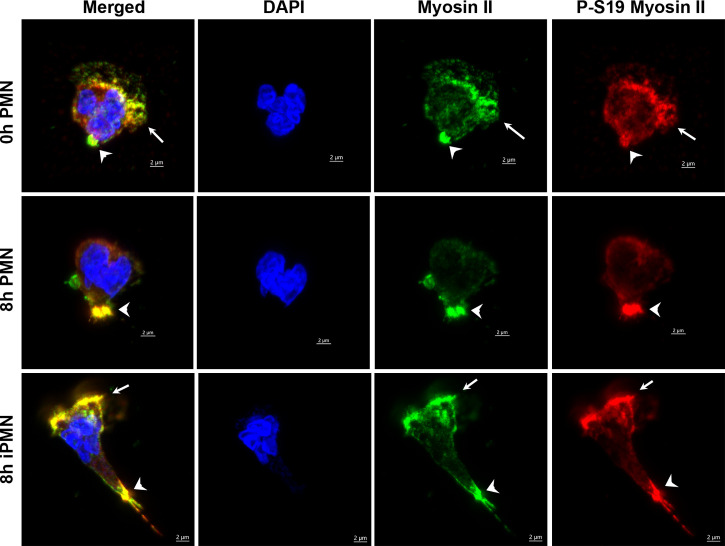
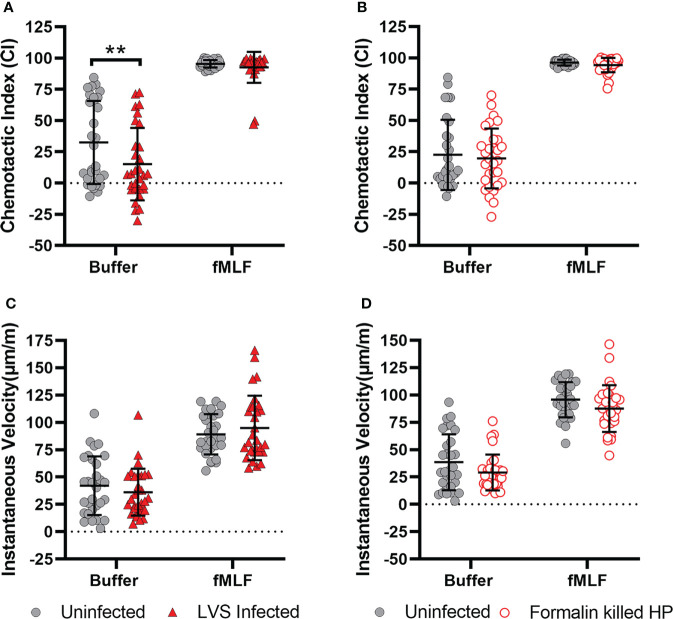
Helicobacter pylori is a major human pathogen that colonizes the gastric mucosa and plays a causative role in development of peptic ulcers and gastric cancer. Neutrophils are heavily infected with this organism in vivo and play a prominent role in tissue destruction and disease. Recently, we demonstrated that H. pylori exploits neutrophil plasticity as part of its virulence strategy eliciting N1-like subtype differentiation that is notable for profound nuclear hypersegmentation. We undertook this study to test the hypothesis that hypersegmentation may enhance neutrophil migratory capacity. However, EZ-TAXIScan™ video imaging revealed a previously unappreciated and progressive chemotaxis defect that was apparent prior to hypersegmentation onset. Cell speed and directionality were significantly impaired to fMLF as well as C5a and IL-8. Infected cells oriented normally in chemotactic gradients, but speed and direction were impaired because of a uropod retraction defect that led to cell elongation, nuclear lobe trapping in the contracted rear and progressive narrowing of the leading edge. In contrast, chemotactic receptor abundance, adhesion, phagocytosis and other aspects of cell function were unchanged. At the molecular level, H. pylori phenocopied the effects of Blebbistatin as indicated by aberrant accumulation of F-actin and actin spikes at the uropod together with enhanced ROCKII-mediated phosphorylation of myosin IIA regulatory light chains at S19. At the same time, RhoA and ROCKII disappeared from the cell rear and accumulated at the leading edge whereas myosin IIA was enriched at both cell poles. These data suggest that H. pylori inhibits the dynamic changes in myosin IIA contractility and front-to-back polarity that are essential for chemotaxis. Taken together, our data advance understanding of PMN plasticity and H. pylori pathogenesis.

Keywords: H. pylori; ROCK; RhoA; actin; chemotaxis; myosin II; neutrophils; uropod.


Conflict of interest statement

The authors declare that the research was conducted in the absence of any commercial or financial relationships that could be construed as a potential conflict of interest.

Figures

Figure 1
Figure 1
Chemotaxis of H. pylori-infected neutrophils to fMLF is impaired. (A–E) PMNs were left untreated or infected with H. pylori for 4 (A, B) or 8 hours (C–E) at 37°C prior to analysis of cell migration toward fMLF or buffer using an EZ-TAXIScan™ live cell imaging system. Single cell tracking was used to determine chemotactic indices (A, C) and instantaneous velocities (μm/min) (B, D). Graphs show the mean ± SD from three independent experiments. Symbols are data for individual cells. Statistical significance was determined by two-way ANOVA and Tukey’s multiple comparison’s post-test: *p<0.05,***p<0.001, ****p<0.0001, as indicated. (E) Still images from EZ-TAXIScan™ videos show the morphology of representative control and infected cells migrating toward fMLF at 8 hours after isolation or initiation of infection. Arrows mark the trailing uropod of each cell. (F) Hema-3 staining shows the morphology of control and infected cells that migrated toward fMLF in the under-agarose assay. Arrows point to bacteria in infected cells. (G) Pooled under-agarose assay data indicate the percentage of elongated cells at each assayed time point as the mean ± SD from three independent experiments. Statistical significance was determined by two-way ANOVA and Tukey’s multiple comparisons post-test. *p<0.05, **p<0.01, ****p<0.0001, as indicated. iPMN, infected PMNs. Long black wedges indicate the fMLF concentration gradient in panels (E, F).
Figure 2
Figure 2
Migration of infected cells toward C5a and IL-8 is also impaired. (A, B) Chemotactic indices and instantaneous velocities of control and H. pylori-infected PMNs migrating in a C5a gradient. (C, D) Chemotactic indices and instantaneous velocities (μm/min) of control and infected PMNs migrating in an IL-8 gradient. Graphs indicate the mean ± SD from three independent experiments. Symbols show individual cell data. Statistical significance was determined by two-way ANOVA and Tukey’s multiple comparisons post-test. ***p<0.001, ****p<0.0001, as indicated.
Figure 3
Figure 3
Infected PMNs display progressively modified actin localization during migration. (A) Images are 3D confocal Z-stacks of control and infected cells migrating toward fMLF in MatTek™ dishes assayed at 4 and 8 hours. Fixed cells were double-stained to detect DNA (DAPI, blue) and F-actin (rhodamine-phalloidin, red). Asterisks indicate an area of F-actin enrichment behind the nucleus of a 4 hour iPMN. Arrows and arrowheads indicate actin foci at the leading edge and actin-rich spikes/retraction fibers decorating the elongated uropod of an 8 hour iPMN, respectively. Images are representative of three independent experiments. Scale bar = 5 μm. iPMN, infected PMN. (B, C) Pooled confocal data indicate the percentage of uninfected and H. pylori-infected PMNs that exhibited enhanced leading edge (LE) F-actin foci (B), F-actin-rich retraction fibers at the rear uropod (C). At least 100 cells/experiment/condition were scored. Data are the mean ± SD from three independent experiments. Data were analyzed by two-way ANOVA and Tukey’s multiple comparisons post-test. *p<0.05, **p<0.01, ***p<0.001, ****p<0.0001, ns, not significant, as indicated. Hp, H. pylori.
Figure 4
Figure 4
RhoA, Myosin II and ROCK II are mislocalized in migrating, infected neutrophils. Cells that migrated toward fMLF in MatTek™ dishes at 4 or 8 hours were fixed and processed for confocal microscopy. (A) Z-stack images of control and infected PMNs (iPMNs) (were stained to detect DNA (DAPI, blue), RhoA (red) and myosin IIA (green). Arrowheads indicate myosin II enrichment at the uropod of control PMNs. Arrows indicate accumulation of RhoA and myosin IIA at the front of 8 hour iPMNs. (B) Z-stack images of control and infected PMNs were stained to detect DNA (DAPI, blue) and ROCK II (green). Arrowheads indicate ROCK II accumulation in the elongated uropod of a 4 hour infected PMN (iPMN). Arrows indicate ROCK II accumulation at the leading edge of an 8 hour iPMN. Images shown are representative of three independent experiments. Scale bar = 5 μm. (C, D) Pooled confocal data indicate the percentage of uninfected and H. pylori-infected PMNs that exhibited myosin II staining confined to the uropod (C) or ROCK II staining confined to the uropod (D). At least 100 cells/experiment/condition were scored. Data are the mean ± SD from three independent experiments. Data were analyzed by two-way ANOVA and Tukey’s multiple comparisons post-test. *p<0.05, ***p<0.001, ****p<0.0001, ns, not significant, as indicated. Hp, H. pylori.
Figure 5
Figure 5
Effects of Blebbistatin and Y-27632 on chemotaxis with and without (H) pylori infection. (A) Representative images shown Hema-3 stained 8 hour infected PMNs (iPMNs), 0 hour control PMNs, and control PMNs treated with Blebbistatin or Y-27632 migrating toward fMLF in the under-agarose assay. (B–E) EZ-TAXIScan™ data obtained at 4 hours (B, C) and 8 hours (D, E). Chemotactic indices (B, D) and instantaneous velocities (μm/min) (C, E) are shown for untreated control PMNs and cells treated with Blebbistatin or Y-27632 with and without prior H. pylori infection, as indicated. Graphs show the mean ± SD (n=3). Symbols are data for individual cells. Statistical significance was determined by two-way ANOVA and Tukey’s multiple comparisons post-test. *p<0.05, **p<0.01,**p<0.01, ***p<0.001, ****p<0.0001 for the indicated comparisons.
Figure 6
Figure 6
Effects of Blebbistatin and Y-27632 on localization of Myosin IIA, RhoA, and ROCK II. Freshly isolated neutrophils in MatTek™ dishes were treated with 25 μM Blebbistatin or 15 μM Y-27632 and allowed to migrate toward fMLF. Cells infected with H. pylori for 8 hours are shown for comparison. Fixed cells were stained to detect DNA (DAPI, blue), myosin IIA (green) and RhoA (red) (A), or DNA (DAPI, blue) and ROCK II (green) (B). Arrows indicate protein enrichment at the front or rear of infected PMNs. Arrowheads indicate enrichment of myosin IIA directly behind the nucleus of cells treated with Blebbistatin. 3D confocal Z-stack reconstructions shown are representative of three independent experiments. Scale bar = 5 μm. (C–E) Pooled data indicate the percentage of H. pylori-infected, Y27632- or Blebbistatin-treated neutrophils at 8 hours with uropod-restricted myosin IIA (C), anterior accumulation of RhoA (D) or uropod-restricted ROCKII (E). At least 100 cells per experiment and condition were scored. Data are the mean ± SD (n=3). Data were analyzed by one-way ANOVA and Tukey’s multiple comparisons post-test. As indicated, ***p<0.001, ns, not significant. Hp-PMN, Helicobacter pylori-infected PMN.
Figure 7
Figure 7
Effects of inhibitors and infection on F-actin structures in neutrophils migrating toward fMLF. (A) Representative confocal 3D Z-stack images of PMNs migrating toward fMLF in MatTek™ dishes are shown. Cells were stained with DAPI to detect DNA (blue) or rhodamine-phalloidin to detect F-actin (red or green pseudocolor). fMLF controls (images a, b). Blebbistatin-treated cells (images cf). Y-27632-treated cells (images g, h). H. pylori-infected cells (images in). Arrowheads, actin-rich ruffles and foci at the leading edge or cell poles. Arrows, actin-rich spikes/retraction fibers at the uropod. Asterisk, F-actin belt. Hp, H. pylori. (B–E) Quantitation of F-actin features in control (B), Blebbistatin-treated (C), Y-27632-treated (D) or H. pylori-infected cells (E) treated with fMLF. Scored features include normal or elongated morphology, retraction fibers (RF), small actin puncta, large actin foci, lateral actin enrichment or actin belts as well as anterior ruffling of elongated, Blebbistatin-treated cells, elongated Y-27632-treated cells nearly all of which were dumbbell-shaped and dumbbell-shaped cells with ruffles at both ends (Dual Ruffle). Data are the mean ± SD from three independent experiments.
Figure 8
Figure 8
Effects of infection, Y-27632 and Blebbistatin on myosin IIA RLC S19 phosphorylation. Neutrophils were left untreated or infected with H. pylori for 4 or 8 hours in the presence and absence of Y-27632 or Blebbistatin, as indicated. Immunoblots of whole cell lysates were probed to detect myosin IIA RLC S19 phosphorylation prior to stripping and reprobing with antibodies to GAPDH as the loading control. (A) Data from three representative experiments. (B) Quantitation of normalized S19 phosphorylation intensity for uninfected and infected PMNs (in absence of drugs) at 4 and 8 h are the mean ± SD (n=3). ns, not significant. *p<0.05. Additional data analyses are shown in Supplementary Figure 3 .
Figure 9
Figure 9
Subcellular localization of total and active myosin IIA phosphorylated on S19. Neutrophils were processed for confocal microscopy at 0 or 8 hours after isolation or 8 hours after infection with H. pylori. Representative Z-stack images were stained with DAPI to detect DNA (blue), myosin IIA (green) or S-19-phosphorylated myosin IIA (red). Arrowheads indicate colocalization and enrichment of total and S19-phosphorylated myosin IIA at the uropod. Arrows indicate colocalization and enrichment of total and S19-phosphorylated myosin IIA at the leading edge of cells infected with H. pylori (iPMN).
Figure 10
Figure 10
Inhibition of chemotaxis is specific for live H. pylori infection. Neutrophils were infected with F. tularensis strain LVS (A, B), or formalin-killed H. pylori (C, D) and migration toward buffer and fMLF was assayed 8 hours later using EZ-TAXIScan™ imaging. Chemotactic indices (A, C) and instantaneous velocities (μm/min) (B, D) were calculated. Graphs display the mean ± SD for three independent experiments. Symbols are data for individual cells. Statistical significance was determined by two-way ANOVA and Tukey’s multiple comparison test. **p<0.01, as indicated. Other comparisons were not significant (p>0.05).

Similar articles

Cited by

References

    1. Exmann L, Edel C, Sarkar A, Hellberg L, Behnen M, Moller S, et al. . Phagocytosis of apoptotic cells by neutrophil granulocytes: Diminished proinflammatory neutrophil functions in the presence of apoptotic cells. J Immunol (2010) 181:391–400. doi: 10.4049/jimmunol.0900564 - DOI - PubMed
    1. Winterbourn CC, Kettle AJ. Redox reactions and microbial killing in the neutrophil phagosome. Antioxid Redox Signal (2013) 18:642–60. doi: 10.1089/ars.2012.4827 - DOI - PubMed
    1. Kolaczkowksa E, Kubes P. Neutrophil recruitment and function in health and inflammation. Nat Rev Immunol (2013) 13:159–75. doi: 10.1038/nri3399 - DOI - PubMed
    1. Nauseef WM, Borregaard N. Neutrophils at work. Nat Immunol (2014) 15:602–11. doi: 10.1038/ni.2921 - DOI - PubMed
    1. Barzilai S, Yadav SK, Morrell S, Roncato F, Klein E, Stoler-Barak L, et al. . Leukocytes breach endothelial barriers by insertion of nuclear lobes and disassembly of endothelial actin filaments. Cell Rep (2017) 18:685–99. doi: 10.1016/j.celrep.2016.12.076 - DOI - PubMed

Publication types

LinkOut - more resources