Mining of immunological and prognostic-related biomarker for cervical cancer based on immune cell signatures
- PMID: 36341424
- PMCID: PMC9634000
- DOI: 10.3389/fimmu.2022.993118
Mining of immunological and prognostic-related biomarker for cervical cancer based on immune cell signatures
Abstract
Background: Immunotherapy has changed the therapeutic landscape of cervical cancer (CC), but has durable anti-tumor activity only in a subset of patients. This study aims to comprehensively analyze the tumor immune microenvironment (TIME) of CC and to mine biomarkers related to immunotherapy and prognosis.
Methods: The Cancer Genome Atlas (TCGA) data was utilized to identify heterogeneous immune subtypes based on survival-related immune cell signatures (ICSs). ICSs prognostic model was constructed by Cox regression analyses, and immunohistochemistry was conducted to verify the gene with the largest weight coefficient in the model. Meanwhile, the tumor immune infiltration landscape was comprehensively characterized by ESTIMATE, CIBERSORT and MCPcounter algorithms. In addition, we also analyzed the differences in immunotherapy-related biomarkers between high and low-risk groups. IMvigor210 and two gynecologic tumor cohorts were used to validate the reliability and scalability of the Risk score.
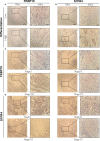
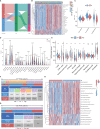
Results: A total of 291 TCGA-CC samples were divided into two ICSs clusters with significant differences in immune infiltration landscape and prognosis. ICSs prognostic model was constructed based on eight immune-related genes (IRGs), which showed higher overall survival (OS) rate in the low-risk group (P< 0.001). In the total population, time-dependent receiver operating characteristic (ROC) curves displayed area under the curve (AUC) of 0.870, 0.785 and 0.774 at 1-, 3- and 5-years. Immunohistochemical results showed that the expression of the oncogene (FKBP10) was negatively correlated with the degree of differentiation and positively correlated with tumor stage, while the expression of tumor suppressor genes (S1PR4) was the opposite. In addition, the low-risk group had more favorable immune activation phenotype and higher enrichment of immunotherapy-related biomarkers. The Imvigor210 and two gynecologic tumor cohorts validated a better survival advantage and immune efficacy in the low-risk group.
Conclusion: This study comprehensively assessed the TIME of CC and constructed an ICSs prognostic model, which provides an effective tool for predicting patient's prognosis and accurate immunotherapy.
Keywords: biomarkers; cervical cancer; immunohistochemistry; immunotherapy; tumor immune microenvironment.
Copyright © 2022 Wang, Nanding, Jia, Wang, Yang, Fan, Dong, Zheng, Ma, Shi and Yang.
Conflict of interest statement
The authors declare that the research was conducted in the absence of any commercial or financial relationships that could be construed as a potential conflict of interest.
Figures


Similar articles
-
Construction of an immune infiltration landscape based on immune-related genes in cervical cancer.Comput Biol Med. 2022 Jul;146:105638. doi: 10.1016/j.compbiomed.2022.105638. Epub 2022 May 17. Comput Biol Med. 2022. PMID: 35605489
-
Identification of immune-related cervical cancer prognostic biomarkers and construction of prognostic model based on tumor microenvironment.Eur J Med Res. 2025 Apr 9;30(1):261. doi: 10.1186/s40001-025-02515-5. Eur J Med Res. 2025. PMID: 40205481 Free PMC article.
-
Oncogenic signaling pathway-related long non-coding RNAs for predicting prognosis and immunotherapy response in breast cancer.Front Immunol. 2022 Aug 4;13:891175. doi: 10.3389/fimmu.2022.891175. eCollection 2022. Front Immunol. 2022. PMID: 35990668 Free PMC article.
-
Sialyltransferase-related genes as predictive factors for therapeutic response and prognosis in cervical cancer.PeerJ. 2025 May 22;13:e19422. doi: 10.7717/peerj.19422. eCollection 2025. PeerJ. 2025. PMID: 40416607 Free PMC article.
-
Unmasking the Hypoxia Landscape in Cervical Cancer: S100A2 and Its Implication for Immunotherapy Resistance.Reprod Sci. 2024 Jan;31(1):96-98. doi: 10.1007/s43032-023-01336-3. Epub 2023 Aug 31. Reprod Sci. 2024. PMID: 37653224 Free PMC article. Review.
Cited by
-
Bioinformatics analysis of immune characteristics in tumors with alternative carcinogenesis pathways induced by human papillomaviruses.Virol J. 2023 Dec 4;20(1):287. doi: 10.1186/s12985-023-02241-6. Virol J. 2023. PMID: 38049810 Free PMC article.
-
Development and Validation of an Anoikis-Related Gene Signature for Prognostic Prediction in Cervical Cancer.Int J Gen Med. 2025 Jun 4;18:2861-2879. doi: 10.2147/IJGM.S508059. eCollection 2025. Int J Gen Med. 2025. PMID: 40492231 Free PMC article.
-
Identification of an inflammatory response-related gene prognostic signature and immune microenvironment for cervical cancer.Front Mol Biosci. 2024 Jun 6;11:1394902. doi: 10.3389/fmolb.2024.1394902. eCollection 2024. Front Mol Biosci. 2024. PMID: 38903179 Free PMC article.
-
TBP activates DCBLD1 transcription to promote cell cycle progression in cervical cancer.Funct Integr Genomics. 2024 Nov 26;24(6):221. doi: 10.1007/s10142-024-01496-8. Funct Integr Genomics. 2024. PMID: 39586885

