. 2022 Oct 20:13:949787.
doi: 10.3389/fimmu.2022.949787. eCollection 2022.

Saliva antibody-fingerprint of reactivated latent viruses after mild/asymptomatic COVID-19 is unique in patients with myalgic-encephalomyelitis/chronic fatigue syndrome

Affiliations

Saliva antibody-fingerprint of reactivated latent viruses after mild/asymptomatic COVID-19 is unique in patients with myalgic-encephalomyelitis/chronic fatigue syndrome

Eirini Apostolou et al. Front Immunol. .

Abstract

Background: Myalgic encephalomyelitis/chronic fatigue syndrome (ME/CFS) is a chronic disease considered to be triggered by viral infections in a majority of cases. Symptoms overlap largely with those of post-acute sequelae of COVID-19/long-COVID implying common pathogenetic mechanisms. SARS-CoV-2 infection is risk factor for sustained latent virus reactivation that may account for the symptoms of post-viral fatigue syndromes. The aim of this study was first to investigate whether patients with ME/CFS and healthy donors (HDs) differed in their antibody response to mild/asymptomatic SARS-CoV-2 infection. Secondly, to analyze whether COVID-19 imposes latent virus reactivation in the cohorts.

Methods: Anti-SARS-CoV-2 antibodies were analyzed in plasma and saliva from non-vaccinated ME/CFS (n=95) and HDs (n=110) using soluble multiplex immunoassay. Reactivation of human herpesviruses 1-6 (HSV1, HSV2, VZV, EBV, CMV, HHV6), and human endogenous retrovirus K (HERV-K) was detected by anti-viral antibody fingerprints in saliva.

Results: At 3-6 months after mild/asymptomatic SARS-CoV-2 infection, virus-specific antibodies in saliva were substantially induced signifying a strong reactivation of latent viruses (EBV, HHV6 and HERV-K) in both cohorts. In patients with ME/CFS, antibody responses were significantly stronger, in particular EBV-encoded nuclear antigen-1 (EBNA1) IgG were elevated in patients with ME/CFS, but not in HDs. EBV-VCA IgG was also elevated at baseline prior to SARS-infection in patients compared to HDs.

Conclusion: Our results denote an altered and chronically aroused anti-viral profile against latent viruses in ME/CFS. SARS-CoV-2 infection even in its mild/asymptomatic form is a potent trigger for reactivation of latent herpesviruses (EBV, HHV6) and endogenous retroviruses (HERV-K), as detected by antibody fingerprints locally in the oral mucosa (saliva samples). This has not been shown before because the antibody elevation is not detected systemically in the circulation/plasma.

Keywords: COVID-19; EBV; HERV; HHV6A; ME/CFS; herpesvirus reactivation; latent virus; myalgic encephalomyelitis/chronic fatigue syndrome.


Conflict of interest statement

PS, BCB, BB, and OP declare disclosure of interest as having income from Bragée Clinics, and BB being a partial owner. The remaining authors declare that the research was conducted in the absence of any commercial or financial relationships that could be construed as a potential conflict of interest.

Figures
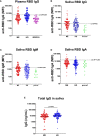
Figure 1
Figure 1
Plasma and saliva antibody responses against SARS-CoV-2-RBD (RBD). (A) IgG in plasma of patients with ME/CFS (ME), healthy donors (HDs) and blood donors collected before COVID-19, during 2015 (BD2015). Antibody responses against RBD in the saliva of ME, HD and a group of study participants seroconverted during the course of the study (pre-infection donors, pre-inf), for (B) IgG, (C) IgM and (D) IgA class. Cut-off threshold levels used to define SARS-CoV-2 positive/negative subgroups are indicated with dashed horizontal lines. For IgG responses in plasma, cut-off level was calculated from BD2015 IgG levels (BD2015, n=50; mean MFI + 3SD = 5889 MFI). For antibody responses in the saliva, cut-off levels were calculated from antibody titers of pre-inf donors (n=19; mean MFI + 3SD = 820 MFI for IgG, 1582 MFI for IgM and 14303 for IgA). (E) Concentration of total IgG (ng/mL) in the saliva of patients with ME (n=95) and HDs (n=110). Lines represents mean MFI (median fluorescence index). Statistically significant difference was calculated by nonparametric Wilcoxon test.
Figure 2
Figure 2
SARS-CoV-2 RBD and NP antibodies in systemic and local responders in ME and HDs. (A) SARS-CoV-2-RBD (RBD) for IgG, (B) IgM and (C) IgA class. SARS-CoV-2 NP (NP) for (D) IgG, (E) IgM and (F) IgA class. Systemic: Participants RBD-positive for systemic response in plasma. Local: Participants RBD-positive for local response in saliva. Negative: Participants patients RBD-negative both in plasma and saliva. Data are presented as boxplots with median values and 25th and 75th percentile. MFI, median fluorescence index. Statistically significant differences according to nonparametric Kruskal/Wallis procedure and false discovery rate adjustment (5%), are indicated as *p < 0.05, **p < 0.01, ***p < 0.001 and ****p < 0.0001. Dashed horizontal lines marked C/O in (A-C) indicate saliva cut-off levels as explained in Figures 1 legend.
Figure 3
Figure 3
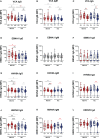
Saliva antibody reactivity to herpesviruses and endogenous retrovirus HERV-K in patients with ME/CFS (ME) and healthy donors (HDs). (A) Epstein-Barr virus viral capsid protein (VCA) IgG, (B) VCA IgM, (C) VCA IgA, (D) Epstein-Barr nuclear antigen 1 (EBNA1) IgG, (E) EBNA1 IgM, (F) EBNA1 IgA, (G) human herpes virus 6A (HHV6A) IgG, (H) HHV6A IgM, (I) HHV6A IgA, (J) human endogenous retrovirus K (HERV-K) IgG, (K) HERV-K IgM, (L) HERV-K IgA. Sys, participants RBD-positive for systemic response in plasma. Loc, participants RBD-positive for local response in saliva. Neg, participants RBD-negative both in plasma and saliva. Data are presented as boxplots with median values with 25th and 75th percentile. MFI, median fluorescence index. Statistically significant differences according to non-parametric Kruskal-Wallis procedure and false discovery rate adjustment (5%), are indicated as *p < 0.05, **p < 0.01, ***p < 0.001; ns, non-significant. Dimmed dots and dashed line indicates absence of antibodies (assay background levels). Dimmed/grey p-value asteriks* indicate loss of significance after confounding factor (age and gender) analysis with multiple linear regression and adjustment for FDR of 5% according to Benjamini, Krieger, Yekutieli. Red p-values asteriks* indicate gain of significance after adjustment, and black p-value asteriks* indicate no change after adjustment.
Figure 4
Figure 4
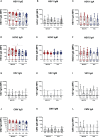
Saliva antibody reactivity to herpesviruses in patients with ME/CFS (ME) and healthy donors (HDs). (A herpes simplex-1 virus (HSV1) IgG, (B) HSV1 IgM, (C) HSV1 IgA, (D) herpes simplex-2 virus (HSV2), (E) HSV2 IgM, (F) HSV2 IgA, (G) varicella zoster virus (VZV), (H) VZV IgM, (I) VZV IgA, (J) human cytomegalovirus (CMV) IgG, (K) CMV IgM, (L) CMV IgA. Systemic: Participants RBD-positive for systemic response in plasma. Sys, participants RBD-positive for systemic response in plasma. Loc, participants RBD-positive for local response in saliva. Neg, participants RBD-negative both in plasma and saliva. Data are presented as boxplots with median values with 25th and 75th percentile. MFI, median fluorescence index. Statistically significant differences according to non-parametric Kruskal-Wallis procedure and false discovery rate adjustment (5%), are indicated as *p < 0.05, **p < 0.01 Dimmed p-value asteriks* indicate influence of confounding factor. Dimmed dots and dashed line indicates absence of antibodies (assay background levels). Dimmed/grey p-value asteriks* indicate loss of significance after confounding factor (age and gender) analysis with multiple linear regression and adjustment for FDR of 5% according to Benjamini, Krieger, Yekutieli.
Figure 5
Figure 5
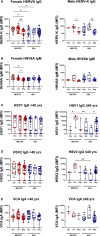
Female vs Male saliva and age-based antibody profile comparisons in patients with ME/CFS (ME) and healthy donors (HDs). Male/Female IgG responses against (A) human endogenous retrovirus K (HERVK) and (B) IgM responses against human herpesvirus 6A (HHV6A) in all female and male participants. (C) Age-dependent IgG responses against herpes simplex virus 1 (HSV1) for participants under 40 years of age (left graph) and over 40 years of age (right graph). IgG responses against herpes simplex virus 2 (HSV2) (D) for participants under 40 years of age (left graph) and over 40 years of age (right graph). (E) IgA responses against VCA for participants under 40 years of age (left graph) and over 40 years of age (right graph). Sys, participants RBD-positive for systemic response in plasma. Loc, participants RBD-positive for local response in saliva. Neg, participants RBD-negative both in plasma and saliva. Data are presented as boxplots with median values with 25th and 75th percentile. MFI, median fluorescence index. Statistically significant differences according to non-parametric Kruskal-Wallis procedure and false discovery rate adjustment (5%), are indicated as *p < 0.05, **p < 0.01.
Figure 6
Figure 6
Summary of the effect of SARS-CoV-2 infection, regarding latent virus reactivation. (A) Comparison within each cohort based on IgG, IgM, and IgA antibody response fingerprint in the oral mucosa. Only antibody responses with statistically significant differences are displayed on charts. Local responders: Participants RBD-positive for local response in saliva. (B) Hierarchical clustered heatmap showing fold-change of saliva antibody titers in local and systemic responses within and between each group including p-values. Statistically signicant differences according to nonparametric Kruskal/Wallis procedure and false discovery rate adjustment (5%), are indicated as *p < 0.05,**p < 0.01, ***p < 0.001 and ****p < 0.0001.
Figure 7
Figure 7
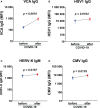
Paired analysis of saliva antibody reactivity to herpesviruses before and after SARS-CoV-2 infection. (A) Epstein-Barr viral capsid antigen (VCA) IgG, (B) herpes simplex-1 virus (HSV1) IgG, (C) endogenous retrovirus (HERV-K) IgM, and (D) cytomegalovirus (CMV) IgG in the same individuals before and after SARS-CoV-2 infection (n=19). Data are presented as mean antibody values with SEM of 19 individuals before and after infection. MFI, median fluorescence index. Statistically significant differences according to paired Wilcoxon-signed rank test are indicated in the graphs.
Figure 8
Figure 8
SARS-CoV-2 infection generates a distinct antibody fingerprint of latent virus reactivation in saliva but not in plasma. (A) SARS-CoV-2-RBD (RBD), (B) SARS-CoV-2 NP (NP), (C) Epstein-Barr viral capsid antigen (VCA), and (D) herpes simplex virus-1 (HSV1) in patients with ME/CFS (ME) and healthy donors (HDs). Sys, participants RBD-positive for systemic response in plasma. Loc, participants RBD-positive for local response in saliva. Neg, participants RBD-negative both in plasma and saliva. Data are presented as boxplots with median values with 25th and 75th percentile. MFI, median fluorescence index. Statistically significant differences according to non-parametric Kruskal-Wallis procedure and false discovery rate adjustment (5%), are indicated as **p < 0.01, and ****p < 0.0001.

Similar articles

Cited by

References

    1. Carruthers BM, van de Sande MI, De Meirleir KL, Klimas NG, Broderick G, Mitchell T, et al. . Myalgic encephalomyelitis: International consensus criteria. J Intern Med (2011) 270:327–38. doi: 10.1111/j.1365-2796.2011.02428.x - DOI - PMC - PubMed
    1. Carruthers BM. Definitions and aetiology of myalgic encephalomyelitis: How the Canadian consensus clinical definition of myalgic encephalomyelitis works. J Clin Pathol (2007) 60:117–9. doi: 10.1136/jcp.2006.042754 - DOI - PMC - PubMed
    1. Zhang L, Gough J, Christmas D, Mattey DL, Richards SC, Main J, et al. . Microbial infections in eight genomic subtypes of chronic fatigue syndrome/myalgic encephalomyelitis. J Clin Pathol (2010) 63:156–64. doi: 10.1136/jcp.2009.072561 - DOI - PMC - PubMed
    1. Hickie I, Davenport T, Wakefield D, Vollmer-Conna U, Cameron B, Vernon SD, et al. . Post-infective and chronic fatigue syndromes precipitated by viral and non-viral pathogens: prospective cohort study. Bmj (2006) 333:575. doi: 10.1136/bmj.38933.585764.AE - DOI - PMC - PubMed
    1. Moldofsky H, Patcai J. Chronic widespread musculoskeletal pain, fatigue, depression and disordered sleep in chronic post-SARS syndrome; a case-controlled study. BMC Neurol (2011) 11:37–43. doi: 10.1186/1471-2377-11-37 - DOI - PMC - PubMed

Publication types