

Blocking STAT3/5 through direct or upstream kinase targeting in leukemic cutaneous T-cell lymphoma
- PMID: 36341492
- PMCID: PMC9727928
- DOI: 10.15252/emmm.202115200
Blocking STAT3/5 through direct or upstream kinase targeting in leukemic cutaneous T-cell lymphoma
Abstract
Leukemic cutaneous T-cell lymphomas (L-CTCL) are lymphoproliferative disorders of skin-homing mature T-cells causing severe symptoms and high mortality through chronic inflammation, tissue destruction, and serious infections. Despite numerous genomic sequencing efforts, recurrent driver mutations have not been identified, but chromosomal losses and gains are frequent and dominant. We integrated genomic landscape analyses with innovative pharmacologic interference studies to identify key vulnerable nodes in L-CTCL. We detected copy number gains of loci containing the STAT3/5 oncogenes in 74% (n = 17/23) of L-CTCL, which correlated with the increased clonal T-cell count in the blood. Dual inhibition of STAT3/5 using small-molecule degraders and multi-kinase blockers abolished L-CTCL cell growth in vitro and ex vivo, whereby PAK kinase inhibition was specifically selective for L-CTCL patient cells carrying STAT3/5 gains. Importantly, the PAK inhibitor FRAx597 demonstrated encouraging anti-leukemic activity in vivo by inhibiting tumor growth and disease dissemination in intradermally xenografted mice. We conclude that STAT3/5 and PAK kinase interaction represents a new therapeutic node to be further explored in L-CTCL.
Keywords: STAT3; STAT5; T-cell; lymphoma; targeting.
© 2022 The Authors. Published under the terms of the CC BY 4.0 license.
Figures
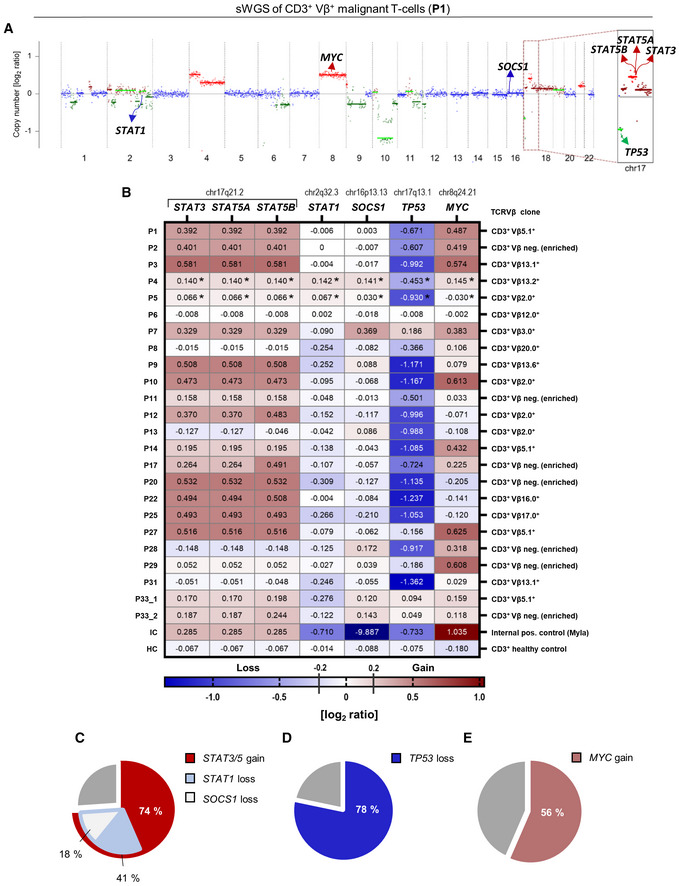
- A
sWGS performed on sorted CD3+/Vβ+ malignant T‐cells isolated from the blood of P1, shown as a representative example. Copy number profiles and ploidy estimates were calculated using ichorCNA. Blue represents balanced genomic regions, green indicates loss/deletion, and red indicates gain/amplification of regions on chromosome 17. Darker color shades indicate higher log2 ratios. Copy number profiles from all six patients (P1–P6) are shown in Appendix Fig S2.
- B
Heatmap of extracted CNA [log2 ratios] of STAT genes on chr17 (i.e., STAT3, STAT5A, and STAT5B), and other relevant tumor suppressors (i.e., STAT1, SOCS1, and TP53) and oncogenes (MYC). Red indicates gain/amplification and blue indicates loss/deletion. The balance threshold was set to ±0.1. P33 presented with two malignant clones in the blood and both were sequenced (P33_1 (Clone 1) and P33_2 (Clone 2)). *Tetraploid malignant clone.
- C–E
Pie charts representing the identified genetic alterations in the patient cohort based on the CNA log2 ratios. (C) STA3/5 copy number gain (n = 17/23), STAT1 copy number loss (n = 7/17), SOCS1 loss (n = 3/17), (D) TP53 loss (n = 18/23), and (E) MYC gain (n = 13/23).
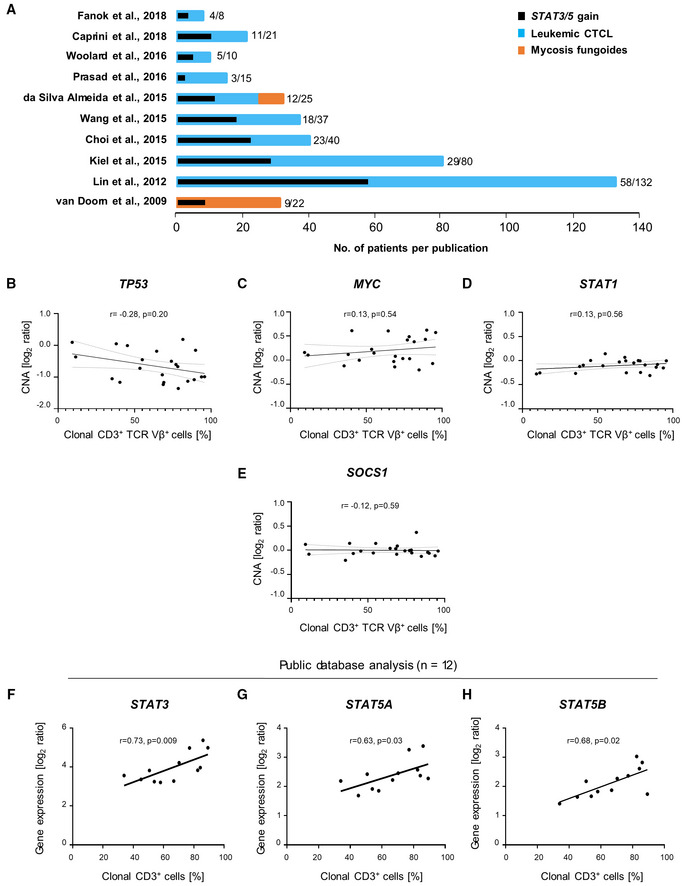
- A
Graphical summary of the literature analysis on genomic CTCL studies performed in the last 10 years including larger cohorts of patients, as described in Table EV3. The number of patients carrying 17q gain, specifically of the region containing the STAT3/5 genes (17q11.2‐17q21.31) is written and depicted in black, in comparison to the total number of patients included and depicted in blue or orange. Blue color depicts Sezary syndrome patients, whereas orange depicts mycosis fungoides patients.
- B–E
Spearman correlation analysis using CNA log2 ratios and the percentage of clonal CD3+ cells detected in patients with (B) TP53, (C) MYC, (D) STAT1, and (E) SOCS1.
- F–H
Spearman correlation analysis on expression data extracted from the Oncomine™ Platform as published in Caprini et al (2009). Patients with 17q (STAT3/5) gains were selected and the percentage of clonal CD3+ cells was correlated with the respective STAT3/5 gene expression for the (F) STAT3_208991 reporter, (G) STAT5A_203010 reporter, and (H) STAT5B_212550 reporter.
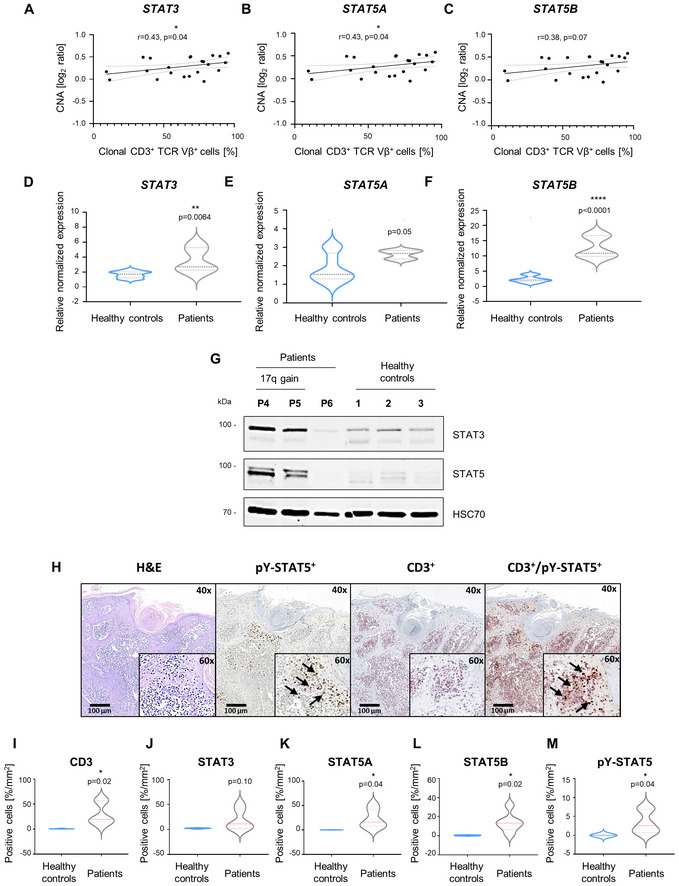
- A–C
Spearman correlation analysis using CNA log2 ratios and the percentage of clonal CD3+ cells detected in patients for (A) STAT3, (B) STAT5A, and (C) STAT5B.
- D–F
RT–qPCR expression data of (C) STAT3, (D) STAT5A, and (E) STAT5B genes from whole PBMCs isolated from patient blood (n = 5) or healthy controls (n = 9). GAPDH expression was used for normalization. Statistical significance was calculated using a two‐tailed unpaired t‐test. P‐value: < 0.01 (**) and < 0.0001 (****). One experiment was performed in technical triplicates. The bold dashed line in the middle of the violin plot denotes the median value, while the thin dotted lines denote the interquartile range.
- G
Immunoblotting for total STAT3/5 protein isolated from the respective whole PBMCs from patient blood (n = 3) or healthy controls (n = 3). HSC70 was used as loading control. One experiment was performed.
- H
Representative image of H&E, CD3, pY‐STAT5 single staining, and CD3/pY‐STAT5 double staining on skin biopsy tissue from P3 (n = 1), which demonstrates infiltration of CD3+ pY‐STAT5+ (13.45%) cells into the dermal and subcutaneous layer of the skin. Arrows indicate pY‐STAT5+ single and CD3+ pY‐STAT5+ cells.
- I–M
Quantification of IHC staining from skin‐biopsy sections of L‐CTCL patients (n = 6) and healthy individuals (n = 5) depicted in Appendix Fig S3. As the number of STAT5A/B‐positive cells was negligible (less than 0.03/per mm2) in healthy skin biopsy sections, healthy control samples were considered negative for pY‐STAT5, and levels were set to 0. Statistical significance was calculated using an unpaired Welch's t‐test. P‐value: < 0.05 (*). The bold dashed line in the middle of the violin plot denotes the median value, while the thin dotted lines denote the interquartile range.
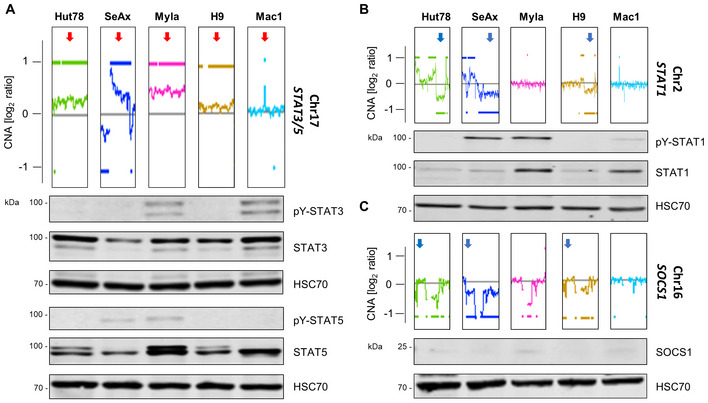
- A–C
Graphic depicts the aberration patterns on (A) chromosome 17 (STAT3/5), (B) chromosome 2 (STAT1), and (C) chromosome 16 (SOCS1) in the CTCL cell lines used in the study. Aberration patterns are represented as the log2 ratio of the fluorescence intensity of the tumor DNA vs. reference DNA and were generated by aCGH. The whole‐chromosome aberration patterns of the cell lines are shown in Appendix Fig S4. Immunoblotting for total protein STAT1/3/5 and activation levels: phospho‐Tyr (701)–STAT1/phospho‐Tyr (705)–STAT3/phospho‐Tyr (694/699)–STAT5 and SOCS1 protein levels. The cytokine‐dependent cell line, SeAx, was collected 30 min after 5 ng/ml IL‐2 and IL‐4 cytokine addition. HSC70 was used as loading control. One representative out of three independent experiments is shown.
- A
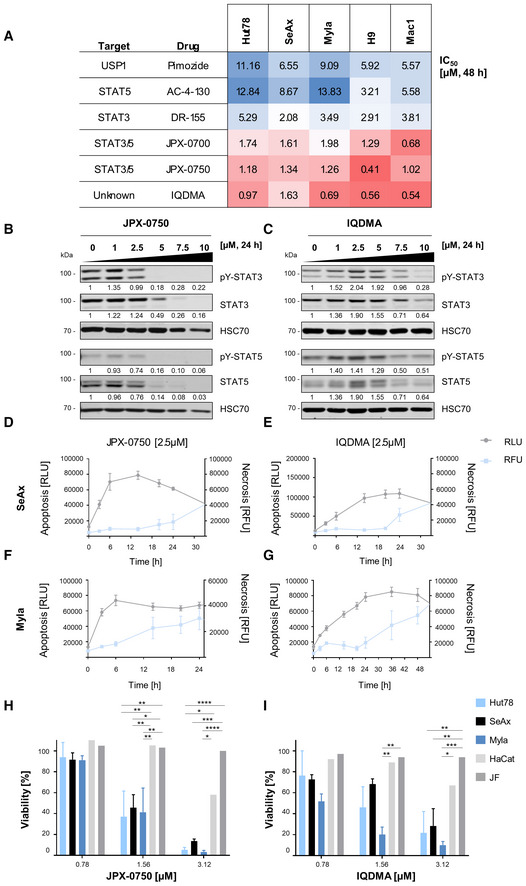
Heatmap of IC50 values calculated from drug–response analysis using CellTiter‐Glo viability assays upon 48 h drug treatment. One representative, out of three independent experiments performed in triplicates, is shown.
- B, C
Immunoblot showing total protein STAT3/5 and activation levels: phospho‐Tyr (705)–STAT3/phospho‐Tyr (694/699)–STAT5A/B after 24 h treatment with (B) JPX‐0750 and (C) IQDMA. The cytokine‐dependent cell line, SeAx, was collected 30 min after 5 ng/ml IL‐2 and IL‐4 cytokine addition. HSC70 was used as loading control. The normalized levels of phospho‐ and total STAT3/5 quantified by densitometry are shown below the respective blots. One representative out of three independent experiments is shown.
- D–G
Real‐time apoptosis/necrosis assay in the (D, E) SeAx and (F, G) Myla cell lines treated with 2.5 μM JPX‐0750 and IQDMA. RLU, Apoptosis [RLU] = relative luminescence; Necrosis [RFU] = relative fluorescence units. Error bars represent mean ± SD. One experiment in technical triplicates was performed.
- H, I
The effect of (H) JPX‐0750 and (I) IQDMA on the viability of CTCL cells in comparison to the viability of primary juvenile fibroblasts (JF) and keratinocytes (HaCat) at a low‐dose range (0.7–3 μM). One experiment, in triplicates, was performed with JF and HaCat cells, and three experiments, in triplicates, with the CTCL cells. Error bars represent mean ± SD. Statistical significance was calculated by two‐way ANOVA with Tukey's multiple comparisons test. P‐value: < 0.05 (*), < 0.01 (**), < 0.001 (***), and < 0.0001 (****). P‐value summaries are provided in Appendix Table S1.
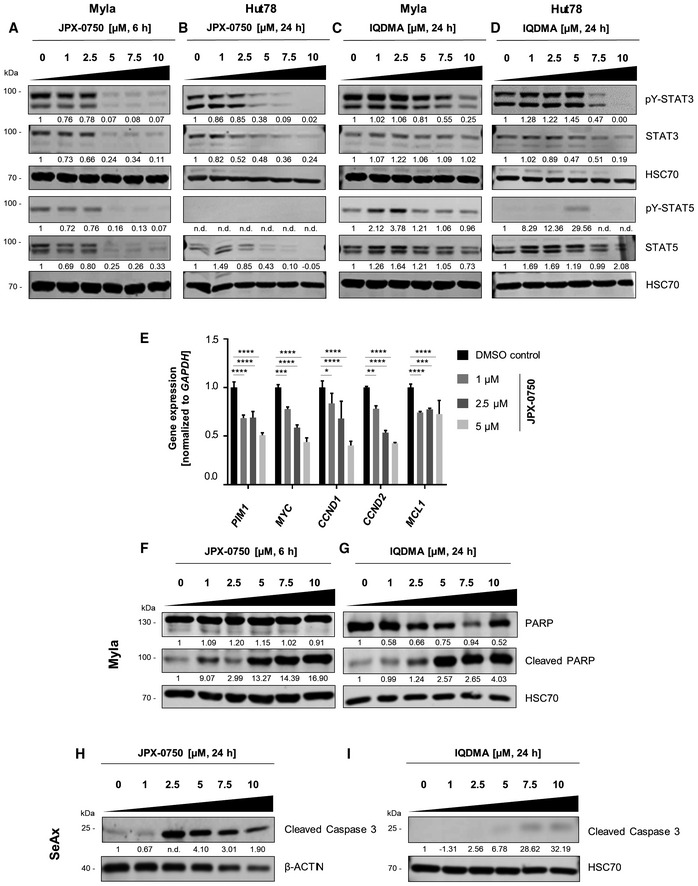
- A–D
Immunoblot showing total and pY‐STAT3/pY‐STAT5 levels (i.e., phospho‐Tyr (705)‐STAT3 and phospho‐Tyr (694/699)‐STAT5A/B) in (A) Myla cells upon 6 h treatment with JPX‐0750 and (B) Hut78 cells upon 24 h treatment with JPX‐0750. (C) Myla and (D) Hut78 cells were treated with 24 h IQDMA. HSC70 was used as loading control. The normalized phospho‐ and total protein levels, quantified by densitometry, are shown below the respective blots. One representative out of three independent experiments is shown.
- E
RT–qPCR for STAT5 target genes in the SeAx cell line after 24 h treatment with JPX‐0750. Gene expression was normalized to GAPDH. Statistical significance was calculated using two‐way ANOVA with multiple comparisons. P‐value: < 0.05 (*), < 0.01 (**), < 0.001 (***), and 0.0001 (****). P‐value summaries are provided in Appendix Table S1. Error bars represent mean ± SD. One experiment performed in triplicates is shown.
- F, G
Cleaved and total PARP protein levels in Myla cells treated with (F) JPX‐0750 for 6 h and (G) IQDMA for 24 h. HSC70 was used as loading control. The normalized total protein levels, quantified by densitometry, are shown below the respective blots. One representative out of two independent experiments is shown.
- H, I
Immunoblotting for cleaved caspase 3 levels in SeAx cells after 24 h treatment with (H) JPX‐0750 and (I) IQDMA. β‐Actin or HSC70 were used as loading controls. The normalized total protein levels, quantified by densitometry, are shown below the respective blots. One representative out of two independent experiments is shown.

- A
Kinome screen with 10 μM IQDMA.
- B
Subcellular fractions of SeAx cells treated with IQDMA for 24 h and immunoblotted for pY‐STAT5 and total STAT5. The cells were collected 30 min after 1 ng/ml IL‐2 cytokine addition. α‐Tubulin and histone H3 were used as loading controls for cytoplasmic and nuclear fractions, respectively. The normalized levels of phospho‐ and total STAT5 in the nucleus and cytoplasm, quantified by densitometry, are shown below the respective blots. One representative out of two independent experiments is shown.
- C
Venn diagram showing the number of proteins that are significantly up‐/downregulated as a result of IQDMA treatments at 1, 2.5, and 10 μM.
- D–F
Scatter plot depicting the profile of SeAx cells treated with (D) 1 μM IQDMA, (E) 2.5 μM IQDMA, and (F) 10 μM IQDMA. Protein abundances were determined using TMT‐based quantification mass spectrometry. Significant changes were assessed by a modified t‐test as implemented in the limma package, with the negative log10 P‐values on the x‐axis, and log2 fold change shown on the y‐axis.
- G
Heatmap of IC50 values calculated from drug response analysis using CellTiter‐Blue or CellTiter‐Glo viability assays upon 48 h drug treatment. One representative of three independent experiments performed in triplicates is shown. Gray represents the presence of STAT3/5 gain.

- A
Thermal shift profiles of 2 μM STAT5B with 100 μM IQDMA or 100 μM STAT5‐binding peptide (positive control). The local maxima indicate the melt temperature of the protein (Tm ± 0.3°C). One representative out of two independent experiments performed in technical triplicates is shown.
- B
Fluorescence polarization assay using 180 nM STAT5B with 100 μM IQDMA or 100 μM peptide (positive control). The positive control exhibits a single‐site displacement profile. Error bars represent mean ± SD. Three independent experiments were performed.
- C
IQDMA structure.
- D
Subcellular fractions of SeAx cells treated with IQDMA for 18 h and immunoblotted for pY‐STAT3 (phospho‐Tyr (705)‐STAT3) and total STAT3. The cells were collected 30 min after 5 ng/ml IL‐2 cytokine addition. α‐Tubulin and histone H3 were used as loading controls for cytoplasmic and nuclear fractions, respectively. The normalized levels of phospho‐ and total STAT3 in the nucleus and cytoplasm, quantified by densitometry, are shown below the respective blots. One experiment was performed.
- E
Bar graph showing the cellular pathways that are most affected by IQDMA treatment as determined by network enrichment analysis.
- F
Subcellular fractions of SeAx cells treated with FRAx597 for 18 h and immunoblotted for pY‐STAT3/pY‐STAT5 levels (i.e., phospho‐Tyr (705)‐STAT3 and phospho‐Tyr (694/699)‐STAT5A/B) and total STAT3/5 levels. The cells were collected 30 min after 5 ng/ml IL‐2 cytokine addition. α‐Tubulin and histone H3 were used as loading controls for cytoplasmic and nuclear fractions, respectively. The normalized levels of phospho‐ and total STAT3/5 in the nucleus and cytoplasm, quantified by densitometry, are shown below the respective blots. One experiment was performed.
- A
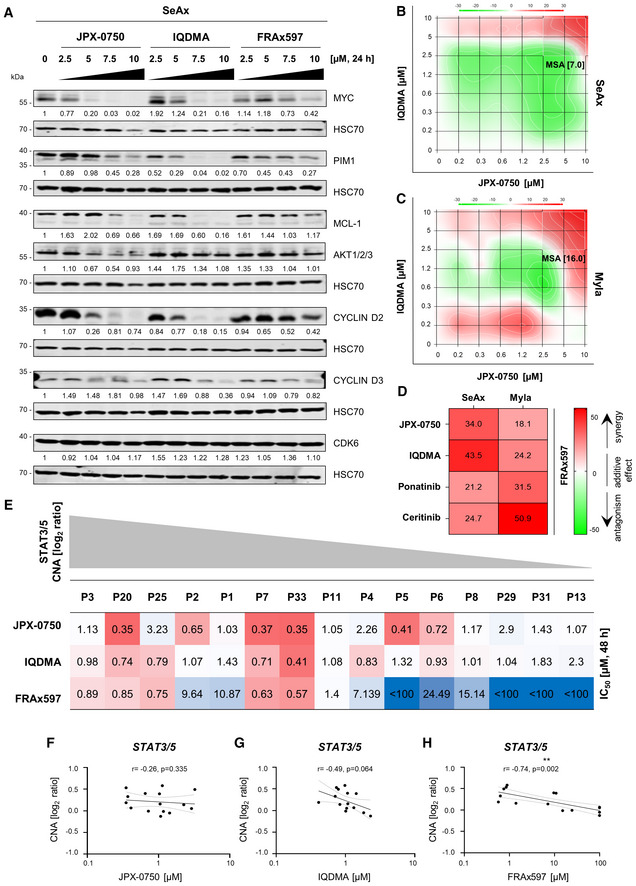
Inhibitor treatment was carried out with increased dose escalation for 24 h. SeAx cells were collected 2 h after 7,5 ng/ml IL‐2 and IL‐4 cytokine addition. STAT3/5 target gene products MYC, PIM1, MCL‐1, and AKT1/2/3, as well as proteins regulating the cell cycle, such as CYCLIN D2 and D3, and CDK6, were probed by western blotting. HSC70 served as loading control. The normalized protein levels, quantified by densitometry, are shown below the respective blots. One representative out of three independent experiments is shown.
- B–D
Synergy analysis of the indicated two‐drug combinations in the SeAx and Myla cells after 48 h treatment. In each graph, the most synergistic area (MSA) is highlighted, which represents the most synergistic three‐by‐three dose window with the respective MSA score. The zero‐interaction potency model was applied to quantify the degree of synergy, according to which an MSA score below −10 indicates that drugs are antagonistic (green), a score between −10 and 10 indicates that two drugs are additive (white), while a score above 10 indicates a synergistic effect (red). (D) Heatmap showing MSA scores of the combination of FRAx597 with the listed drugs. One representative out of two independent experiments is shown. Synergy matrices for each drug combination are represented in Appendix Fig S5.
- E
Heatmap showing the IC50 values upon treatment of primary PBMCs isolated from L‐CTCL patients with JPX‐0750, IQDMA, and FRAx597. One experiment performed in triplicates using CellTiter‐Glo viability assays upon 48 h drug treatment is shown. The relative STAT3/5 log2 ratio value is depicted in gray.
- F–H
Spearman correlation analysis using CNA log2 ratios and the IC50 values for the respective drug.

- A
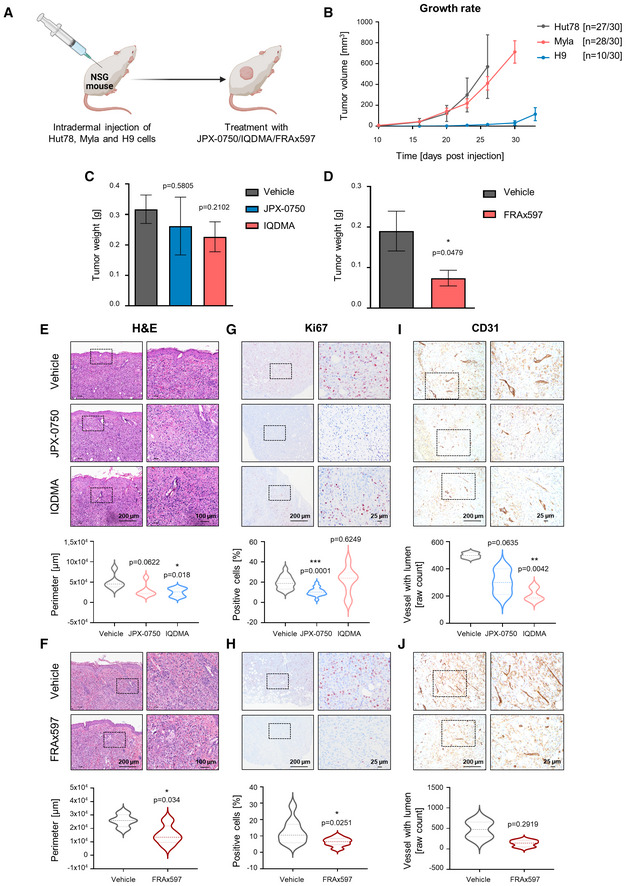
Graphical scheme depicting the experiment.
- B
Growth rate of Hut78, Myla, and H9‐derived tumors measured on the respective day post‐injection. The mean of the respective tumor volumes for the H9 group and vehicle‐treated groups for Hut78 and Myla are shown. Tumor volume = (length × width2)/2. Error bars represent mean ± SEM. n represents the total number of tumors that engrafted per group.
- C, D
Myla‐derived tumor weight upon experiment termination, after 20 days of treatment with 5 mg/kg of (C) JPX‐0750 (n = 5) and IQDMA (n = 6), or vehicle (n = 7), and (D) FRAx597 (n = 5) or vehicle (n = 4), with n representing the number of analyzed tumors per group. Statistical significance was calculated using a two‐tailed paired t‐test. P‐value: < 0.05 (*). Error bars represent mean ± SEM.
- E–J
H&E and IHC analyses of Myla‐derived tumors treated with JPX‐0750 (n = 6), IQDMA (n = 6) or vehicle (n = 6), and FRAx597 (n = 5) or vehicle (n = 4), stained with (E, F) H&E, (G, H) Ki67, as a marker for proliferation, and (I, J) CD31, as a tumor vessel marker, with n representing the number of analyzed tumors per group. The pictures shown are from contiguous sections. Dotted rectangles indicate magnified areas. Scale bars, 200, 100, and 25 μm. Violin plots show the perimeter of the annotated tumor cell infiltration/expansion region into the intradermal and subcutaneous region of the skin, as well as quantification of the percentage of Ki67+ cells in the tissue. CD31 staining was quantified as raw counts of vessels with lumen. Statistical significance was calculated using a two‐tailed paired t‐test with Welch's correction. P‐value: < 0.05 (*), < 0.01 (**), and < 0.001 (***). The bold dashed line in the middle of the violin plot denotes the median value, while the thin dotted lines denote the interquartile range.
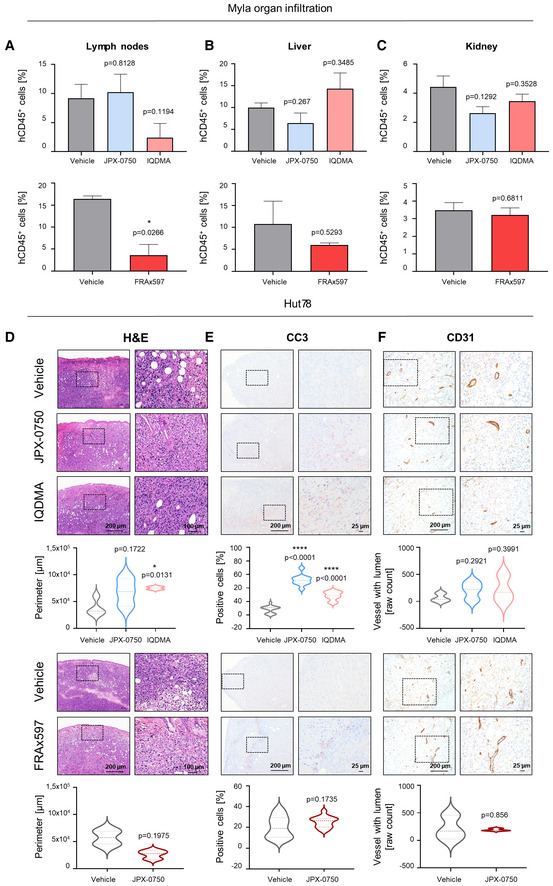
- A–C
Flow cytometric analysis of malignant cell dissemination into (A) lymph nodes, (B) liver, and (C) kidney (Vehicle: n = 3, JPX‐0750: n = 3, IQDMA: n = 3; Vehicle: n = 2, FRAx597: n = 3, with n representing the number of analyzed tumors per group) as measured by the percentage of human CD45+ cells in the respective organ. Error bars represent mean ± SEM. Statistical significance was calculated using a two‐tailed paired t‐test with Welch's correction. P‐value: < 0.05 (*).
- D–F
H&E and IHC analyses of Hut78‐derived tumors treated with JPX‐0750 (n = 3), IQDMA (n = 2) or vehicle (n = 4), and FRAx597 (n = 3) or vehicle (n = 2), and stained with (D) H&E and (E) cleaved caspase 3 (CC3) to detect cell death and (F) CD31 vessel marker, with n representing the number of analyzed tumors per group. Pictures shown are from contiguous sections. Dotted rectangles indicate magnified areas. Scale bars, 200, 100, and 25 μm. Violin plots show the perimeter of the annotated tumor cell infiltration/expansion region into the intradermal and subcutaneous region of the skin, as well as quantification of the percentage of CC3+ cells in the tissue. CD31 staining was quantified as raw counts of vessels with lumen. Statistical significance was calculated using a two‐tailed paired t‐test with Welch's correction. P‐value: < 0.05 (*), 0.0001 (****). The bold dashed line in the middle of the violin plot denotes the median value, while the thin dotted lines denote the interquartile range.
References
-
- Agar NS, Wedgeworth E, Crichton S, Mitchell TJ, Cox M, Ferreira S, Robson A, Calonje E, Stefanato CM, Wain EM (2010) Survival outcomes and prognostic factors in mycosis fungoides/Sézary syndrome: validation of the revised International Society for Cutaneous Lymphomas/European Organisation for Research and Treatment of Cancer staging proposal. J Clin Oncol 28: 4730–4739 - PubMed
Publication types
MeSH terms
Substances
Grants and funding
LinkOut - more resources
Full Text Sources
Miscellaneous
