. 2022 Nov 7:11:e62087.
doi: 10.7554/eLife.62087.

Super-resolution imaging uncovers the nanoscopic segregation of polarity proteins in epithelia

Affiliations

Super-resolution imaging uncovers the nanoscopic segregation of polarity proteins in epithelia

Pierre Mangeol et al. Elife. .

Abstract

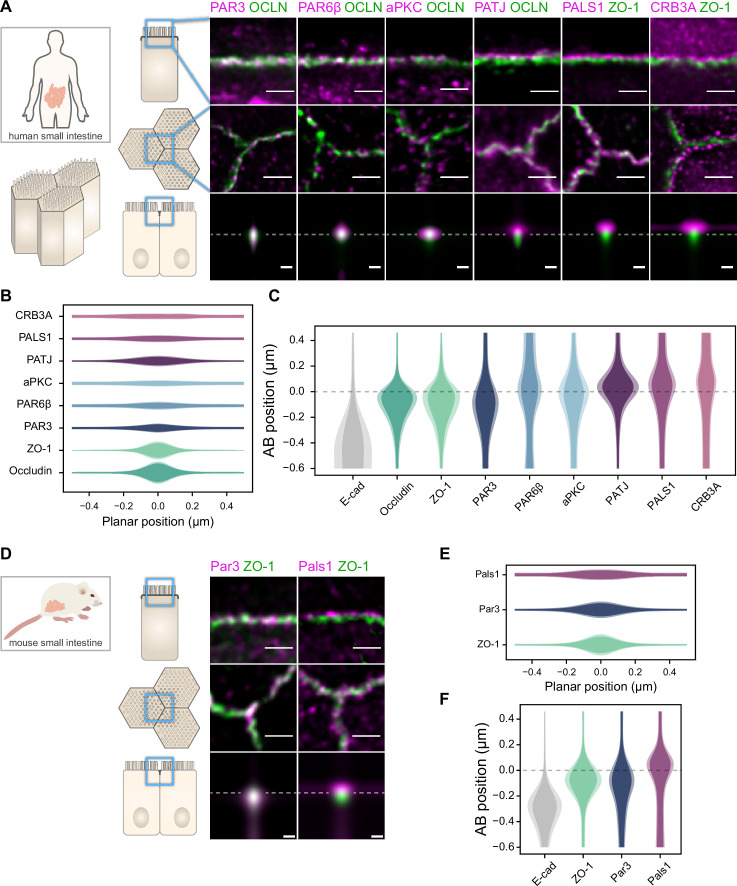
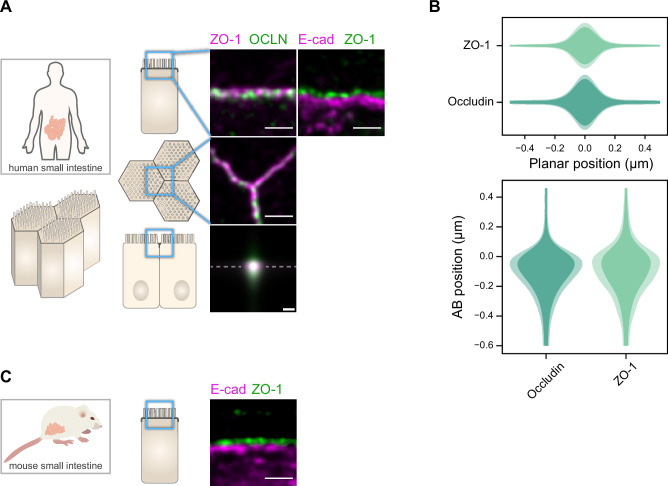
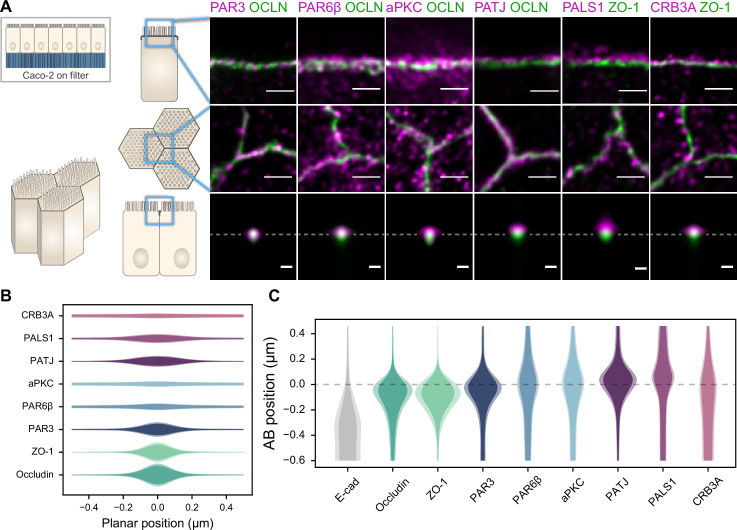
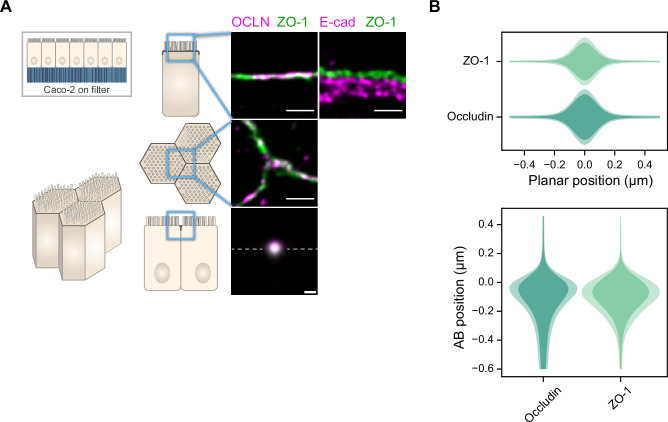
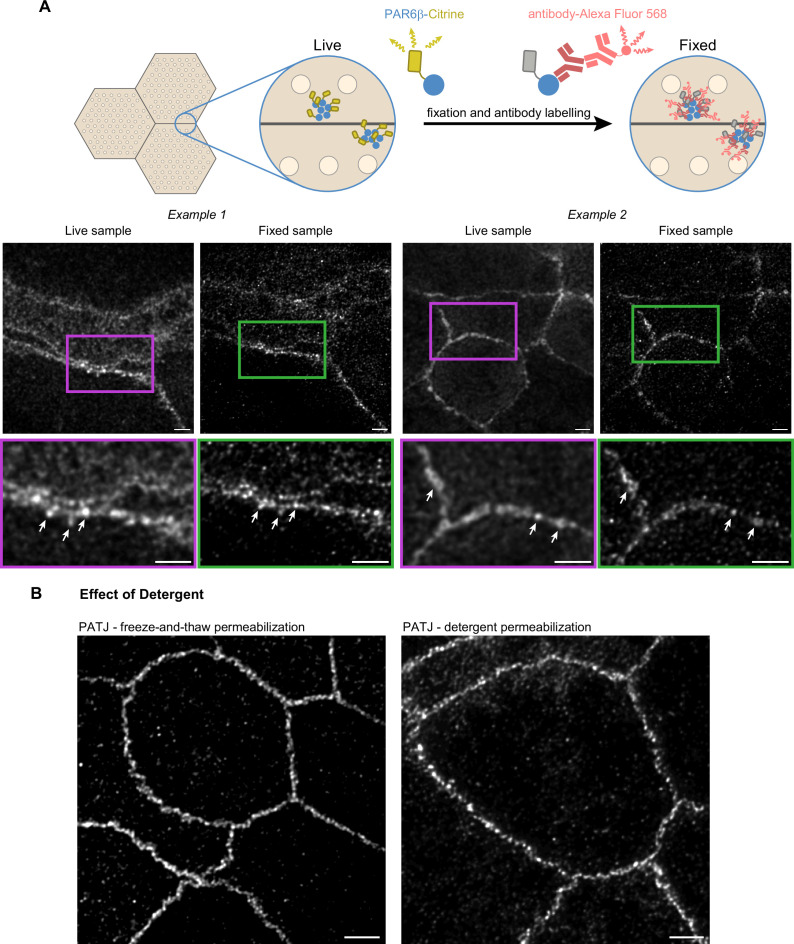
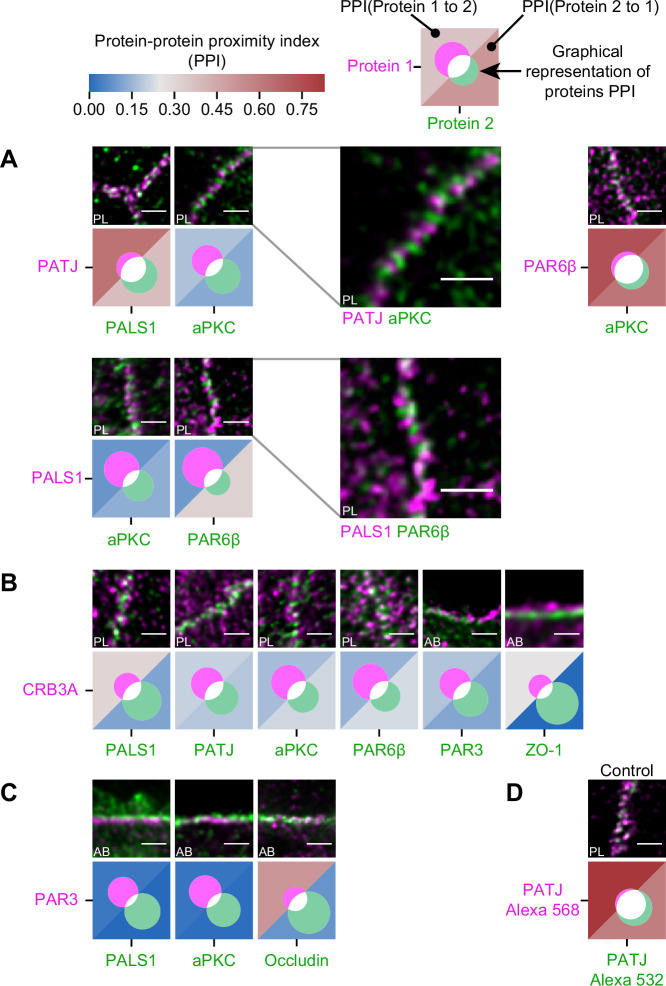
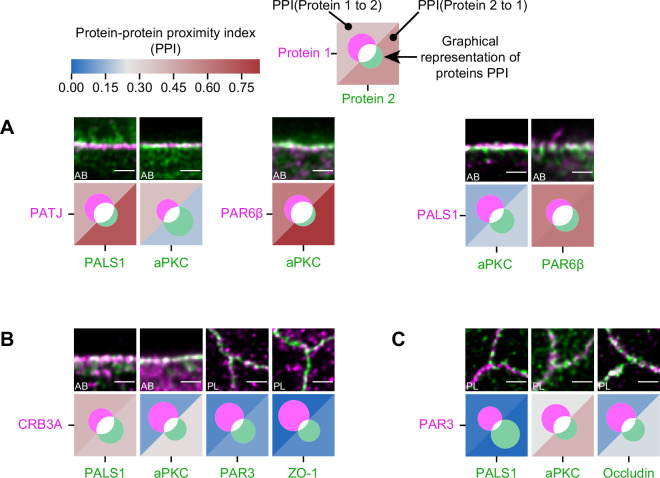
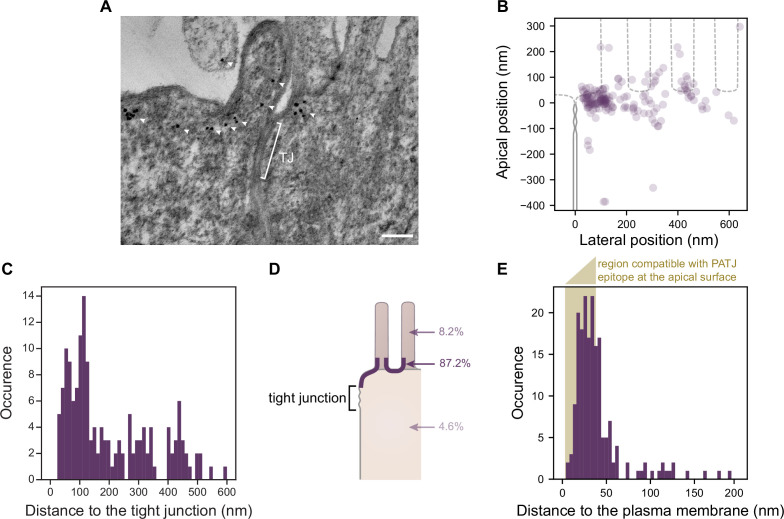
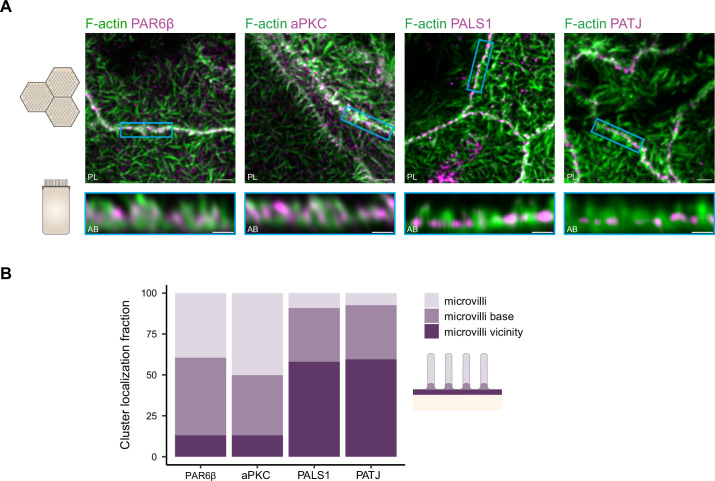
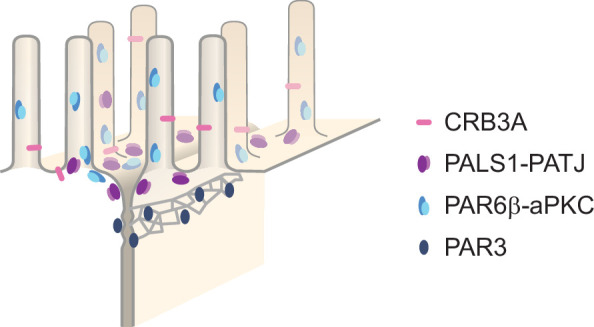
Epithelial tissues acquire their integrity and function through the apico-basal polarization of their constituent cells. Proteins of the PAR and Crumbs complexes are pivotal to epithelial polarization, but the mechanistic understanding of polarization is challenging to reach, largely because numerous potential interactions between these proteins and others have been found, without a clear hierarchy in importance. We identify the regionalized and segregated organization of members of the PAR and Crumbs complexes at epithelial apical junctions by imaging endogenous proteins using stimulated-emission-depletion microscopy on Caco-2 cells, and human and murine intestinal samples. Proteins organize in submicrometric clusters, with PAR3 overlapping with the tight junction (TJ) while PALS1-PATJ and aPKC-PAR6β form segregated clusters that are apical of the TJ and present in an alternated pattern related to actin organization. CRB3A is also apical of the TJ and partially overlaps with other polarity proteins. Of the numerous potential interactions identified between polarity proteins, only PALS1-PATJ and aPKC-PAR6β are spatially relevant in the junctional area of mature epithelial cells, simplifying our view of how polarity proteins could cooperate to drive and maintain cell polarity.

Keywords: Caco-2 cells; STED; cell biology; cell polarity; human; human intestine; mouse; polarity proteins.

Plain language summary

Many of our organs, including the lungs and the intestine, are lined with a single layer of cells that separate the inside of the organ from the surrounding environment inside the body. These so-called epithelial cells form a tightly packed barrier and have a very characteristic organization. The apical surface faces the outside world, while the basal surface faces the inner tissues. These different interfaces are reflected in the organization of the cells themselves. The shape, composition, and role of the apical cell surface are distinct from those of the basal surface, and they also contain different proteins. In some epithelial cells, the apical surface specializes and forms protruding structures called microvilli. Thus, epithelial cells are said to be polarized along this apical–basal axis. Over the last 30 years, many labs have identified and studied which proteins help epithelial cells become and stay polarized. Previous biochemical experiments showed that these so-called polarity proteins interact with each other in many different ways. But it remains unclear whether some of these interactions are more important than others, and where exactly in the apical or basal membranes these interactions take place. Mangeol et al. used super-resolution microscopy to observe the polarity of proteins at the apical membranes of both human and mouse cells from the small intestine to answer these questions. They focused on areas called tight junctions, where the intestinal cells connect with each other to form the barrier between the outside and the inside. First, all the polarity proteins clustered together in various formations, they were not distributed uniformly. For example, one protein called PAR3 was at the level of the tight junctions, whereas other proteins were closer to the apical surface and the outside world. Only two pairs of proteins – PAR6 and aPKC, and PALS1 and PATJ – formed stable clusters with each other. This finding was unexpected because previous biochemical experiments had predicted multiple interactions. Third, the PALS1/PATJ complexes stayed at the bottom of the microvilli protrusions, whereas PAR6/aPKC were inside the protrusions. Taken together, these experiments reveal a detailed snapshot of how the polarity proteins themselves are organized at the apical surface of epithelial cells. Future work will be able to address how these protein complexes behave over time.


Conflict of interest statement

PM, DM, FR, JC, PL, AL No competing interests declared

Figures

Figure 1.
Figure 1.. Polarity proteins localize in separate subdomains in the tight junction (TJ) region in human (A–C) and murine (D–F) small intestine biopsies.
(A, D) STED images of protein localization in the TJ area. TJ proteins in green, polarity proteins in magenta. Top row: apico-basal orientation; middle row: planar orientation; bottom row: estimates of average protein localization in the apico-basal orientation perpendicular to the junction, obtained by multiplying average localizations estimated in (B) and (C) for human biopsies and (E) and (F) for murine biopsies. Top row and middle row, scale bar 1 µm; bottom row, scale bar 200 nm. (B, E) Average localization of polarity proteins in the planar orientation, obtained by measuring the intensity profile of proteins perpendicular to the junction, using the TJ protein position as a reference. (C, F) Average localization of polarity proteins in the apico-basal orientation, obtained by measuring the intensity profile of proteins along the apico-basal orientation, using the TJ protein position as a reference. In (B, C, E, F), on a given position dark colors represent average intensity values, and lighter colors the average added with the standard deviation. We used three biological replicates for each human and mouse experiment (details in Figure 1—source data 1). Details of the analysis are specified in the ‘Materials and methods’ section.
Figure 1—figure supplement 1.
Figure 1—figure supplement 1.. Localization of ZO-1 vs. Occludin in the human small intestine and E-cadherin vs. ZO-1 in human and mouse small intestine.
(A) Stimulated‐emission‐depletion (STED) images of the tight junction (TJ) proteins ZO-1 and Occludin, and E-cadherin in the TJ area of human small intestine samples. Top row: apico-basal orientation; middle row: planar orientation; bottom row: estimates of average protein localization in the apico-basal orientation perpendicular to the junction, obtained by multiplying average localizations estimated in (B) for human biopsies. Top row and middle row, scale bar 1 µm; bottom row, scale bar 200 nm. (B) Average localization of ZO-1 and Occludin in the planar orientation (top) and apico-basal orientation (bottom), obtained by measuring the intensity profile of proteins perpendicular to the junction, using the ZO-1 position as a reference. On a given position, dark colors represent average intensity values, and lighter colors are the average added with the standard deviation. Details of the analysis are specified in the ‘Materials and methods’ section. (C) STED images of ZO-1 and E-cadherin in the TJ area in the apico-basal orientation of murine small intestine samples. Scale bar: 1 µm.
Figure 2.
Figure 2.. Polarity proteins localize in separate subdomains in the tight junction (TJ) region in Caco-2 cells.
(A) Stimulated‐emission‐depletion (STED) images of protein localization in the TJ area. TJ proteins in green, polarity proteins in magenta. Top row: apico-basal orientation (obtained from cryo-sectioning cells grown on filter); middle row: planar orientation; bottom row: estimates of average protein localization in the apico-basal orientation perpendicular to the junction, obtained by multiplying average localizations estimated in (B) and (C). Top row and middle row, scale bar 1 µm; bottom row, scale bar 200 nm. (B) Average localization of polarity proteins in the planar orientation obtained by measuring the intensity profile of proteins perpendicular to the junction, using the TJ protein position as a reference. (C) Average localization of polarity proteins in the apico-basal orientation obtained by measuring the intensity profile of proteins along the apico-basal orientation, using the TJ protein position as a reference. In (B, C), on a given position dark colors represent average intensity values, and lighter colors the average added with the standard deviation. We used three cell culture replicates (details in Figure 1—source data 1). Details of the analysis are specified in the ‘Materials and methods’ section.
Figure 2—figure supplement 1.
Figure 2—figure supplement 1.. Localization of ZO-1, Occludin, and E-cadherin ZO-1 Caco-2 cells.
(A) Stimulated‐emission‐depletion (STED) images of tight junction (TJ) proteins ZO-1 and Occludin, and E-cadherin in the TJ area of Caco-2 cells. Top row: apico-basal orientation; middle row: planar orientation; bottom row: estimates of average protein localization in the apico-basal orientation perpendicular to the junction, obtained by multiplying average localizations estimated in (B). Top row and middle row, scale bar 1 µm; bottom row, scale bar 200 nm. (B) Average localization of ZO-1 and Occludin in the planar orientation (top) and apico-basal orientation (bottom), obtained by measuring the intensity profile of proteins perpendicular to the junction, using the ZO-1 position as a reference. On a given position, dark colors represent average intensity values, and lighter colors are the average added with the standard deviation. Details of the analysis are specified in the ‘Materials and methods’ section.
Figure 3.
Figure 3.. Confirmation of the cluster organization by alternative methods.
(A) Two examples of stimulated‐emission‐depletion (STED) images obtained on living Caco-2 cells expressing PAR6β-Citrine that were then fixed and immunolabeled and zoom on junctions (insets). Imaging of the same cells shows that clusters are observed in live and fixed conditions (arrows pointing at the same clusters in both conditions). (B) Images showing that permeabilization using freeze-and-thaw or detergent lead to very similar results, showing that detergents are not the cause of protein clustering. Scale bars: 2 µm. We obtained the same conclusions on three independent cell culture replicates.
Figure 4.
Figure 4.. Proximity analysis of polarity proteins redefines protein complexes.
The analysis is carried out in Caco-2 cells, where we used the concept of protein–protein proximity index (PPI) introduced by Wu et al., 2010, indicating the proximity of two different protein populations. PPI of 0 indicates no proximity (or no colocalization), and PPI of 1 indicates perfect proximity (or perfect colocalization); intermediate values give an estimate of the fraction of a given protein being in close proximity (or colocalize) with another one. Here, the result of the proximity analysis is represented graphically with color-coded values and Venn diagrams as depicted on the top of the figure (details in ‘Materials and methods’). The analysis has been carried out on apico-basal (AB) or planar (PL) orientation images to minimize apparent colocalization due to overlapping in different planes; this is reported in the representative image of each experiment. (A) Proximity analysis for PATJ, PALS1, aPKC, and PAR6β and corresponding representative images. Zoomed images (PATJ/aPKC and PALS1/PAR6β) illustrate the segregation of these proteins. (B) Proximity analysis for CRB3A and the other polarity proteins. (C) Proximity analysis for PAR3 with PALS1, aPKC, and Occludin. (D) Control experiment with PATJ labeled with an Alexa 532 secondary antibody and an Alexa 568 tertiary antibody. We used three cell culture replicates for each protein pair (details in Figure 4—source data 1). The details of the analysis are specified in ‘Materials and methods.’ Scale bars: 1 µm.
Figure 4—figure supplement 1.
Figure 4—figure supplement 1.. Protein–protein proximity index (PPI) analysis on the orientations can lead to artificially higher PPI because of higher protein overlap.
(A) Proximity analysis in the apico-basal orientation for PATJ, PALS1, aPKC, and PAR6β and corresponding representative images. (B) Proximity analysis in the apico-basal orientation for CRB3A and some of the other polarity proteins. (C) Proximity analysis for PAR3 with PALS1, aPKC, and Occludin in the planar orientation.
Figure 5.
Figure 5.. Electron tomography shows that PATJ localizes as clusters at the plasma membrane apically of the tight junction (TJ) in Caco-2 cells.
(A) Representative image of PATJ labeled with gold particles (arrowheads pointing at single particles or clusters of particles). The bracket with TJ indicates the TJ. Minimum intensity projection of a 150-nm-thick tomogram, scale bar: 100 nm. (B) Localization of gold particles labeling PATJ with respect to the TJ both in the apico-basal and lateral directions. (C) Distance between the center of gold particle labels and the TJ. (D) Summary of gold particles localization in the microvilli, in the vicinity of the plasma membrane and the cytoplasm. (E) Distance between gold particles and the apical surface. In amber, the region of distances compatible with PATJ epitope being at the apical surface, between 3 nm (radius of gold particles) and 37 nm (size of the primary and gold-labeled secondary antibody combination added with the presumed size of PALS1; Li et al., 2014). Tomograms of 300 nm in thickness of 12 junctions were used to extract the position of 169 gold particles labeling PATJ proteins. These junctions were obtained from one cell culture.
Figure 6.
Figure 6.. Organization of PAR6β, aPKC, PATJ, and PALS1, with respect to the actin cytoskeleton.
(A) 3D stimulated‐emission‐depletion (STED) imaging of cells labeled with Phalloidin and antibodies against polarity proteins with (top) top view and (bottom) side view on cell–cell junctions. Scale bars: top 2 µm, bottom 1 µm. (B) Localization analysis of PAR6β, aPKC, PATJ, and PALS1 vs. microvilli organization. We used three independent cell cultures. Detailed counts of clusters are given in Figure 6—source data 1.
Figure 7.
Figure 7.. Organizational model of polarity proteins in the tight junction (TJ) region.
Appendix 1—figure 1.
Appendix 1—figure 1.. Characterization of α-CRB3 antibody.
(A) Immunoblot analysis of CRB3 expression level in CT (siCT) and CRB3 knock-down (siCRB3) Caco-2 cells with the rat monoclonal α-CRB3 antibody. α-Tubulin is used as a loading control. (B) Quantification of CRB3 in siCT and siCRB3 cells. (C) Confocal imaging of siCT and siCRB3 Caco-2 cells labeled with the rat monoclonal α-CRB3 antibody. Scale bars: 20 µm.
Appendix 1—figure 2.
Appendix 1—figure 2.. Characterization of the CRISPR/Cas9 Caco-2Par6β::Citrine cells.
(A) Donor Par6β-Citrine sequence: letters in red, universal guide sequence used by Cas9 to release the plasmid repair matrix into transfected cells; in black, sequence of homology arms; in green, GS peptide linker (and BamHI site to replace the Citrine sequence with another cDNA); in black underlined, Citrine sequence; in bold red, stop codon; in bold violet, a sequence including a STOP codon in each reading phase; in green highlight, sequence matching the gRNA. Mutations (in bold lowercase) were introduced in the noncoding part so that the gPARD6 guide could not lead to a cut (by Cas9) in the donor or modified genomic sequence after insertion. (B) Immunoblot analysis of PAR6β expression level in wild-type and Caco-2Par6β::Citrine Caco-2 cells. α-Tubulin is used as a loading control. (C) Immunoblot analysis of PAR6β-Citrine expression level in wild-type and Caco-2Par6β::Citrine cells Caco-2 cells. B and C deposits were independent.

Similar articles

Cited by

References

    1. Afonso C, Henrique D. Par3 acts as a molecular organizer to define the apical domain of chick neuroepithelial cells. Journal of Cell Science. 2006;119:4293–4304. doi: 10.1242/jcs.03170. - DOI - PubMed
    1. Alarcon VB. Cell polarity regulator PARD6B is essential for trophectoderm formation in the preimplantation mouse embryo. Biology of Reproduction. 2010;83:347–358. doi: 10.1095/biolreprod.110.084400. - DOI - PMC - PubMed
    1. Assémat E, Bazellières E, Pallesi-Pocachard E, Le Bivic A, Massey-Harroche D. Polarity complex proteins. Biochimica et Biophysica Acta. 2008;1778:614–630. doi: 10.1016/j.bbamem.2007.08.029. - DOI - PubMed
    1. Bazellières E, Aksenova V, Barthélémy-Requin M, Massey-Harroche D, Le Bivic A. Role of the Crumbs proteins in ciliogenesis, cell migration and actin organization. Seminars in Cell & Developmental Biology. 2018;81:13–20. doi: 10.1016/j.semcdb.2017.10.018. - DOI - PubMed
    1. Belahbib H, Renard E, Santini S, Jourda C, Claverie JM, Borchiellini C, Le Bivic A. New genomic data and analyses challenge the traditional vision of animal epithelium evolution. BMC Genomics. 2018;19:393. doi: 10.1186/s12864-018-4715-9. - DOI - PMC - PubMed

Publication types