

Polychlorinated biphenyls alter hepatic m6A mRNA methylation in a mouse model of environmental liver disease
- PMID: 36341798
- PMCID: PMC10120843
- DOI: 10.1016/j.envres.2022.114686
Polychlorinated biphenyls alter hepatic m6A mRNA methylation in a mouse model of environmental liver disease
Abstract
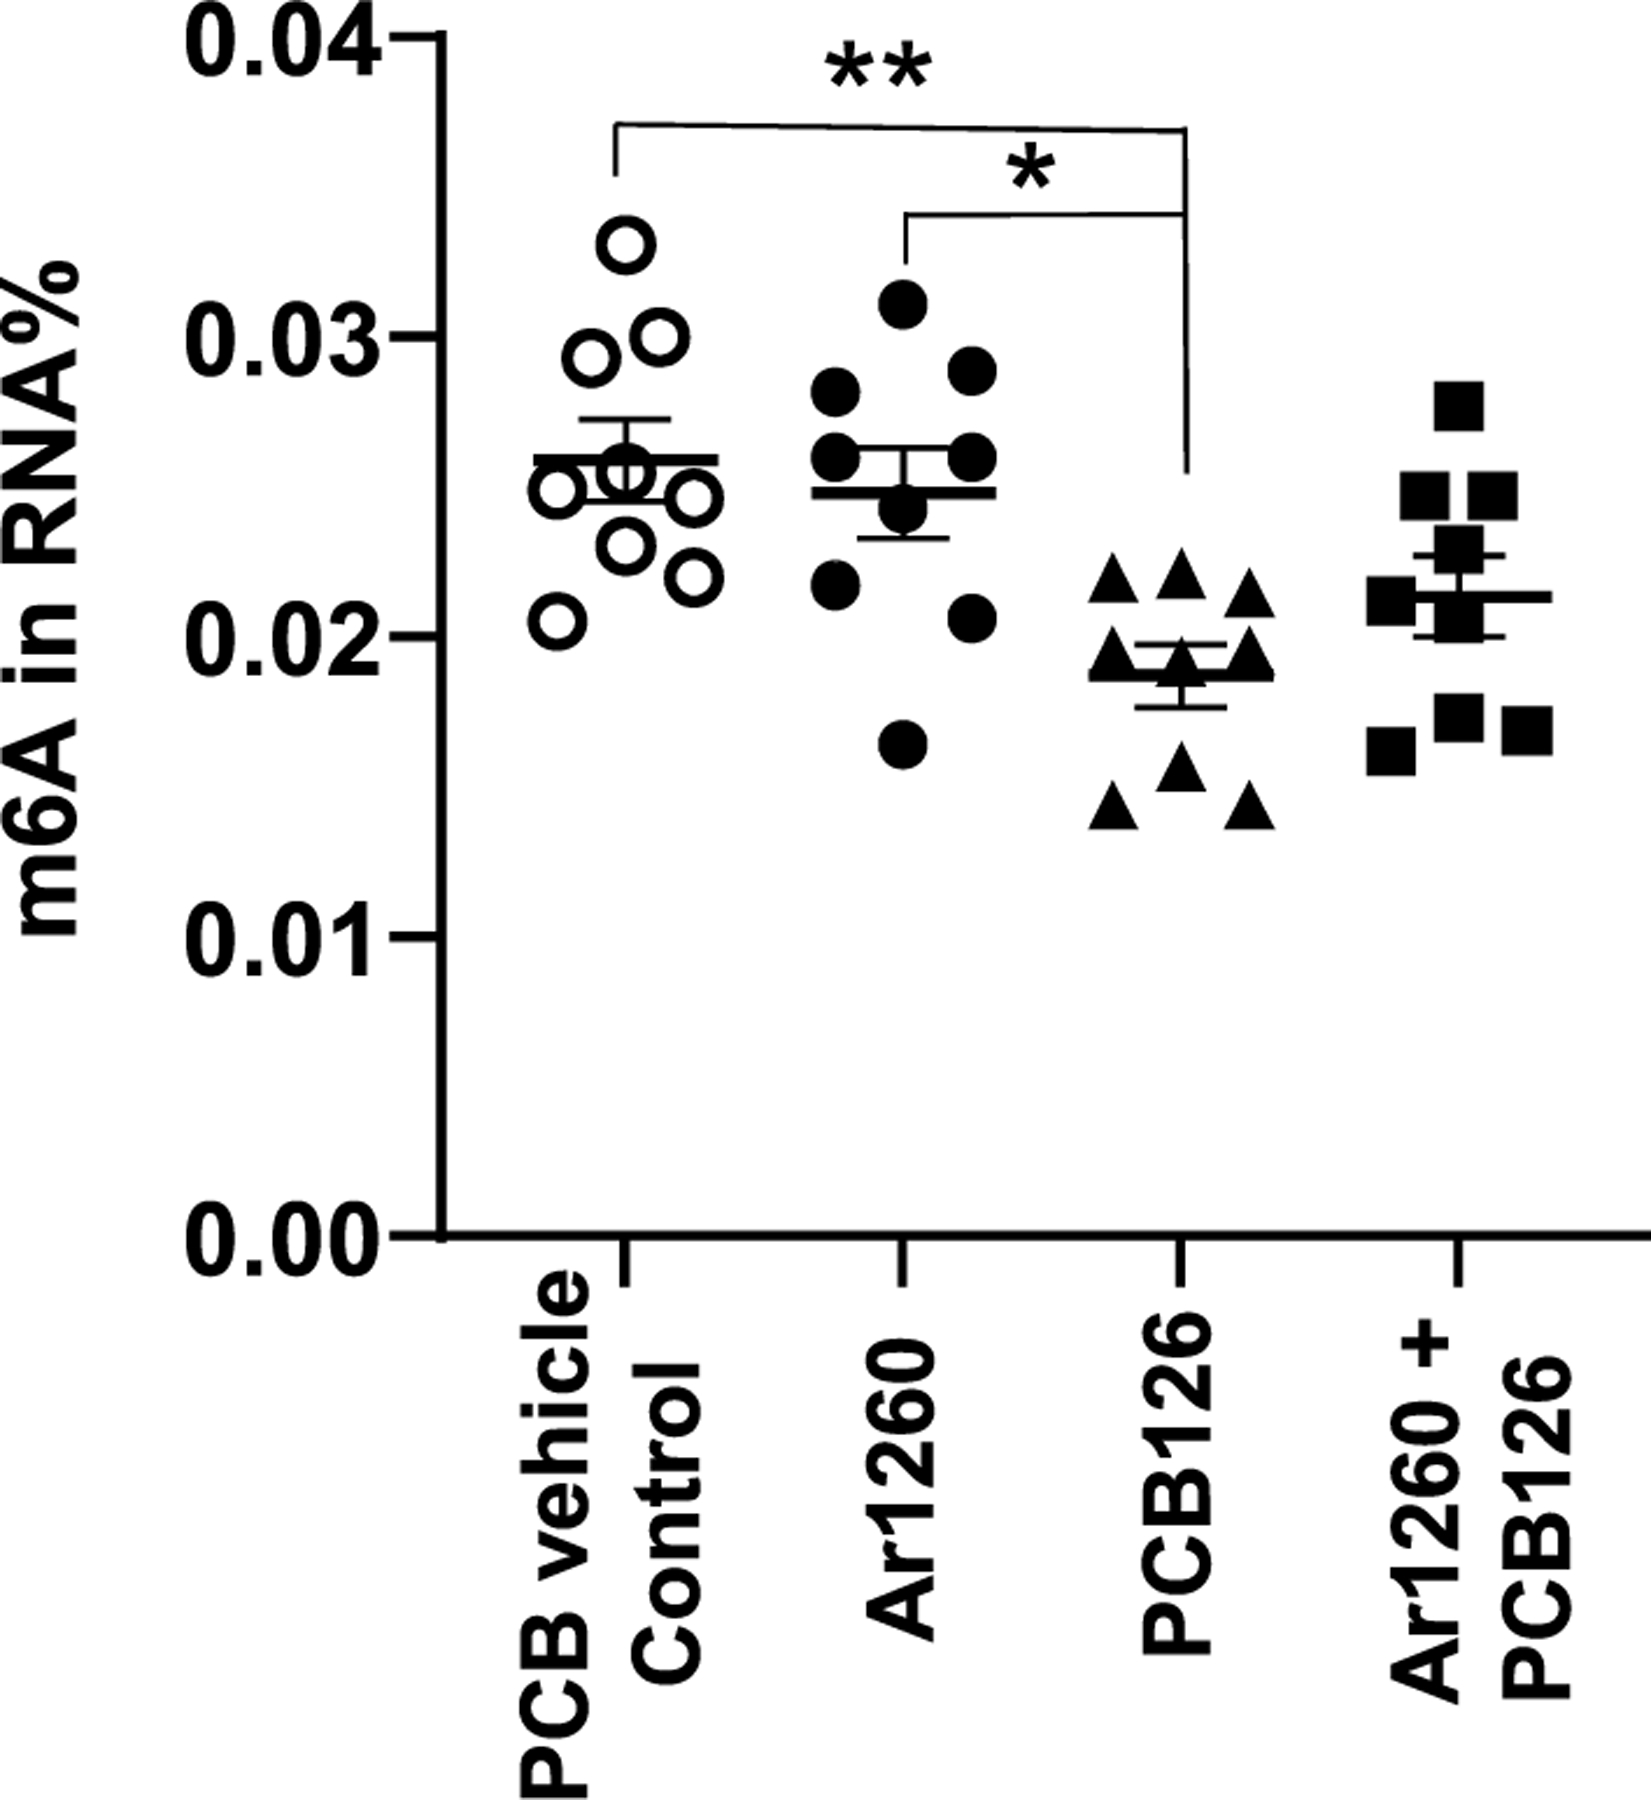
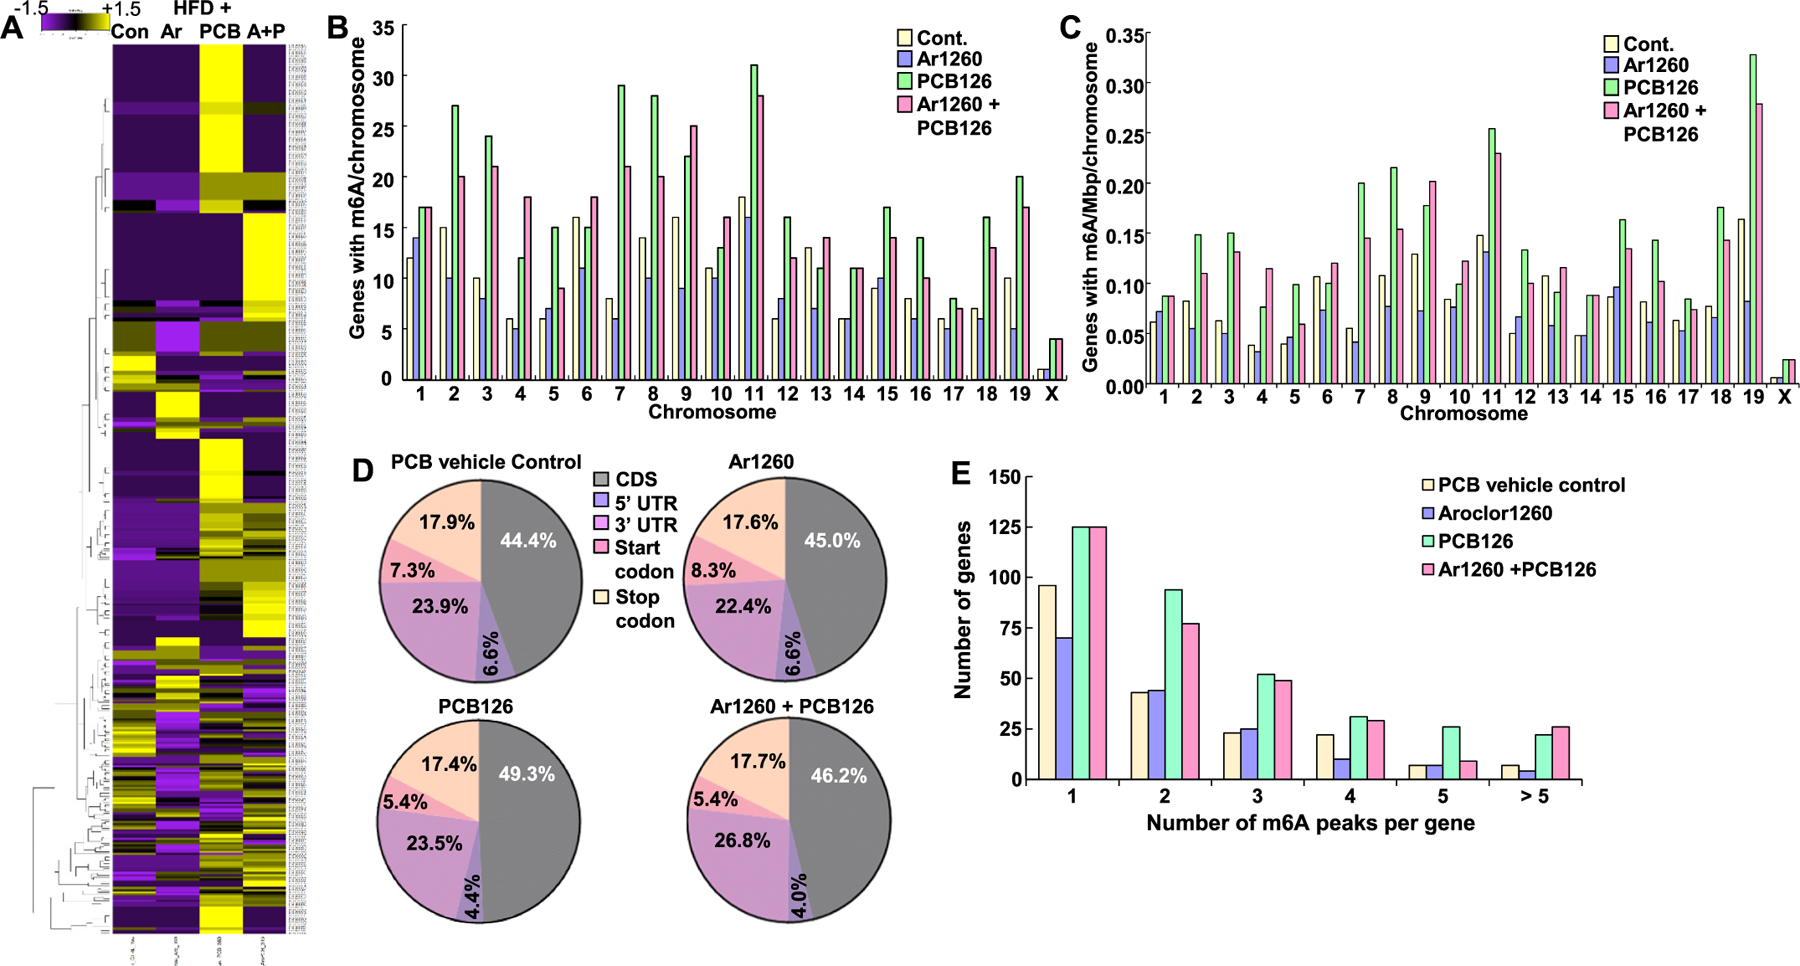
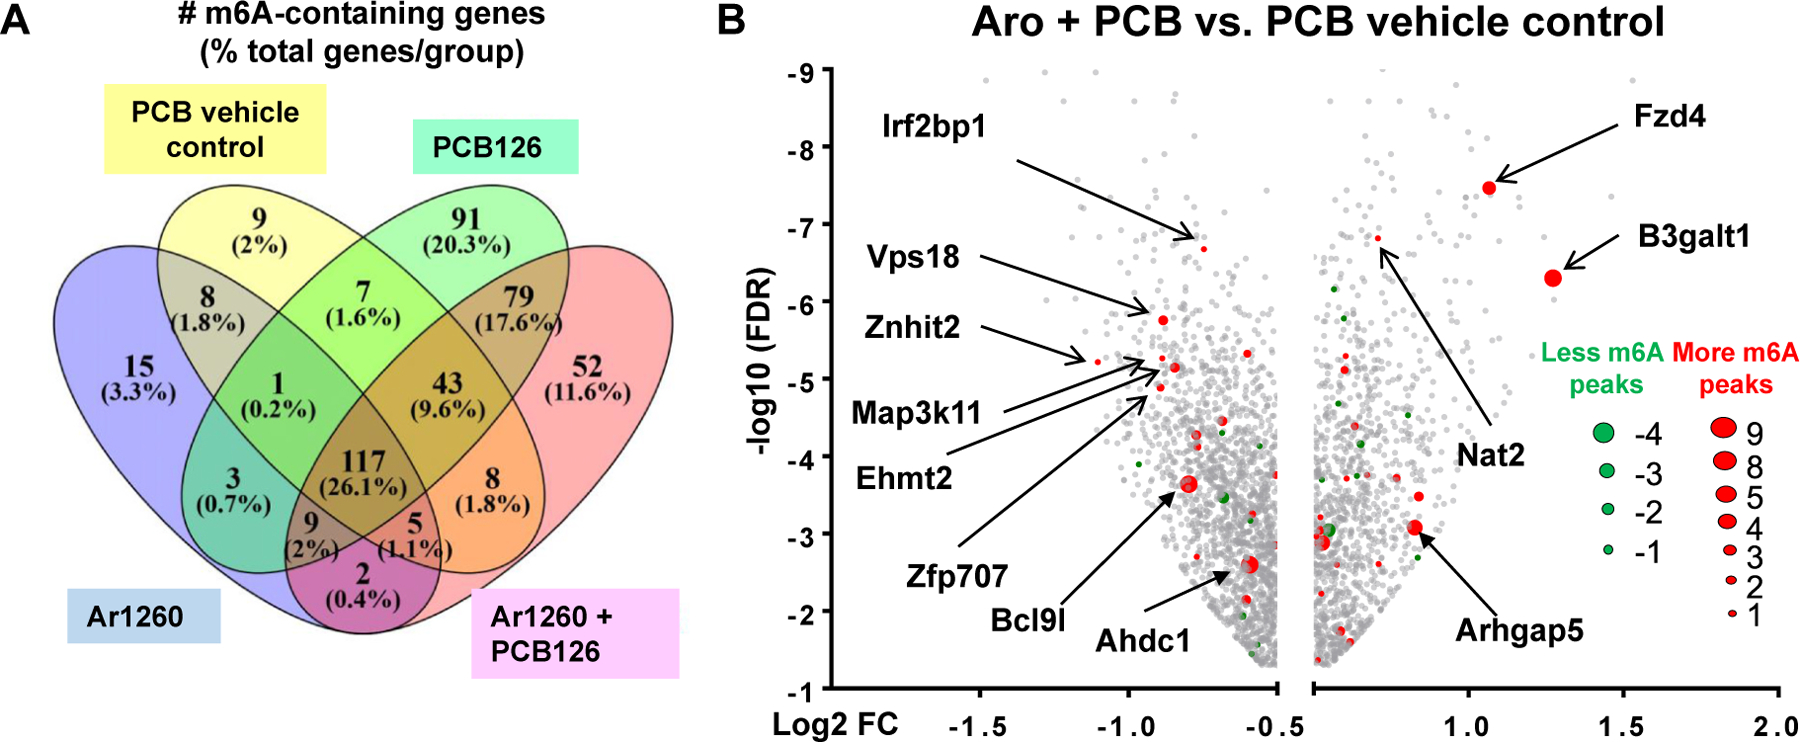
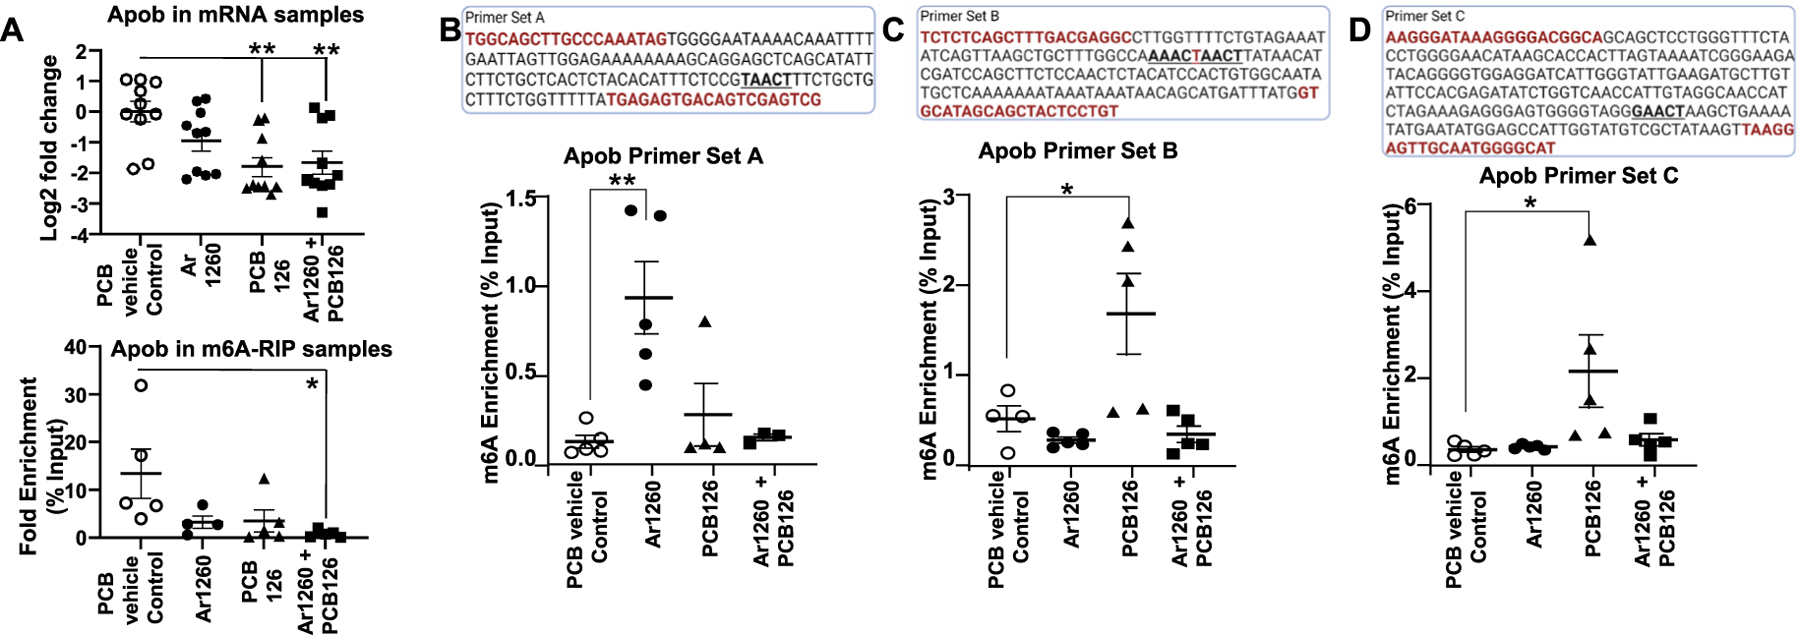
Exposure to polychlorinated biphenyls (PCBs) has been associated with liver injury in human cohorts and with nonalcoholic steatohepatitis (NASH) in mice fed a high fat diet (HFD). N (6)-methyladenosine (m6A) modification of mRNA regulates transcript fate, but the contribution of m6A modification on the regulation of transcripts in PCB-induced steatosis and fibrosis is unknown. This study tested the hypothesis that PCB and HFD exposure alters the levels of m6A modification in transcripts that play a role in NASH in vivo. Male C57Bl6/J mice were fed a HFD (12 wks) and administered a single oral dose of Aroclor1260, PCB126, or Aroclor1260 + PCB126. Genome-wide identification of m6A peaks was accomplished by m6A mRNA immunoprecipitation sequencing (m6A-RIP) and the mRNA transcriptome identified by RNA-seq. Exposure of HFD-fed mice to Aroclor1260 decreased the number of m6A peaks and m6A-containing genes relative to PCB vehicle control whereas PCB126 or the combination of Aroclor1260 + PCB126 increased m6A modification frequency. ∼41% of genes had one m6A peak and ∼49% had 2-4 m6A peaks. 117 m6A peaks were common in the four experimental groups. The Aroclor1260 + PCB126 exposure group showed the highest number (52) of m6A-peaks. qRT-PCR confirmed enrichment of m6A-containing fragments of the Apob transcript with PCB exposure. A1cf transcript abundance, m6A peak count, and protein abundance was increased with Aroclor1260 + PCB126 co-exposure. Irrespective of the PCB type, all PCB groups exhibited enriched pathways related to lipid/lipoprotein metabolism and inflammation through the m6A modification. Integrated analysis of m6A-RIP-seq and mRNA-seq identified 242 differentially expressed genes (DEGs) with increased or reduced number of m6A peaks. These data show that PCB exposure in HFD-fed mice alters the m6A landscape offering an additional layer of regulation of gene expression affecting a subset of gene responses in NASH.
Keywords: Epitranscriptome; High fat diet; Liver; PCBs; Readers; Writers; m6A.
Copyright © 2022 Elsevier Inc. All rights reserved.
Conflict of interest statement
Declaration of competing interest The authors declare that they have no known competing financial interests or personal relationships that could have appeared to influence the work reported in this paper.
Figures

Similar articles
-
Changes in m6A in Steatotic Liver Disease.Genes (Basel). 2023 Aug 19;14(8):1653. doi: 10.3390/genes14081653. Genes (Basel). 2023. PMID: 37628704 Free PMC article. Review.
-
Altered splicing factor and alternative splicing events in a mouse model of diet- and polychlorinated biphenyl-induced liver disease.Environ Toxicol Pharmacol. 2023 Oct;103:104260. doi: 10.1016/j.etap.2023.104260. Epub 2023 Sep 7. Environ Toxicol Pharmacol. 2023. PMID: 37683712 Free PMC article.
-
Multiomics analysis of the impact of polychlorinated biphenyls on environmental liver disease in a mouse model.Environ Toxicol Pharmacol. 2022 Aug;94:103928. doi: 10.1016/j.etap.2022.103928. Epub 2022 Jul 6. Environ Toxicol Pharmacol. 2022. PMID: 35803474
-
Recombinant FGF21 Attenuates Polychlorinated Biphenyl-Induced NAFLD/NASH by Modulating Hepatic Lipocalin-2 Expression.Int J Mol Sci. 2022 Aug 10;23(16):8899. doi: 10.3390/ijms23168899. Int J Mol Sci. 2022. PMID: 36012166 Free PMC article.
-
A Comparison of the Gene Expression Profiles of Non-Alcoholic Fatty Liver Disease between Animal Models of a High-Fat Diet and Methionine-Choline-Deficient Diet.Molecules. 2022 Jan 27;27(3):858. doi: 10.3390/molecules27030858. Molecules. 2022. PMID: 35164140 Free PMC article. Review.
Cited by
-
m6A RNA modification pathway: orchestrating fibrotic mechanisms across multiple organs.Brief Funct Genomics. 2025 Jan 15;24:elae051. doi: 10.1093/bfgp/elae051. Brief Funct Genomics. 2025. PMID: 39756462 Free PMC article. Review.
-
Changes in m6A in Steatotic Liver Disease.Genes (Basel). 2023 Aug 19;14(8):1653. doi: 10.3390/genes14081653. Genes (Basel). 2023. PMID: 37628704 Free PMC article. Review.
-
Chronic Aroclor 1260 exposure alters the mouse liver proteome, selenoproteins, and metals in steatotic liver disease.Environ Toxicol Pharmacol. 2024 Apr;107:104430. doi: 10.1016/j.etap.2024.104430. Epub 2024 Mar 27. Environ Toxicol Pharmacol. 2024. PMID: 38552755 Free PMC article.
-
Altered splicing factor and alternative splicing events in a mouse model of diet- and polychlorinated biphenyl-induced liver disease.Environ Toxicol Pharmacol. 2023 Oct;103:104260. doi: 10.1016/j.etap.2023.104260. Epub 2023 Sep 7. Environ Toxicol Pharmacol. 2023. PMID: 37683712 Free PMC article.
-
Disruption of the mouse liver epitranscriptome by long-term aroclor 1260 exposure.Environ Toxicol Pharmacol. 2023 Jun;100:104138. doi: 10.1016/j.etap.2023.104138. Epub 2023 May 1. Environ Toxicol Pharmacol. 2023. PMID: 37137421 Free PMC article.
References
-
- Azar F, et al., 2020. Integration of miRNA-regulatory networks in hepatic stellate cells identifies TIMP3 as a key factor in chronic liver disease. Liver Int 40, 2021–2033. - PubMed
Publication types
MeSH terms
Substances
Grants and funding
LinkOut - more resources
Full Text Sources
Medical
Molecular Biology Databases
Miscellaneous
