. 2022 Nov 22;88(22):e0093922.
doi: 10.1128/aem.00939-22. Epub 2022 Nov 7.

Plasmids for Controlled and Tunable High-Level Expression in E. coli

Affiliations

Plasmids for Controlled and Tunable High-Level Expression in E. coli

Layla A Schuster et al. Appl Environ Microbiol. .

Abstract

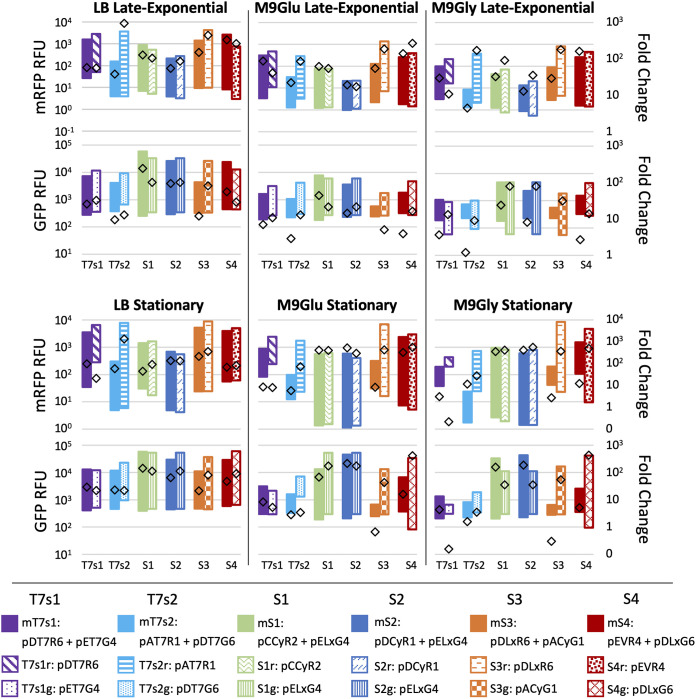
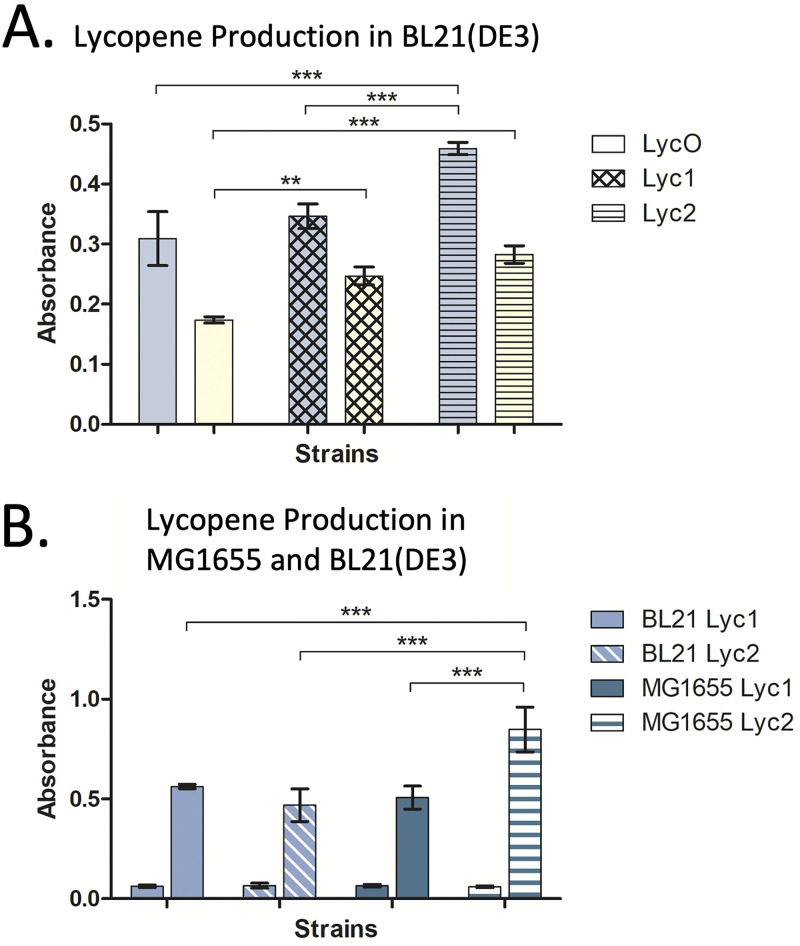
Controlled gene expression is crucial for engineering bacteria for basic and applied research. Inducible systems enable tight regulation of expression, wherein a small-molecule inducer causes the transcription factor to activate or repress transcriptional initiation. The T7 expression system is one of the most widely used inducible systems, particularly for high overexpression of proteins. However, it is well known that the highly active T7 RNA polymerase (RNAP) has several drawbacks, including toxicity to the host and substantial leaky expression in the absence of an inducer. Much work has been done to address these issues; current solutions require special strains or additional plasmids, making the system more complicated and less accessible. Here, we challenge the assumption that the T7 expression system is the best choice for obtaining high protein titers. We hypothesized that expression from strong inducible promoters expressed from high-copy plasmids could compete with expression levels obtained from T7 RNAP but that such promoters would possess improved control of transcription. Employing inducible systems from a toolbox we developed previously, we demonstrate that our plasmids consistently give higher outputs and greater fold changes over basal expression than the T7 system across rich and minimal media. In addition, we show that they outperformed the T7 system when we used an engineered metabolic pathway to produce lycopene. IMPORTANCE Genetic systems for protein overexpression are required tools in microbiological and biochemical research. Ideally, these systems include standardized genetic parts with predictable behavior, enabling the construction of stable expression systems in the host organism. Modularity of a genetic system is advantageous, so that the expression system can be easily moved into a host that best suits the needs of a given experiment. The T7 expression system lacks both predictability and stability and requires special host strains to function. Despite these limitations, it remains one of the most popular systems for protein overproduction. This study directly compared the T7 system to four inducible systems from our broad-host-range plasmid toolbox and demonstrated these alternative expression systems have distinct advantages over the T7. The systems are entirely plasmid-based and not constrained to a specific bacterial host, expanding the options for high-level protein expression across strains.

Keywords: T7 system; inducible expression; plasmid toolbox; protein overexpression.


Conflict of interest statement

The authors declare no conflict of interest.

Figures

FIG 1
FIG 1
Plasmid toolbox genetic parts, nomenclature, and induction results. (A) The plasmid toolbox included several options of each of four genetic parts, and plasmids were constructed according to a previously described combinatorial assembly strategy. Plasmid names were based on the codes provided, in the following order: origin, regulator, reporter, and marker. (B) Genetic parts of the Duet vectors (Novagen) included in this work. For induction experiments, mrfp or gfpmut3b was cloned into the first multiple-cloning site downstream of the T7lac promoter. (C, D, and E) Expression range of 28 plasmids in E. coli. Induction data are shown for all plasmid variants included in this study and are grouped to best show the effect of a single genetic part on overall expression, with plasmids grouped with only the origin part changed (C), with only the marker changed (D), and with only the promoter-regulator changed (E). For each plasmid, expression data are shown from the late-exponential (open bar) and stationary-phase (filled bar) time points. Bars represent the induction range of mRFP for each plasmid, with fluorescence in the absence of inducer plotted at the left end of each bar and induced expression plotted at the right end. Inducer concentrations are listed in Table S3 in the supplemental material. All measurements were in E. coli MG1655 grown in rich medium and are the averages of three technical replicates.
FIG 2
FIG 2
Expression across titrated inducer concentrations. Expression of mRFP in E. coli MG1655 strains containing plasmids pACyR1, pALxR1, pALlR1, and pAVR1 were induced with titrated inducer and measured at the late-exponential and stationary phase of growth. Graphs show average RFU induction data (horizontal bars) and calculated fold change (colored notches) within each data cluster. Vertical lines at each cluster represent the average fluorescence of uninduced samples. Inducer was serially diluted 5-fold from 10 mM (cumate, IPTG, Van) or 1 mM (OC6) across seven concentrations for each plasmid. All measurements in rich medium and are the averages of three technical replicates.
FIG 3
FIG 3
Stability over extended passages. Sparkline plots of percent change in fluorescence compared to baseline measurements for all replicates across four Duet vectors and eight toolbox plasmids. Plots are bound on the y axis by −100% and 20%. Data were excluded from graphing when growth of replicate was below a threshold OD of 0.2. For replicates that grew over the threshold after the first day of measurements, the first fluorescence measurement taken when cultures were above an OD of 0.2 was used as the baseline measurement. All plotted fluorescence was normalized to growth, and inducer concentrations are listed in Table S3.
FIG 4
FIG 4
Comparison between T7 and toolbox regulated promoters in E. coli BL21(DE3). Expression levels of mRFP regulated by the T7 system and toolbox systems regulated by LuxR, CymRAM, VanRAM, and LacI were measured from a set of eight pCDF plasmids in LB and minimal media with two different carbon sources. Charts show average RFU induction data (horizontal bars) and calculated fold change (horizontal notches) with measurements taken at late-exponential (open bar) and stationary (horizontally-striped bar) phases of growth. Horizontal bars represent the induction range of mRFP for each toolbox plasmid, with fluorescence in the absence of inducer plotted at the left end of each bar and induced expression plotted at the right end. The induction ranges from pCDFDuet-1 (pDT7R6) extend through the charts with dotted lines.
FIG 5
FIG 5
Expression data from induction experiments of single- and multiplasmid strains of E. coli BL21(DE3). Each strain group on the x axis shows induction data from the multiplasmid strain (solid bars) and single-plasmid strain (patterned bars), with mRFP readings at the top and GFP readings at the bottom of each time point pairing. Expression of GFP and mRFP from multiplasmid strains was induced simultaneously by both cognate inducers, and expression from single-plasmid strains was induced by the single cognate inducer. Vertical bars represent the induction range of mRFP or GFP for each strain, with fluorescence in the absence of inducer plotted at the bottom of each bar and induced expression plotted at the top. Fold change for each strain is represented by diamonds. Strains were tested in three medium types (LB, M9Glu, and M9Gly), and data were recorded at two time points. Inducer concentrations are listed in Table S3. All data are averages of triplicates.
FIG 6
FIG 6
Lycopene production in two strains of E. coli. Strains MG1655 and BL21(DE3) were tested for lycopene production via a two-plasmid system incorporating a pathway developed by Stephanopoulos et al. (A) Lycopene pathways were screened in BL21(DE3) on three different plasmid backbones, including p5T7-LYCipi-ggpps and pSEVA228-pro4IUPi (LycO), pALxLyc6 and pSEVA228-pro4IUPi (Lyc1), and pALxLyc6 and pRCyIUP2 (Lyc2). Induced lycopene production is shown in two medium conditions: minimal (blue bars) and rich (yellow bars). (B) Lyc1 and Lyc2 were compared in E. coli MG1655 and BL21(DE3) in minimal media. For each pair of bars, the first bar represents uninduced expression and the second shows induced expression. Lycopene was quantified through absorbance readings taken at 475 nm. Data shown are averages of three replicates, with standard deviations displayed. Statistical significance was determined with a two-way analysis of variance and Bonferroni’s multiple-comparison test. **, P < 0.01; ***, P < 0.001.

Similar articles

Cited by

References

    1. Hewitt L, McDonnell JM. 2004. Screening and optimizing protein production in E. coli. Methods Mol Biol 278:1–16. 10.1385/1-59259-809-9:001. - DOI - PubMed
    1. Tolia NH, Joshua-Tor L. 2006. Strategies for protein coexpression in Escherichia coli. Nat Methods 3:55–64. 10.1038/nmeth0106-55. - DOI - PubMed
    1. Gold L. 1990. Expression of heterologous proteins in Escherichia coli. Methods Enzymol 185:11–14. 10.1016/0076-6879(90)85004-8. - DOI - PubMed
    1. Adams BL. 2016. The next generation of synthetic biology chassis: moving synthetic biology from the laboratory to the field. ACS Synth Biol 5:1328–1330. 10.1021/acssynbio.6b00256. - DOI - PubMed
    1. Studier W, Rosenberg AH, Dunn JJ, Dubendorff JW. 1990. Use of T7 RNA polymerase to direct expression of cloned genes. Methods Enzymol 185:60–89. 10.1016/0076-6879(90)85008-c. - DOI - PubMed

Publication types

MeSH terms

Substances

LinkOut - more resources