. 2023 Jan 2;35(1):510-528.
doi: 10.1093/plcell/koac320.

A plastid nucleoside kinase is involved in inosine salvage and control of purine nucleotide biosynthesis

Affiliations

A plastid nucleoside kinase is involved in inosine salvage and control of purine nucleotide biosynthesis

Xiaoguang Chen et al. Plant Cell. .

Abstract

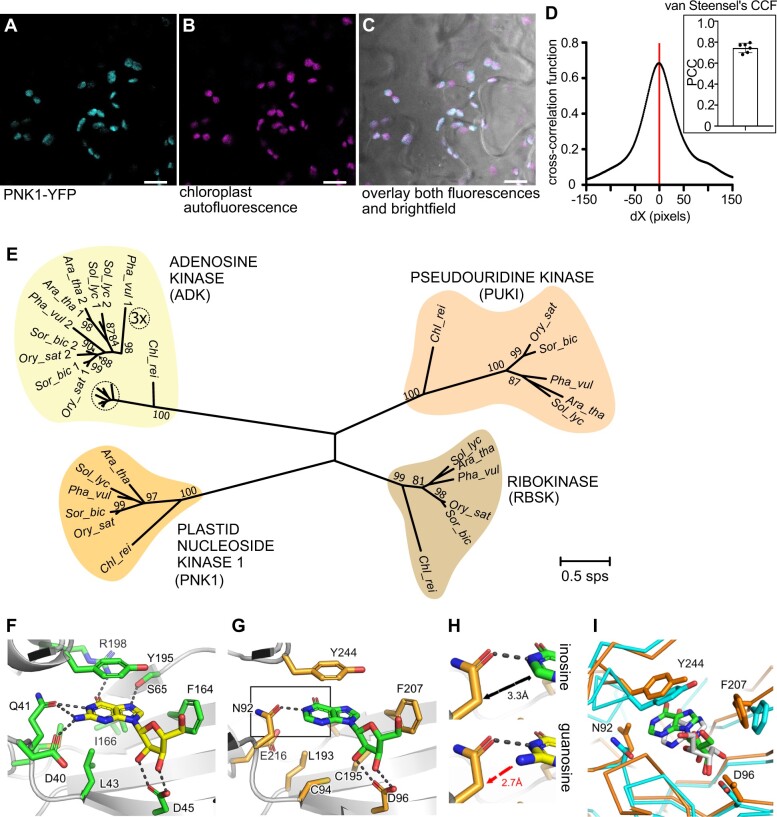
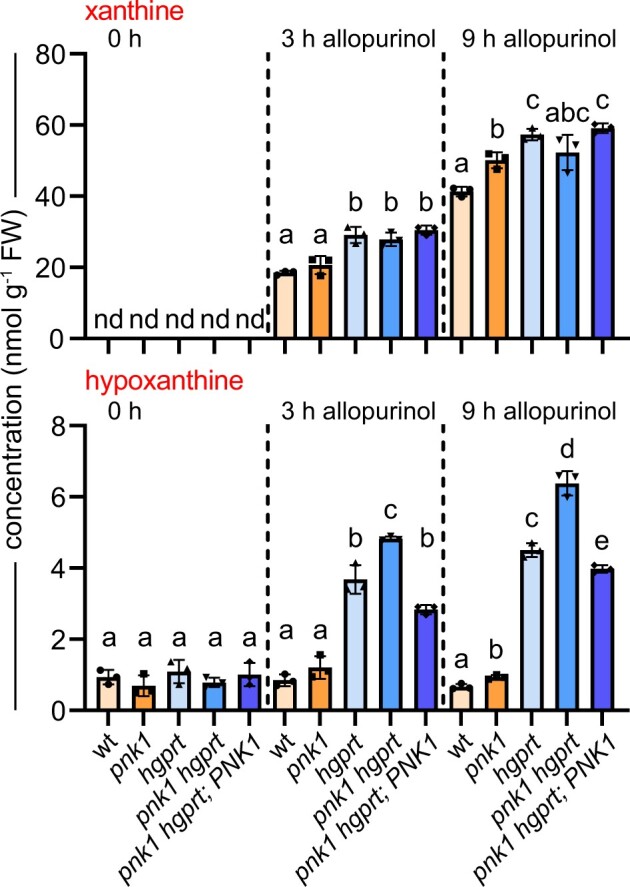
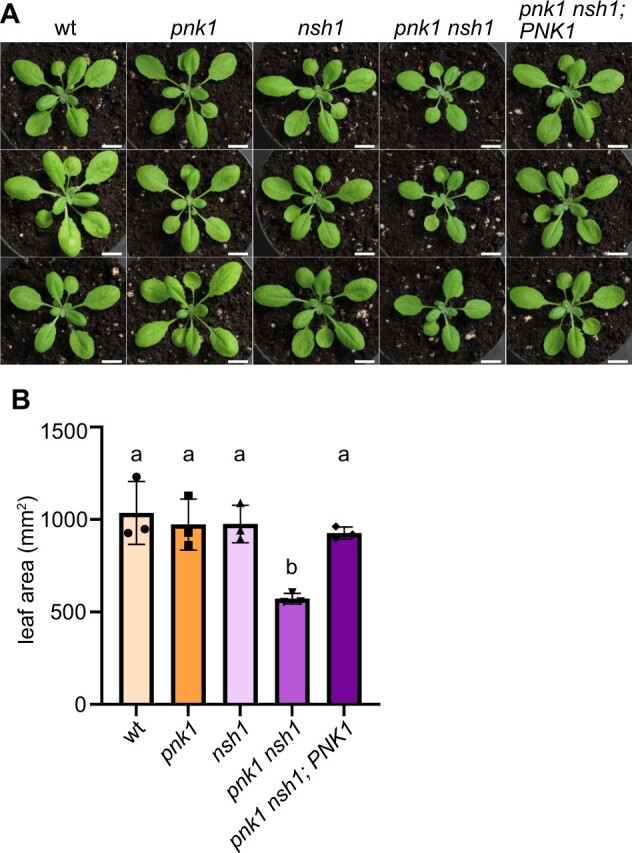
In nucleotide metabolism, nucleoside kinases recycle nucleosides into nucleotides-a process called nucleoside salvage. Nucleoside kinases for adenosine, uridine, and cytidine have been characterized from many organisms, but kinases for inosine and guanosine salvage are not yet known in eukaryotes and only a few such enzymes have been described from bacteria. Here we identified Arabidopsis thaliana PLASTID NUCLEOSIDE KINASE 1 (PNK1), an enzyme highly conserved in plants and green algae belonging to the Phosphofructokinase B family. We demonstrate that PNK1 from A. thaliana is located in plastids and catalyzes the phosphorylation of inosine, 5-aminoimidazole-4-carboxamide-1-β-d-ribose (AICA ribonucleoside), and uridine but not guanosine in vitro, and is involved in inosine salvage in vivo. PNK1 mutation leads to increased flux into purine nucleotide catabolism and, especially in the context of defective uridine degradation, to over-accumulation of uridine and UTP as well as growth depression. The data suggest that PNK1 is involved in feedback regulation of purine nucleotide biosynthesis and possibly also pyrimidine nucleotide biosynthesis. We additionally report that cold stress leads to accumulation of purine nucleotides, probably by inducing nucleotide biosynthesis, but that this adjustment of nucleotide homeostasis to environmental conditions is not controlled by PNK1.


Figures

Figure 1
Figure 1
Purification and biochemical analyses of the kinase encoded at At1g06730 (PNK1). A, Scheme of the reaction catalyzed by PNK1. B, Purification of C-terminal HA and Strep-tagged PNK1 via Strep-Tactin affinity chromatography from leaves of N. benthamiana after transient expression. A monoclonal anti-Strep tag antibody was used for immunoblot analysis. Crude, extract clarified by centrifugation; unbound, extract after incubation with Strep-Tactin; fifth wash, wash fluid after five washes of the protein-loaded resin; elution, affinity eluted protein. The theoretical molecular weight of the tagged protein is 55.4 kDa. C, Chemical structures of several ribonucleosides (R for ribose) and kinase activity survey of PNK1 with various potential nucleoside substrates (200 µM each) and 200 µM ATP. As readout, ADP was detected by HPLC after 50 min reaction at 30°C (Supplemental Figure S1) with 20 µg mL−1 purified enzyme in the reaction. nd, not detectable. D, Kinetic constants and catalytic efficiency (kcat/Km) of PNK1 for AICA ribonucleoside, inosine, and uridine. Errors are SD (n = 3 independent enzymatic reactions).
Figure 2
Figure 2
Subcellular localization, phylogenetic analysis, and structural modeling. A–C, Confocal fluorescence microscopy images of the lower epidermis of a N. benthamiana leaf transiently expressing C-terminal YFP-tagged PNK1. A, YFP channel. B, Autofluorescence of chloroplasts. C, Overlay of all channels including a brightfield image. Scale bars, 10 µm. D, Quantitative image analysis using the Van Steensel Cross Correlation Function of the images shown in (A) and (B). Fluorescence of PNK1-YFP was correlated to autofluorescence of the chloroplasts. The inset shows the Pearson Correlation Coefficients at dx = 0 for another six independent fluorescence images. The shown localization pattern was observed in many cells and was quantified in seven cells. E, Maximum likelihood tree of plant PfkB kinases with nucleoside or ribose kinase activity. The tree with the highest log likelihood (−8,417.87) is shown. Bootstrap values ˃80 (1,000 iterations) are shown at branch points. Branch lengths represent the number of substitutions per site (sps). For the adenosine kinases the branching pattern is also displayed with a three-fold enlargement. Ara_tha, A. thaliana; Pha_vul, Phaseolus vulgaris; Sol_lyc, Solanum lycopersicum; Ory_sat, Oryza sativa; Sor_bic, Sorghum bicolor; Chl_rei, C. reinhardtii. F, Active site of E. coli IGK with guanosine (PDB id, 6vwo; Wang et al., 2020). Dashed lines represent possible hydrogen bonds. Amino acids in the vicinity of guanosine are shown. G, A structural model of the active site of PNK1 based on homology modeling. Inosine was placed at the equivalent position to the binding site for guanosine in E. coli IGK. Putative active site residues are shown. The frame highlights a possible interaction between N92 and the nucleobase of inosine. H, Zoom view of the modeled binding environment between N92 and inosine or guanosine. Guanosine binding might be prevented by sterical clashes. I, Structural comparison of the active sites of PNK1 generated by the two different modeling approaches. The homology model of PNK1 (orange) was overlaid with a model created by AlphaFold (cyan). The binding mode of inosine (gray) in the AlphaFold model was predicted by molecular docking with AutoDock Vina. Its binding affinity was −6.9 kcal/mol (score 1) and its location is essentially identical to the inosine position (green) in the homology model.
Figure 3
Figure 3
Characterization of plant variants with different PNK1 expressions. A, Genomic organization of the At1g06730 locus encoding PNK1. The coding regions of exons (E) are represented by brown boxes while introns are drawn as gray boxes. Blue arrows, primers; triangle, T-DNA insertion. B, RT–PCR analysis of seedling mRNA from wild-type and the PNK1 mutant (pnk1) amplified with primers P858 and P859. ACTIN 2 (ACT2, At3g18780) was amplified as control with primers 1033 and 1034. C, Quantitative RT–PCR with primers P3138 and P3139 binding upstream of the T-DNA insertion site in exons 2 and 3 using seedling mRNA from wild-type and pnk1 (n = 3 biological replicates, that is, several seedlings per replicate from three different growth plates, each plate contained all genotypes). An unpaired two-tailed t test was used for statistical analysis in each treatment group. Asterisk indicates a statistical difference at *P < 0.05. D, Transient expression of 35S promoter-driven cDNAs encoding PNK1, PNK1*, and PNK1** in leaves of N. benthamiana. Proteins in leaf extracts or after StrepTactin affinity purification were detected by immunoblot with a monoclonal anti-Strep antibody or by Coomassie staining. E, Immunoblot analysis of seedling extracts from the wild-type (wt), pnk1, and PNK1-HAStrep complementation and overexpression lines in either the background of the PNK1 single mutant (pnk1; PNK1), or the PNK1 HGPRT double mutant (pnk1 hgprt; PNK1), or the PNK1 NSH1 double mutant (pnk1 nsh1; PNK1). A monoclonal anti-Strep antibody was used for detection.
Figure 4
Figure 4
Metabolite analysis of the PNK1 mutant and the complementation and overexpression line compared to the wild-type at different daytimes and light conditions. A, Contents of the indicated metabolites in 10-day-old seedlings of wild-type and pnk1 grown under long-day conditions (16-h light) on half-strength MS medium analyzed at the end of the night and 3 h into the day with normal light or without light (prolonged night). An unpaired two-tailed t test was used for statistical analysis in each treatment group. ** indicates a statistical difference at P < 0.01. 0 h light, seedlings were harvested at the end of the night, right before the onset of light; 3 h light, seedlings were harvested 3 h after the end of the night; 3 h dark, seedlings were harvested 3 h after the end of the normal night, but the night was prolonged and these seedlings were not exposed to light. B, Contents of the indicated metabolites in 10-day-old seedlings grown as in (A) of the wild-type, pnk1, and the complementation and overexpression line (pnk1; PNK1) at the end of the night and 3 h as well as 9 h after the onset of the day. 0 h light, seedlings were harvested at the end of the night, right before the onset of light; 3 h or 9 h light, seedlings were harvested 3 or 9 h after the end of the night, respectively. The detection limit for IMP in plant matrix (fixed term in mass spectrometry, the molecular background of the plant extract) was 0.2 nmol g−1 FW. For statistical analysis, two-sided Tukey’s pairwise comparisons were performed separately for each time point. Different letters indicate statistical differences at P < 0.05. Numbers above the bars are P-values. Error bars are sd (n = 3 biological replicates, that is, several seedlings per replicate from three different growth plates, each plate containing all genotypes, symbols in graphs represent individual data points, and numerical values are deposited in Supplemental Data Set 3). FW, fresh weight.
Figure 5
Figure 5
Metabolite analysis of seedlings lacking or overexpressing PNK1 in nsh1 background. Metabolite contents in 10-day-old seedlings of wild-type, pnk1, nsh1, pnk1 nsh1, and PNK1 complementation and overexpression line in double mutant background (pnk1 nsh1; PNK1) with or without external inosine supplementation. All seedlings were harvested and analyzed 3 h after the onset of light. Graphs with gray background contain data from plants supplemented with external inosine. Error bars are SD (n = 3 biological replicates, that is, several seedlings per replicate from three different growth plates, each plate containing all genotypes). For statistical analysis, two-sided Tukey’s pairwise comparisons were performed separately for samples from plants with and without inosine treatment. Different letters indicate statistical differences at P < 0.05.
Figure 6
Figure 6
Metabolite analysis of seedlings varying in PNK1 expression in hgprt background and upon inhibition of XDH during the day. Xanthine and hypoxanthine content in 10-day-old seedlings of wild-type, pnk1, hgprt, pnk1 hgprt, and the PNK1 complementation and overexpression line in double mutant background (pnk1 hgprt; PNK1) before allopurinol treatment (0 h) and 3 and 9 h after allopurinol treatment to inhibit XDH. Seedlings grown in long-day conditions (16-h light) were harvested at the beginning of the day for the samples before allopurinol application, then treated with allopurinol and sampled 3 and 9 h later during the day. Error bars are SD (n = 3 biological replicates, that is, several seedlings per replicate from three different growth plates, each plate containing all genotypes). The detection limit for xanthine in plant matrix was 1.8 nmol g−1 FW. For statistical analysis, two-sided Tukey’s pairwise comparisons were performed separately for each time point. Different letters indicate statistical differences at P < 0.05.
Figure 7
Figure 7
Developmental retardation of the PNK1 NSH1 mutant. A, Images of 21-day-old plants of wild-type, pnk1, nsh1, pnk1 nsh1 and pnk1 nsh1; PNK1. Scale bars, 1 cm. B, Leaf area quantification of plants shown in (A). Error bars are SD (n = 3 biological replicates, that is, one seedling per pot, three potted seedlings of each genotype were analyzed). For statistical analysis, two-sided Tukey’s pairwise comparisons were performed. Different letters indicate statistical differences at P < 0.05.
Figure 8
Figure 8
Changes in nucleotide and nucleoside content due to cold in the wild-type and variants of PNK1 expression. A, Nucleoside triphosphate content in Arabidopsis wild-type seedlings grown at normal temperature (16-h light period, 22°C day, 20°C night) up to Day 7 and then either left growing under these conditions for three more days (orange data points) or exposed to cold (16-h light period, 10°C throughout; blue data points). The plants were always harvested 3 h after daybreak. Error bars are SD (n = 3 biological replicates, that is, several seedlings per replicate from three different growth plates). For statistical analysis at each time point, an unpaired two-tailed t test was used. Statistical differences at P < 0.05, P < 0.01, and P < 0.001 are indicated by *, **, and ***, respectively. B, Changes of purine nucleotide and inosine content shortly after cold exposure in the wild-type. Ten-day-old wild-type seedlings were exposed to 10°C at different times. All plants were harvested 3 h after daybreak. Error bars are sd (n = 3 biological replicates, that is, several seedlings per replicate from three different growthU plates). Two-sided Tukey’s pairwise comparisons were performed for statistical analyses. Different letters represent statistical differences at P < 0.05. C, IMP and purine nucleoside content in plants with distinct PNK1 expression before and after short-term cold exposure. Ten-day-old seedlings of wild-type, pnk1, and pnk1; PNK1 were exposed to cold treatment (10°C). All plants were harvested 3 h after daybreak. Error bars are sd (n = 3 biological replicates, that is, several seedlings per replicate from three different growth plates, each plate contained all genotypes). For analysis of statistical differences between the different genotypes at each time point, two-sided Tukey’s pairwise comparisons were used. Different letters represent statistical differences at P < 0.05.
Figure 9
Figure 9
Model of inosine salvage by PNK1 in the context of purine metabolism. The source of inosine has not been elucidated but it has been shown that inosine is not a major intermediate of purine nucleotide (AMP and GMP) catabolism in Arabidopsis (Baccolini and Witte, 2019). Inosine occurs in t-RNAs and may stem from their turnover but it may also arise from nonenzymatic adenosine deamination (free adenosine as well as nucleotide and nucleic acid-bound adenosine). In addition, inosine may be generated in plastids during IMP biosynthesis by IMP dephosphorylation. This idea is supported by the simultaneous rise of IMP and inosine concentrations upon illumination or cold stress. A putative plastid IMP phosphatase (IMPP?) is drawn in the model. A putative plastid nucleoside transporter (NT?) is also shown because our data provide evidence for nucleoside exchange between plastids and the cytosol. Additionally, it is possible that plastids can export IMP via a speculative IMP transporter (IMPT?) to support GMP biosynthesis without an AMP intermediate. However, it is not yet clear whether such a pathway exists. According to transcript data, TOR is a positive regulator of purine nucleotide biosynthesis and SnRK1 is a positive regulator of purine nucleotide catabolism.

Similar articles

Cited by

References

    1. Allen M, Qin WS, Moreau F, Moffatt B (2002) Adenine phosphoribosyltransferase isoforms of Arabidopsis and their potential contributions to adenine and cytokinin metabolism. Physiol Plantarum 115: 56–68 - PubMed
    1. Alonso JM, Stepanova AN, Leisse TJ, Kim CJ, Chen HM, Shinn P, Stevenson DK, Zimmerman J, Barajas P, Cheuk R, et al. (2003) Genome-wide insertional mutagenesis of Arabidopsis thaliana. Science 301: 653–657 - PubMed
    1. Ashihara H, Stasolla C, Fujimura T, Crozier A (2018) Purine salvage in plants. Phytochem 147: 89–124 - PubMed
    1. Baccolini C, Witte CP (2019) AMP and GMP catabolism in Arabidopsis converge on xanthosine, which is degraded by a nucleoside hydrolase heterocomplex. Plant Cell 31: 734–751 - PMC - PubMed
    1. Baena-Gonzalez E, Rolland F, Thevelein JM, Sheen J (2007) A central integrator of transcription networks in plant stress and energy signalling. Nature 448: 938–942 - PubMed

Publication types

LinkOut - more resources