. 2022 Nov 7:11:e79418.
doi: 10.7554/eLife.79418.

Whole-brain comparison of rodent and human brains using spatial transcriptomics

Affiliations

Whole-brain comparison of rodent and human brains using spatial transcriptomics

Antoine Beauchamp et al. Elife. .

Abstract

The ever-increasing use of mouse models in preclinical neuroscience research calls for an improvement in the methods used to translate findings between mouse and human brains. Previously, we showed that the brains of primates can be compared in a direct quantitative manner using a common reference space built from white matter tractography data (Mars et al., 2018b). Here, we extend the common space approach to evaluate the similarity of mouse and human brain regions using openly accessible brain-wide transcriptomic data sets. We show that mouse-human homologous genes capture broad patterns of neuroanatomical organization, but the resolution of cross-species correspondences can be improved using a novel supervised machine learning approach. Using this method, we demonstrate that sensorimotor subdivisions of the neocortex exhibit greater similarity between species, compared with supramodal subdivisions, and mouse isocortical regions separate into sensorimotor and supramodal clusters based on their similarity to human cortical regions. We also find that mouse and human striatal regions are strongly conserved, with the mouse caudoputamen exhibiting an equal degree of similarity to both the human caudate and putamen.

Keywords: comparative neuroanatomy; evolutionary biology; human; mouse; neuroinformatics; neuroscience; translational neuroscience.


Conflict of interest statement

AB, YY, BD, AR, RM, JL No competing interests declared

Figures

Figure 1.
Figure 1.. Transcriptomic similarity in the mouse and human brains.
(A) Similarity matrix displaying the correlation between 67 mouse regions and 88 human regions based on the expression of 2835 homologous genes. Columns are annotated with 11 broad mouse regions: cortical subplate (CTXsp), olfactory areas (OLF), hippocampal formation (HPF), isocortex, cerebral nuclei (CNU), interbrain (IB), midbrain (MB), pons (P), medulla (MY), cerebellar cortex (CBX), and cerebellar nuclei (CBN). Rows are annotated with 16 broad human regions: claustrum (Cl), limbic lobe (LL), frontal lobe (FL), insula (Ins), occipital lobe (OL), parietal lobe (PL), temporal lobe (TL), amygdala (Amg), basal ganglia (BG), basal forebrain (BF), diencephalon (DIE), mesencephalon (MES), pons, myelencephalon (MY), cerebellar cortex (CbCx), and cerebellar nuclei (CbN). Broad patterns of similarity are evident between coarsely defined brain regions, while correlation patterns are mostly homogeneous within these regions. (B) Mouse brain coronal slices showing similarity profiles for the human precentral gyrus, cuneus, and crus I. Correlation patterns for the precentral gyrus and cuneus are highly similar to one another and broadly similar to most isocortical regions. The crus I is homogeneously similar to the mouse cerebellum. (C) Anatomically ordered line charts displaying the similarity profiles for the seed regions in (B). Dashed vertical lines indicate the canonical mouse homologue for each human seed. Annotation colors correspond to atlas colors from the Allen Mouse Brain Atlas and Allen Human Brain Atlas for mouse and human regions, respectively.
Figure 2.
Figure 2.. Creating a new common space.
(A) Voxel-wise expression maps from 2835 homologous genes in the Allen Mouse Brain Atlas were used to train the neural network to classify each mouse voxel into one of the 67 atlas regions. (B) Once the network is trained, the output layer is removed. The mouse and human regional gene expression matrices are passed through the network, resulting in lower-dimensional latent space representations of the data. The training and transformation process were repeated 500 times. (C) A similarity matrix displaying the gene expression latent space correlation between mouse and human regions, averaged over 500 neural network training runs. Similar brain regions exhibit very high correlation values. Column and row annotations as described in Figure 1.
Figure 2—figure supplement 1.
Figure 2—figure supplement 1.. Multi-layer perceptron feature importance for the classification of the caudoputamen (A), the primary motor area (B), and the infralimbic area (C).
Top row: Rank-ordered distributions of feature importance for the 3 example regions, averaged over 200 training runs. While the perceptron relies on information from all input genes, a reduced subset of genes is often more informative for the classification of a given label. Bottom row: Coronal slice series displaying the normalized expression patterns for the two genes most informative in the classification of example regions. The spatial expression patterns can be specific to the region of interest, but this is not necessarily the case.
Figure 3.
Figure 3.. Quantifying improvement in locality in gene expression latent space.
(A) The amount of local signal within a broadly similar region of the brain for a finer seed region’s (e.g. primary motor area) similarity profile can be quantified by the decay rate of the head of the rank-ordered profile. Decay rate was quantified by computing the rank at a similarity of 0.75. This metric was compared between the initial gene expression space (orange line) and every gene expression latent space resulting from repeated training of the neural network (every blue line is a training outcome, heavy blue line serves as an example). A negative difference between these rank metrics indicates an improvement in locality in the latent space. (B) Structure-wise distributions of differences in rank at a similarity of 0.75 between the initial gene expression space and the gene expression latent spaces. Points and error bars represent mean and 95% CI with n = 500. Dashed black line at 0 indicates the threshold for improvement in one space over the other. Colors correspond to Allen Mouse Brain Atlas annotations as in Figures 1 and 2. Binomial likelihood (logistic regression) estimate of pB=0.78 with 95% CI [0.66, 0.86]. The probability of obtaining at least these many successes under the null binomial distribution, B67,0.5 , is p=8.64 · 10−7 . (C) Proportion of perceptron training runs resulting in an improvement or null difference in the gene expression latent space compared with the initial space, estimated using region-wise logistic regressions. Cortical and cerebellar regions exhibit high proportions of improvement, while subcortical regions are less likely to be improved by the classification process.
Figure 4.
Figure 4.. Recovering canonical neuroanatomical pairs in gene expression space.
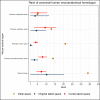
(A) Comparison between the ranks of canonical human matches for mouse seed regions between the initial gene expression space and gene expression latent spaces. Points and error bars represent mean and 95% CI with n = 500. Mouse region names are colored according to the Allen Mouse Brain Atlas palette. Binomial likelihood estimate of p=0.64 with 95% CI [0.47, 0.78]. The probability of obtaining at least thse many successes under the null binomial distribution, B36,0.5 , is p=0.033. (B) Proportion of latent spaces resulting in an improvement or null difference compared with the initial gene space, estimated using region-wise logistic regressions. Uncolored voxels correspond to regions with no established canonical human match.
Figure 5.
Figure 5.. Similarity of mouse-human isocortical regions.
(A) Maximal correlation distributions of mouse isocortical regions. Points and error bars represent mean and 95% CI over n = 500 latent space samples. Linear regression using average maximal correlation values: β=-0.042, 95% CI -0.087,0.003 , t17=-1.854, p=0.0812. (B) Distributions of average maximal correlation for sensorimotor and supramodal isocortical areas in each gene expression latent space. Gray lines correspond to individual latent spaces. Linear mixed-effects regression: β=-0.042, 95% CI -0.044,-0.040 , t499=-49.9, p<2 · 10−16 . (C) Hierarchical clustering of mouse and human isocortical regions based on average latent space correlation values. Mouse regions are annotated as sensorimotor or supramodal. Four clusters were chosen for visualization using the elbow method. (D) Within-cluster sum of squared distances for different numbers of mouse and human isocortical clusters in the average latent space and initial homologous gene space.
Figure 5—figure supplement 1.
Figure 5—figure supplement 1.. Comparison between the ranks of canonical human matches for mouse cortical seed regions in various gene expression spaces.
Points and error bars represent mean and 95% CI with n = 500. Intervals are truncated at a minimal rank of 1. The original latent spaces are the latent spaces obtained from classifying all 67 mouse brain regions. The cortex latent spaces are the latent spaces obtained from classifying 19 mouse cortical regions only.
Figure 5—figure supplement 2.
Figure 5—figure supplement 2.. Similarity of mouse-human isocortical regions in latent spaces obtained using only cortical labels.
(A) Maximal correlation distributions of mouse isocortical regions. Points and error bars represent mean and 95% CI over n = 500 latent space samples. (B) Distributions of average maximal correlation for sensorimotor and supramodal isocortical areas in each cortical latent space. Gray lines correspond to individual latent spaces. (C) Hierarchical clustering of mouse and human isocortical regions based on average latent space correlation values. Mouse regions are annotated as sensorimotor or supramodal. (D) Within-cluster sum of squared distances for different numbers of mouse and human isocortical clusters in the average cortical latent space and initial homologous gene space.
Figure 6.
Figure 6.. Similarity among mouse and human striatal regions.
(A) Distributions over gene expression latent spaces of region-wise average correlation values for mouse and human striatal pairs. Human regions were chosen based on the Allen Human Brain Atlas ontology. Mouse target regions were chosen to be those with the highest average correlation values. (B) Latent space averaged correlations between voxels in the mouse striatum and human target regions. Target regions were selected based on the highest mean correlation across all striatal voxels. (C) Proportions of latent spaces in which mouse striatal voxels are maximally similar to human target regions.
Author response image 1.
Author response image 2.

Similar articles

Cited by

References

    1. Arnatkeviciute A, Fulcher BD, Fornito A. A practical guide to linking brain-wide gene expression and neuroimaging data. NeuroImage. 2019;189:353–367. doi: 10.1016/j.neuroimage.2019.01.011. - DOI - PubMed
    1. Balsters JH, Zerbi V, Sallet J, Wenderoth N, Mars RB. Primate homologs of mouse cortico-striatal circuits. eLife. 2020;9:e53680. doi: 10.7554/eLife.53680. - DOI - PMC - PubMed
    1. Barron HC, Mars RB, Dupret D, Lerch JP, Sampaio-Baptista C. Cross-Species neuroscience: closing the explanatory gap. Philosophical Transactions of the Royal Society of London. Series B, Biological Sciences. 2021;376:20190633. doi: 10.1098/rstb.2019.0633. - DOI - PMC - PubMed
    1. Beauchamp A. MouseHumanTranscriptomicSimilarity. swh:1:rev:0ad9c547e18e8ca5d08872cbecb9f729a4b8b62bSoftware Heritage. 2022 https://archive.softwareheritage.org/swh:1:dir:87ac33008a77aab2bde8b2c85...
    1. Benjamini Y, Hochberg Y. Controlling the false discovery rate: a practical and powerful approach to multiple testing. Journal of the Royal Statistical Society. 1995;57:289–300. doi: 10.1111/j.2517-6161.1995.tb02031.x. - DOI

Publication types