. 2022 Nov 7:11:e76911.
doi: 10.7554/eLife.76911.

Complementary evolution of coding and noncoding sequence underlies mammalian hairlessness

Affiliations

Complementary evolution of coding and noncoding sequence underlies mammalian hairlessness

Amanda Kowalczyk et al. Elife. .

Abstract

Body hair is a defining mammalian characteristic, but several mammals, such as whales, naked mole-rats, and humans, have notably less hair. To find the genetic basis of reduced hair quantity, we used our evolutionary-rates-based method, RERconverge, to identify coding and noncoding sequences that evolve at significantly different rates in so-called hairless mammals compared to hairy mammals. Using RERconverge, we performed a genome-wide scan over 62 mammal species using 19,149 genes and 343,598 conserved noncoding regions. In addition to detecting known and potential novel hair-related genes, we also discovered hundreds of putative hair-related regulatory elements. Computational investigation revealed that genes and their associated noncoding regions show different evolutionary patterns and influence different aspects of hair growth and development. Many genes under accelerated evolution are associated with the structure of the hair shaft itself, while evolutionary rate shifts in noncoding regions also included the dermal papilla and matrix regions of the hair follicle that contribute to hair growth and cycling. Genes that were top ranked for coding sequence acceleration included known hair and skin genes KRT2, KRT35, PKP1, and PTPRM that surprisingly showed no signals of evolutionary rate shifts in nearby noncoding regions. Conversely, accelerated noncoding regions are most strongly enriched near regulatory hair-related genes and microRNAs, such as mir205, ELF3, and FOXC1, that themselves do not show rate shifts in their protein-coding sequences. Such dichotomy highlights the interplay between the evolution of protein sequence and regulatory sequence to contribute to the emergence of a convergent phenotype.

Keywords: convergent evolution; evolutionary biology; genetics; genomics; hair; hairless; human; mouse; rat; regressive evolution; rhesus macaque.

Plain language summary

Whales, elephants, humans, and naked mole-rats all share a somewhat rare trait for mammals: their bodies are covered with little to no hair. The common ancestors of each of these species are considerably hairier which must mean that hairlessness evolved multiple times independently. When distantly related species evolve similar traits, it can be interpreted as a certain aspect of their evolution repeating itself. This process is called ‘convergent evolution’ and may provide insights about how different species were able to arrive at the same outcome. One possibility is that they have undergone similar genetic changes such as turning on or off key genes that play a role in the trait’s development. Kowalczyk et al. set out to identify what genetic changes may have contributed to the convergent evolution of hairlessness in unrelated species of mammals. By looking at the genomes of 62 mammalian species, they hoped to link specific genomic elements to the origins of the hairless trait. The genetic sequences under investigation included nearly 20,000 genes that encode information about how to make proteins, as well as 350,000 regulatory sequences composed of non-coding DNA, which specify when and how genes are activated. This marks the first time genetic mechanisms behind various hair traits have been studied in such a diverse group of mammals. Using a computational approach, Kowalczyk et al. identified parts of the genome that have evolved similarly in mammalian species that have lost their hair. They found that genes and regulatory sequences, that had been previously associated with hair growth, accumulated mutations at significantly different rates in hairless versus hairy mammals. This indicates that these regions associated hair growth are also related to evolution of hairlessness. This includes several genes that encode keratin proteins, the main material that makes up hair. The team also reported an increased rate of evolution in genes and regulatory sequences that were not previously known to be involved in hair growth or hairlessness in mammals. Together these results suggest that a specific set of genetic changes have occurred several times in different mammalian lineages to drive the evolution of hairlessness in unrelated species. Kowalczyk et al. describe the parts of the genome that may be involved in controlling hair growth. Once their findings are validated, they could be used to develop treatments for hair loss in humans. Additionally, their computational approach could be applied to other examples of convergent evolution where genomic data is available, allowing scientists to better understand how the same traits evolve in different species.


Conflict of interest statement

AK, MC, NC No competing interests declared

Figures

Figure 1.
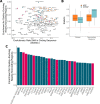
Figure 1.. Hairless species show an enrichment of hair-related genes and noncoding elements whose evolutionary rates are significantly associated with phenotype evolution.
(A) Phylogenetic tree showing a subset of the 62 mammal species used for analyses. Note that all 62 species were included in analyses and only a subset are shown here for visualization purposes. Foreground branches representing the hairless phenotype are depicted in orange alongside photographs of the species. (B) Q-Q plots for uniformity of permulation p-values for association tests per genetic element for coding and noncoding elements. Shown are both positive associations that indicate accelerated evolution in hairless species and negative associations that indicate decelerated evolution in hairless species. The deviation from the red line (the identity) indicates an enrichment of low permulation p-values – there are more significant permulation p-values than we would observe under the uniform null expectation. This indicates significant evolutionary rate shifts for many genes and noncoding elements in hairless mammals. (C) Hair-related Mouse Genome Informatics (MGI) category genes are under significantly accelerated evolution in hairless species. Shown are the AUC (Area Under the Receiver Operating Characteristic curve) values minus 0.5 (maximum enrichment statistic = 0.5, minimum enrichment statistic = –0.5; statistic = 0 indicates no enrichment) for each hair- or skin-related pathway with a permulation p-value≤0.01. In parentheses are the statistic-based ranks of those pathways among all pathways under accelerated evolution in hairless mammals with permulation p-values≤0.01. (D) Skin- and hair-expressed genes are under significant evolutionary rate acceleration in hairless species. All genesets except hair follicle are from the GTEx tissue expression database. Hair follicle genes are the top 69 most highly expressed genes from Zhang et al., 2017 hair follicle RNA sequencing that are not ubiquitously expressed across GTEx tissue types.
Figure 1—figure supplement 1.
Figure 1—figure supplement 1.. Skin-related genes evolve faster in hairless species.
(A) When considering either the state of being hairless as the foreground or the process of changing from haired to hairless as the foreground, enrichment of skin-related genes shows little difference. (B) When considering the elephant/manatee ancestor as haired or hairless, an area of uncertainty in phenotype evolution, enrichment of skin-related genes shows little difference.
Figure 1—figure supplement 2.
Figure 1—figure supplement 2.. Network of pathway annotations shown in Figure 1C.
Size of nodes and numbers in nodes indicate the number of genes in the pathway. Width of lines connecting nodes indicates the number of genes shared between pathways. Values for node sizes and edge widths are given in Figure 1—source data 9. Visualization was generated using igraph (Csardi and Nepusz, 2006) with optimal clustering to identify groups shown with different colored nodes and shading.
Figure 1—figure supplement 3.
Figure 1—figure supplement 3.. Network of pathway annotations shown in Figure 1D.
Size of nodes and numbers in nodes indicate the number of genes in the pathway. Note that pathways with more than 200 genes were binned to the same node size for clarity of visualization. Width of lines connecting nodes indicates the number of genes shared between pathways. Values for node sizes and edge widths are given in Figure 1—source data 9. Visualization was generated using igraph (Csardi and Nepusz, 2006) with optimal clustering to identify groups shown with different colored nodes and shading.
Figure 1—figure supplement 4.
Figure 1—figure supplement 4.. Plot of RER values for each species for the FGF11 gene.
Figure 1—figure supplement 5.
Figure 1—figure supplement 5.. Plot of RER values for each species for the GLRA4 gene.
Figure 1—figure supplement 6.
Figure 1—figure supplement 6.. Plot of RER values for each species for the ANXA11 gene.
Figure 1—figure supplement 7.
Figure 1—figure supplement 7.. Plot of RER values for each species for the PTPRM gene.
Figure 1—figure supplement 8.
Figure 1—figure supplement 8.. Plot of RER values for each species for the PKP1 gene.
Figure 1—figure supplement 9.
Figure 1—figure supplement 9.. Plot of RER values for each species for the KRT2 gene.
Figure 1—figure supplement 10.
Figure 1—figure supplement 10.. Plot of RER values for each species for the MYH4 gene.
Figure 1—figure supplement 11.
Figure 1—figure supplement 11.. Plot of RER values for each species for the KRT35 gene.
Figure 2.
Figure 2.. Bayes factors reveal the proportion of signal driven by the marine phenotype versus the hairless phenotype.
Depicted are precision-recall curves demonstrating how Bayes factors of the contrasting hairless and marine phenotypes rank genes related to skin, hair, and olfaction. Also plotted is a ranking based on the ratio of hairlessness and marine Bayes factors (hVSm = hairlessness Bayes factor/marine Bayes factor). The ratio of the Bayes factors quantifies the amount of support for the hairless phenotype beyond the support for the marine phenotype per gene. In other words, a high Bayes factor ratio indicates a signal of evolutionary convergence associated with hairlessness that is not only driven by signals of convergence in hairless marine mammals. The hairless phenotype had much greater power to enrich for genes expressed in skin (GTEx data) compared to the marine phenotype, indicating that accelerated evolution is driven more strongly by hairlessness. Both the marine and hairless phenotypes enriched for genes in hair follicle expression genes, indicating that both contribute to accelerated evolution of those genes. Olfactory genes, on the other hand, are expected to show acceleration only related to the marine phenotype. As expected, the marine phenotype is much more strongly enriched for olfactory genes than the hairless phenotype.
Figure 3.
Figure 3.. Convergent analyses show stronger enrichment for hair-related genes than single-species analyses.
Each hairless species was individually tested for a significant rate shift compared to non-hairless species using a Wilcoxon signed-rank test. Then a Fisher’s exact test was used to test for an enrichment of hair follicle genes (as shown in Figure 1D) with a minimum number of hairless species, ranging from 1 species to all 10 species, with significant rate shifts. Note that the odds ratio for an enrichment with a minimum of one species is not well defined because most genes genome-wide have at least one hairless species with a significant rate shift (18,582 genes out of 18,822 that could be tested), including all hair follicle genes, and their enrichment was not significant (p=0.64). Overall, enrichment strength increases moving from left to right on the plot as the geneset of interest becomes restricted to genes with a larger number of species with rate shifts, although p-values are less extreme because there are simply fewer genes in those categories with higher numbers of species. This demonstrates the convergent signal that allows for detection of hair-related genetic elements based on shared rate shifts.
Figure 3—figure supplement 1.
Figure 3—figure supplement 1.. Single-species analyses show inconsistent enrichment of hair follicle genes.
For each species listed (all 10 hairless species and 10 randomly selected non-hairless species), Wilcoxon signed-rank tests were run per gene to detect significant rate shift in the specified species compared to other species. A Fisher’s exact test was then run to test for enrichment of hair follicle genes (as shown in Figure 1D) among genes with significant rate shifts. Although two hairless species do show significant rate shifts, the trend is not consistent across all hairless species, most of which show similar enrichment to non-hairless species. This suggests that studying single species alone is often insufficient to identify hair-related genes. Further, genes with substantial changes in individual species may represent species-specific adaptation that do not apply globally across species that share similar phenotypes. Finally, single-species analyses are insufficient to distinguish genetic element functions may be related to a variety of species-specific adaptations and they are unable to prioritize function-related elements due to the large number of unique changes observed in each species (see Figure 3—source data 1, counts range from 5,641 for orca to 12,103 for manatee).
Figure 4.
Figure 4.. Hair-related pathways are enriched for genes with evolutionary rates significantly accelerated in hairless species.
Enrichment is consistent even when individual hairless species are removed.
Figure 5.
Figure 5.. Diagram of hair shaft and follicle with shading representing region-specific enrichment for coding and noncoding sequence.
Both coding and noncoding sequence demonstrate accelerated evolution of elements related to hair shaft (cortex, cuticle, and medulla). Noncoding regions demonstrate accelerated evolution of matrix and dermal papilla elements not observed in coding sequence. All compartment genesets were compiled from Mouse Genome Informatics (MGI) annotations that contained the name of the compartment except the arrector pili geneset (Santos et al., 2015).
Figure 6.
Figure 6.. Noncoding regions near hair-related genes evolve faster in hairless species.
(A) Genes with a significant enrichment for quickly evolving nearby noncoding regions (permulation p-value of 0.03 or less) only sometimes demonstrate evolutionary rate shifts in their protein-coding sequences. In orange are keratins and keratin-associated proteins, which tend to show accelerated evolutionary rates in both genes and nearby noncoding regions. In pink are top genes, also in pink in panel (C). In blue are all other genes in panel (C). (B) Keratin (KRT) and keratin-associated protein (KRTAP) genes and nearby noncoding sequence show enrichment for accelerated evolutionary rates. Shown are rate shift statistics for genes and enrichment statistics for noncoding regions. (C) Many top-ranked genes for nearby quickly evolving noncoding regions are hair-related. Depicted are the top 30 genes (KRTs and KRTAPs excluded) based on enrichment statistic with enrichment permulation p-value of 0.03 or less. No genes had significant evolutionary rate shifts in coding sequence except OLFM4, which evolves faster in hairless species. In pink are genes with hair-related functions in the literature (citations: ELF3 [Blumenberg, 2013], FOXC1 [Lay et al., 2016], CCL13 [Michel et al., 2017; Suárez-Fariñas et al., 2015], CCL1 [Nagao et al., 2012], DSG1 [Zhang et al., 2017], GSG1 [Umeda-Ikawa et al., 2009], MIR205HG [Wang et al., 2013], FOXQ1 [Ashburner et al., 2000; Carbon et al., 2019]).
Figure 7.
Figure 7.. Top miRNAs with nearby noncoding regions with evolutionary rates significantly associated with the hairless phenotype.
(A) Wilcoxon rank-sum enrichment statistics and Benjamini–Hochberg corrected p-values for top-ranked miRNAs. (B) Precision recall curve of statistic ranks for CNEs near mir205 demonstrates an enrichment of CNEs with accelerated evolution near mir205 compared to all noncoding regions near microRNAs. (C) The chromosomal region around mir205 shows a large number of CNEs accelerated in hairless species, as seen for RERconverge and Bayes factor scores. Note the relative decline of peaks in the vicinity of nearby protein-coding genes such as CAMK1G to the right. (D) mir205 is well-known to be associated with hair and skin growth and structure. Its transcriptional unit on chromosome 1 shows clear read pileups from hair follicle RNAseq data (Zhang et al., 2017). Gray peaks represent the number of RNAseq read coverage, and blue curves represent splice junctions.

Comment in

References

    1. Ahmad W, Faiyaz ul Haque M, Brancolini V, Tsou HC, ul Haque S, Lam H, Aita VM, Owen J, deBlaquiere M, Frank J, Cserhalmi-Friedman PB, Leask A, McGrath JA, Peacocke M, Ahmad M, Ott J, Christiano AM. Alopecia universalis associated with a mutation in the human hairless gene. Science. 1998;279:720–724. doi: 10.1126/science.279.5351.720. - DOI - PubMed
    1. Aldinger KA, Lehmann OJ, Hudgins L, Chizhikov VV, Bassuk AG, Ades LC, Krantz ID, Dobyns WB, Millen KJ. Foxc1 is required for normal cerebellar development and is a major contributor to chromosome 6p25.3 Dandy-Walker malformation. Nature Genetics. 2009;41:1037–1042. doi: 10.1038/ng.422. - DOI - PMC - PubMed
    1. Alonso L, Fuchs E. The hair cycle. Journal of Cell Science. 2006;119:391–393. doi: 10.1242/jcs.02793. - DOI - PubMed
    1. Andl T, Botchkareva NV. Micrornas (miRNAs) in the control of HF development and cycling: the next frontiers in hair research. Experimental Dermatology. 2015;24:821–826. doi: 10.1111/exd.12785. - DOI - PMC - PubMed
    1. Ashburner M, Ball CA, Blake JA, Botstein D, Butler H, Cherry JM, Davis AP, Dolinski K, Dwight SS, Eppig JT, Harris MA, Hill DP, Issel-Tarver L, Kasarskis A, Lewis S, Matese JC, Richardson JE, Ringwald M, Rubin GM, Sherlock G. Gene ontology: tool for the unification of biology. Nature Genetics. 2000;25:25–29. doi: 10.1038/75556. - DOI - PMC - PubMed

Publication types