. 2023 May;72(5):1139-1151.
doi: 10.1007/s00262-022-03319-w. Epub 2022 Nov 7.

Egr2 and 3 maintain anti-tumour responses of exhausted tumour infiltrating CD8 + T cells

Affiliations

Egr2 and 3 maintain anti-tumour responses of exhausted tumour infiltrating CD8 + T cells

Alistair L J Symonds et al. Cancer Immunol Immunother. 2023 May.

Abstract

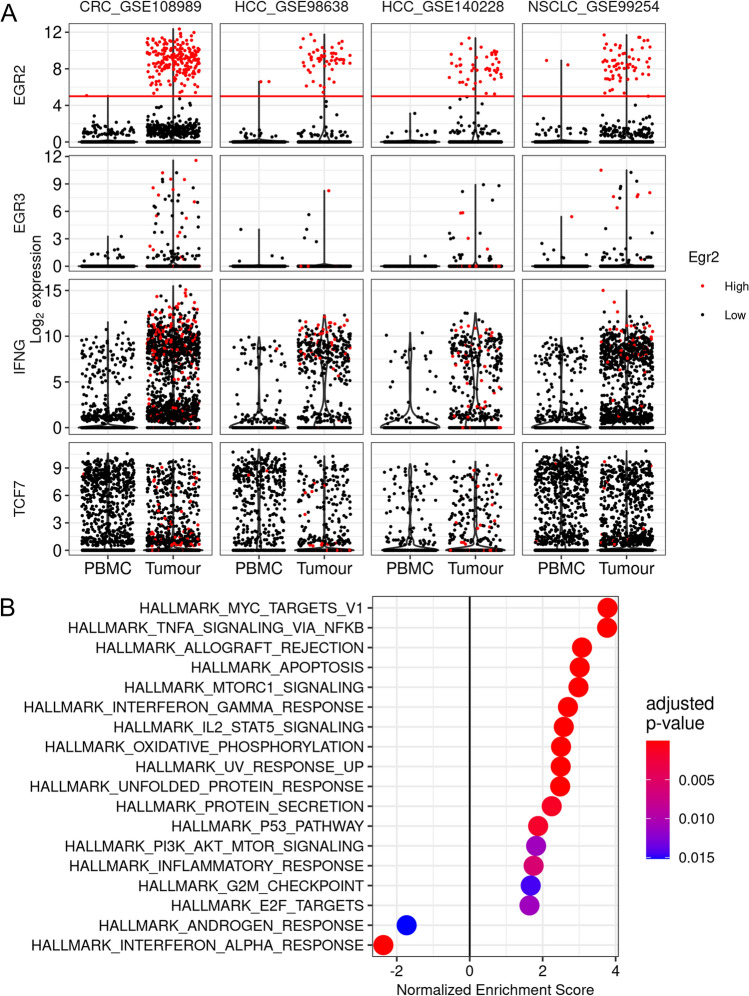
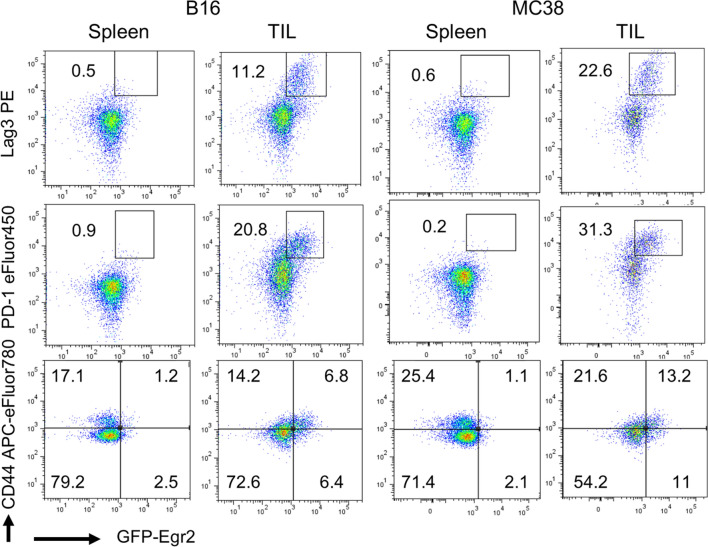
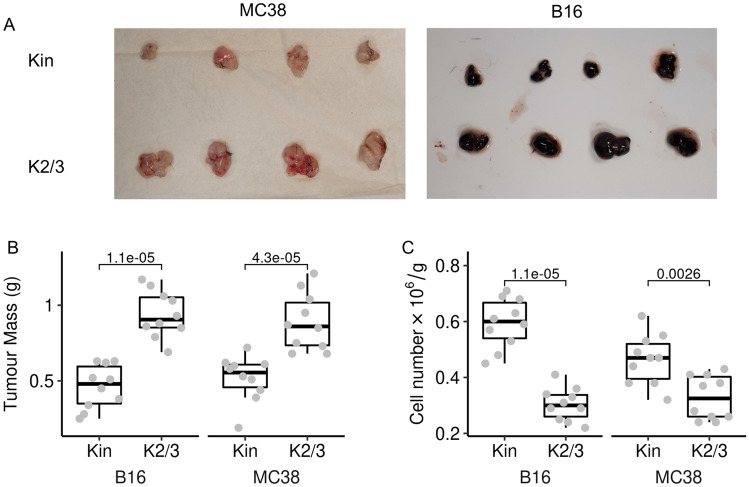
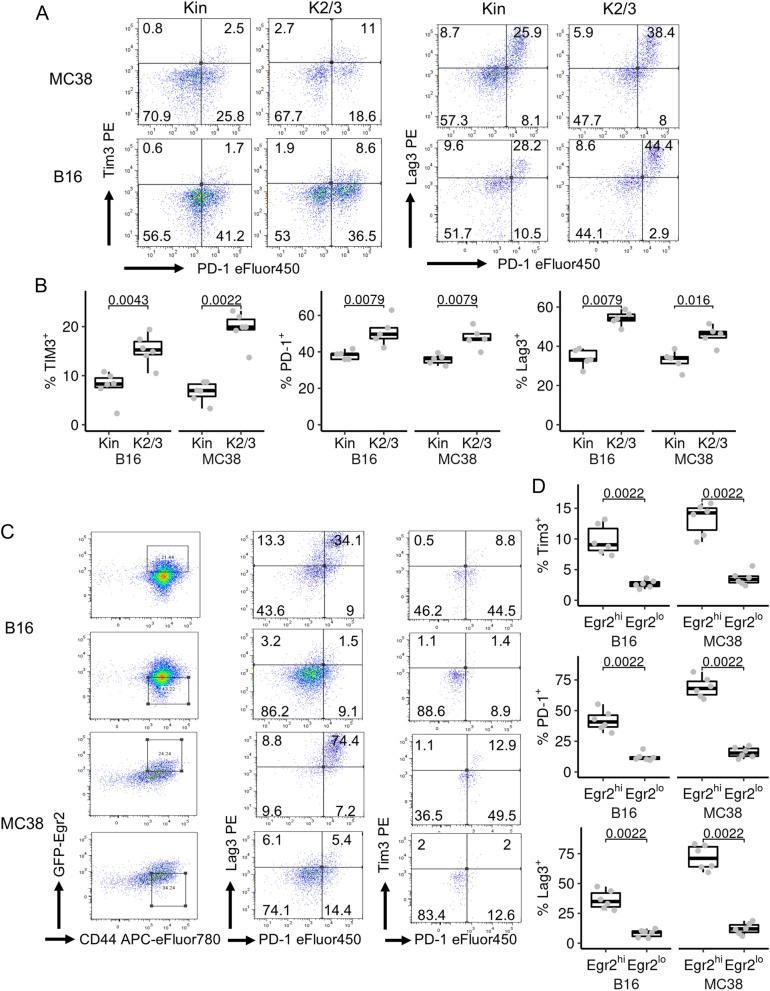
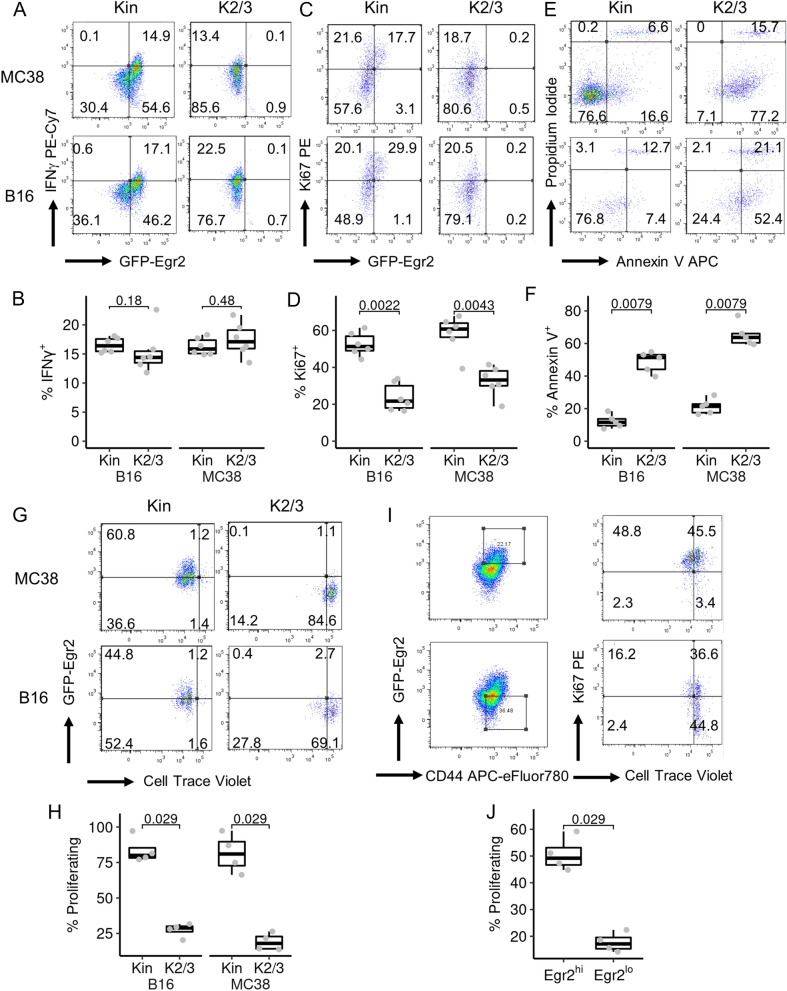
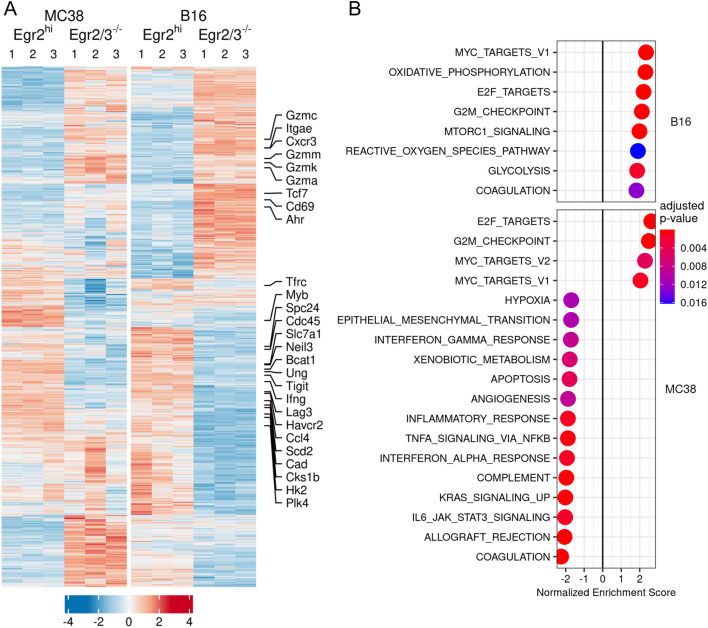
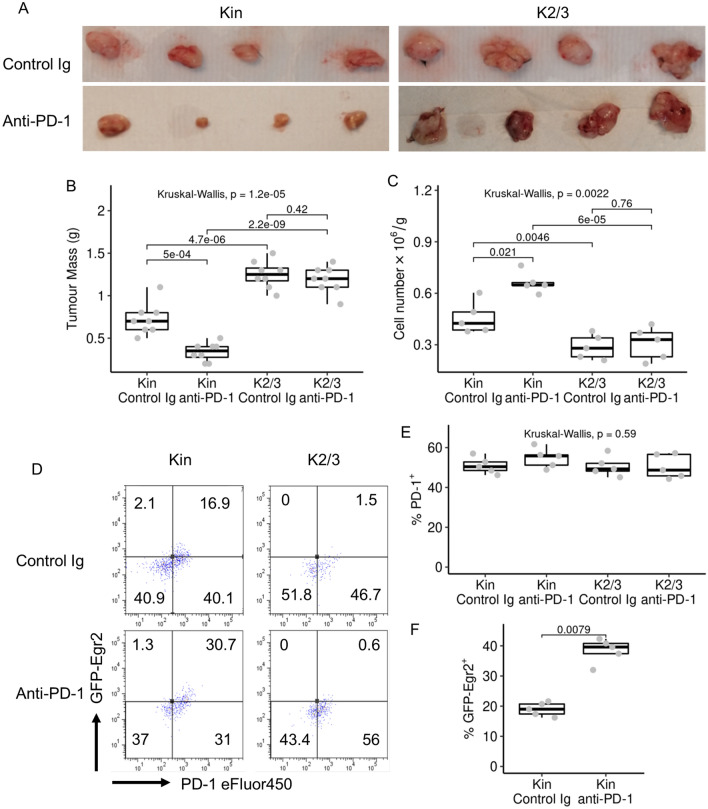
Although T cells can develop into an exhausted state in the tumour microenvironment, tumour infiltrating T cells (TILs) are important to control tumour growth. By analysing single cell RNA-sequencing data from human tumours, we found that the transcription factors Early Growth Response 2 (EGR2) and 3 were highly induced in TILs, but not peripheral CD8 + T cells, in multiple patient cohorts. We found that deficiency of Egr2 and 3 in T cells resulted in enhanced tumour growth and fewer TILs in mouse models. Egr2 is highly expressed together with checkpoint molecules in a proportion of CD8 + TILs and Egr2high cells exhibit better survival and proliferation than Egr2-/-Egr3-/- and Egr2low TILs. Anti-PD-1 treatment increases Egr2 expression in CD8 + TILs and reduces tumour growth, while anti-PD-1 efficacy is abrogated in the absence of Egr2 and 3. Thus, Egr2 and 3 are important for maintaining anti-tumour responses of exhausted CD8 + TILs.

Keywords: Anti-PD-1; Egr2; Egr3; Tumour infiltrating lymphocytes.


Conflict of interest statement

The authors have no relevant financial or non-financial interests to disclose.

Figures

Fig. 1
Fig. 1
Egr2 and 3 are expressed in CD8 + T cells from human tumours. Analysis of single cell RNA sequencing data from CD8 T cells from human tumours from four reported studies (CRC, colorectal cancer; HCC, hepatocellular carcinoma; NSCLC, Non-small cell lung cancer). A. Normalised expression of EGR2, EGR3, IFNG and TCF7. Cells are coloured by EGR2 expression level, with EGR2 high cells (defined as log2 expression greater than 5, as shown by the red line) coloured red and EGR2 low cells coloured black. B. Gene set enrichment analysis of pseudobulk data generated from EGR2high and EGR2low cells from tumour infiltrating CD8 T cells from dataset CRC_GSE108989. For each patient, two pseudobulk samples were generated from their EGR2 high cells and EGR2low cells, respectively. A LRT test was performed using DESeq2 and used in pre-ranked GSEA using the Broad Institute Hallmark genesets [37]. Normalised enrichment is shown, with genesets enriched in EGR2high cells having a positive score and genesets enriched in EGR2low cells having a negative score
Fig. 2
Fig. 2
Egr2 is induced in CD8 + TILs, but not peripheral CD8 + T cells in mouse tumour models. MC38 and B16 tumour models were established in Kin (GFP-Egr2) mice. The expression of Egr2, PD-1, Lag3 and the memory phenotype marker CD44 was analysed on CD8 + T cells from spleens and tumours 14 days after tumour cell inoculation. The results are representative of groups of five mice from two independent experiments
Fig. 3
Fig. 3
Deficiency of Egr2/3 in T cells reduces TIL cell numbers and increases tumour growth. Tumours were established in Kin (GFP-Egr2) and K2/3 (CD2-Egr2/3-/-) mice and analysed 14 days after injection. A and B. Tumours were isolated and compared. C. CD8 + TILs were isolated from the tumours and numbers were compared between Kin and K2/3 groups. Data in A are representative of 3 independent experiments. In B and C, the median, upper and lower quartiles from groups of 10 mice are shown and data were analysed with two-tailed Mann–Whitney tests
Fig. 4
Fig. 4
Checkpoint molecule expression by GFP-Egr2high, GFP-Egr2low and Egr2/3-/- TILs. MC38 or B16 tumour cells were injected into Kin (GFP-Egr2) and K2/3 (CD2-Egr2/3-/-) mice and TILs were analysed 14 days later. A and B. CD8 + TILs from Kin and K2/3 mice were analysed for expression of the indicated markers. C and D. CD8 + TILs were isolated from Kin mice and Egr2high and low cells were gated for analysis of checkpoint molecules. Data in A and C are representative of 6 (C and A, PD-1 and TIM3) or 5 (A, PD-1 and Lag3) mice in each group and are representative of two independent experiments. In B and D, the median, upper and lower quartiles from groups of 5 (B, PD-1 and Lag3) or 6 (D and B, PD-1 and TIM3) mice are shown and data were analysed with two-tailed Mann–Whitney tests
Fig. 5
Fig. 5
Deficiency of Egr2/3 in T cells impairs expansion and survival of CD8 + TIL, but has little effect on IFNγ production. TILs were isolated from MC38 or B16 tumours from Kin (GFP-Egr2) and K2/3 (CD2-Egr2/3-/-) mice 14 days after inoculation. A–F. IFNγ production (A and B), Ki67 expression (C and D) and Annexin V staining (E and F) were analysed. G and H. CD8 + TILs were labelled with Cell Trace Violet and stimulated for 72 h with anti-CD3 and anti-CD28 in vitro. After stimulation, proliferation was analysed by flow cytometry. I and J. CD8 + TILs from MC38 tumours from Kin mice were labelled with Cell Trace Violet before stimulation with anti-CD3 and anti-CD28 in vitro for 72 h. After stimulation, gated GFP-Egr2high and GFP-Egr2low cells were analysed for Ki67 expression and proliferation. Data in A, C, E, G, I are representative of 6 (A, C), 5 (E) or 4 (G, I) mice in each group and are representative of two independent experiments. In B, D, F, H and J the median, upper and lower quartiles from groups of 6 (B and D), 5 (F) or 4 (H, J) mice are shown and data were analysed with two-tailed Mann–Whitney tests
Fig. 6
Fig. 6
Defective expression of genes involved in proliferation and metabolism in Egr2/3-/- CD8 + TILs. MC38 and B16 tumours were established in Kin (GFP-Egr2) and K2/3 (CD2-Egr2/3-/-) mice. 14 days later, GFP-Egr2high and Egr2/3- /- TILs were isolated from Kin and K2/3 mice, respectively, and analysed by RNA-seq. A. Unsupervised hierarchical clustering of differentially expressed genes showing expression patterns in GFP-Egr2high and Egr2/3-/- TILs. Selected genes relevant to TIL function are indicated. B. GSEA of Hallmark gene sets [37] for GFP-Egr2high vs Egr2/3-/- TILs. Normalised enrichment is shown, with genesets enriched in GFP-Egr2high TILs having a positive score and genesets enriched in Egr2/3-/- TILs having a negative score. The RNA-seq data are from three biological replicates, each with cells pooled from 10 mice, for each group
Fig. 7
Fig. 7
Anti-PD-1 efficacy is reduced in K2/3 mice. MC38 tumours were established in Kin (GFP-Egr2) and K2/3 (CD2-Egr2/3-/-) mice. Anti-PD-1 was injected I.P. every 3 days post tumour implantation. 14 days after tumour implantation, tumour mass (A and B), CD8 TIL numbers (C) and PD-1 (D and E) and GFP-Egr2 (D and F) expression by CD8 + TILs was analysed. Data in A, D are representative of 8 (A) or 5 (D) mice in each group and are representative of two independent experiments. In B, C and E, the median, upper and lower quartiles from eight (B) or five (C, E and F) mice are shown, and data were analysed with Kruskal–Wallis tests, followed by two-tailed Conover tests with Benjamini–Hochberg correction (B, C and E), or two-tailed Mann–Whitney tests (F)

Similar articles

Cited by

References

    1. Smyth MJ, Dunn GP, Schreiber RD. Cancer immunosurveillance and immunoediting: the roles of immunity in suppressing tumor development and shaping tumor immunogenicity. Adv Immunol. 2006;90:1–50. doi: 10.1016/S0065-2776(06)90001-7. - DOI - PubMed
    1. Thommen DS, Schumacher TN. T cell dysfunction in cancer. Cancer Cell. 2018;33:547–562. doi: 10.1016/j.ccell.2018.03.012. - DOI - PMC - PubMed
    1. Kalbasi A, Ribas A. Tumour-intrinsic resistance to immune checkpoint blockade. Nat Rev Immunol. 2020;20:25–39. doi: 10.1038/s41577-019-0218-4. - DOI - PMC - PubMed
    1. Blank CU, Haining WN, Held W, et al. Defining “T cell exhaustion”. Nat Rev Immunol. 2019;19:665–674. doi: 10.1038/s41577-019-0221-9. - DOI - PMC - PubMed
    1. Williams JB, Horton BL, Zheng Y, et al. The EGR2 targets LAG-3 and 4–1BB describe and regulate dysfunctional antigen-specific CD8+ T cells in the tumor microenvironment. J Exp Med. 2017;214:381–400. doi: 10.1084/jem.20160485. - DOI - PMC - PubMed

MeSH terms

Substances