

Chromosome size matters: genome evolution in the cyperid clade
- PMID: 36342743
- PMCID: PMC9851305
- DOI: 10.1093/aob/mcac136
Chromosome size matters: genome evolution in the cyperid clade
Abstract
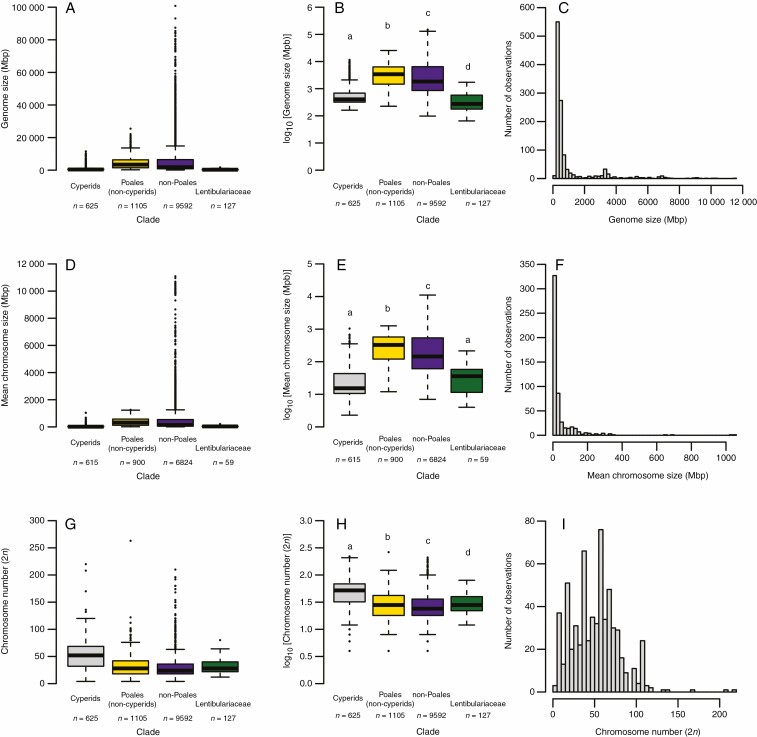
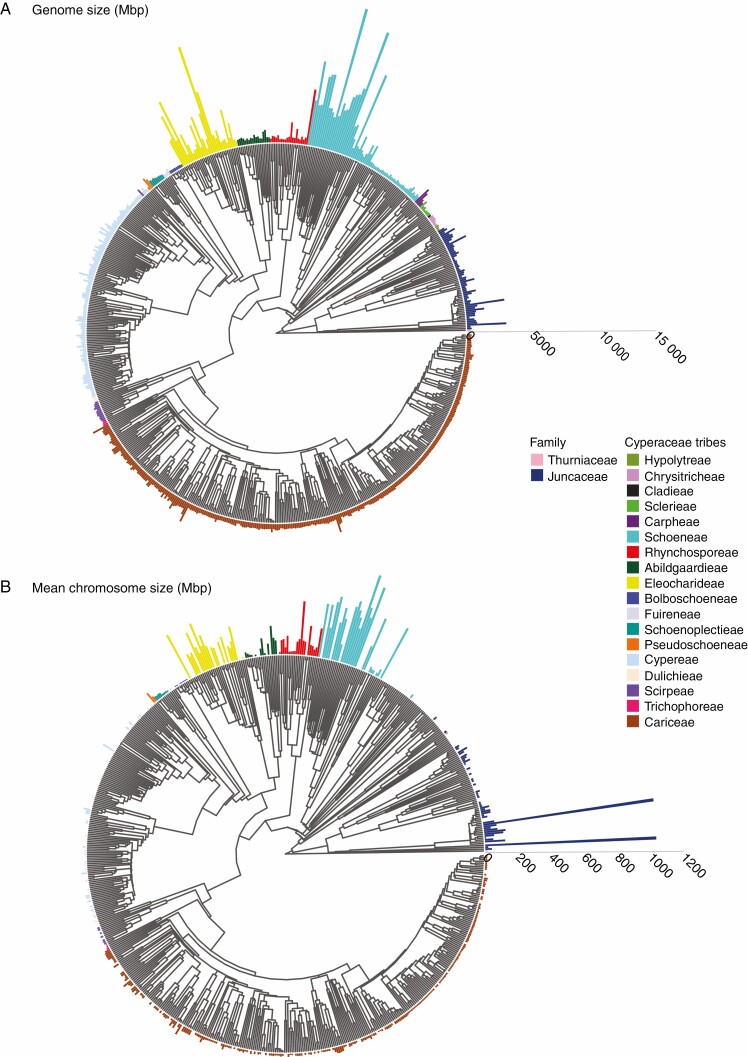
Background and aims: While variation in genome size and chromosome numbers and their consequences are often investigated in plants, the biological relevance of variation in chromosome size remains poorly known. Here, we examine genome and mean chromosome size in the cyperid clade (families Cyperaceae, Juncaceae and Thurniaceae), which is the largest vascular plant lineage with predominantly holocentric chromosomes.
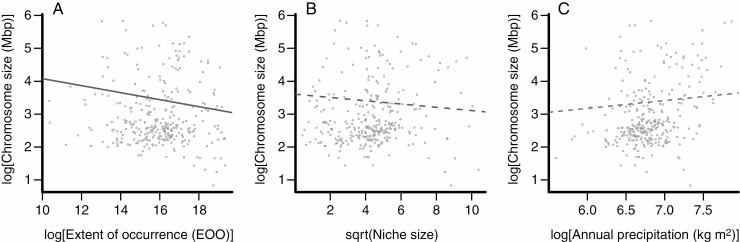
Methods: We measured genome size in 436 species of cyperids using flow cytometry, and augment these data with previously published datasets. We then separately compared genome and mean chromosome sizes (2C/2n) amongst the major lineages of cyperids and analysed how these two genomic traits are associated with various environmental factors using phylogenetically informed methods.
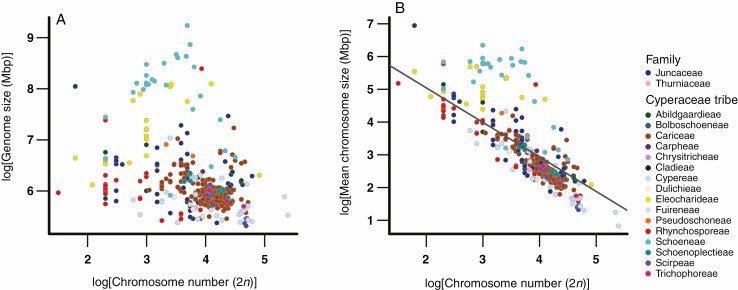
Key results: We show that cyperids have the smallest mean chromosome sizes recorded in seed plants, with a large divergence between the smallest and largest values. We found that cyperid species with smaller chromosomes have larger geographical distributions and that there is a strong inverse association between mean chromosome size and number across this lineage.
Conclusions: The distinct patterns in genome size and mean chromosome size across the cyperids might be explained by holokinetic drive. The numerous small chromosomes might function to increase genetic diversity in this lineage where crossovers are limited during meiosis.
Keywords: Chromosome number; Cyperaceae; Juncaceae; Thurniaceae; chromosome size; distribution range size; genome size; holocentric chromosomes; holokinetic drive.
© The Author(s) 2022. Published by Oxford University Press on behalf of the Annals of Botany Company. All rights reserved. For permissions, please e-mail: journals.permissions@oup.com.
Figures
Similar articles
-
Analysis of the small chromosomal Prionium serratum (Cyperid) demonstrates the importance of reliable methods to differentiate between mono- and holocentricity.Chromosoma. 2020 Dec;129(3-4):285-297. doi: 10.1007/s00412-020-00745-6. Epub 2020 Nov 9. Chromosoma. 2020. PMID: 33165742 Free PMC article.
-
Evolution of genome size and chromosome number in the carnivorous plant genus Genlisea (Lentibulariaceae), with a new estimate of the minimum genome size in angiosperms.Ann Bot. 2014 Dec;114(8):1651-63. doi: 10.1093/aob/mcu189. Epub 2014 Oct 1. Ann Bot. 2014. PMID: 25274549 Free PMC article.
-
Evolution of genome size and genomic GC content in carnivorous holokinetics (Droseraceae).Ann Bot. 2017 Feb;119(3):409-416. doi: 10.1093/aob/mcw229. Epub 2016 Dec 26. Ann Bot. 2017. PMID: 28025291 Free PMC article.
-
Holocentric chromosomes: convergent evolution, meiotic adaptations, and genomic analysis.Chromosome Res. 2012 Jul;20(5):579-93. doi: 10.1007/s10577-012-9292-1. Chromosome Res. 2012. PMID: 22766638 Review.
-
[Mutagenesis and plant phylogenesis].Tsitologiia. 2007;49(6):433-41. Tsitologiia. 2007. PMID: 17802740 Review. Russian.
Cited by
-
Global analysis of Poales diversification - parallel evolution in space and time into open and closed habitats.New Phytol. 2024 Apr;242(2):727-743. doi: 10.1111/nph.19421. Epub 2023 Nov 27. New Phytol. 2024. PMID: 38009920 Free PMC article.
-
Founder events and subsequent genetic bottlenecks underlie karyotype evolution in the Ibero-North African endemic Carex helodes.Ann Bot. 2024 May 10;133(5-6):871-882. doi: 10.1093/aob/mcad087. Ann Bot. 2024. PMID: 37400416 Free PMC article.
-
Centromere drive may propel the evolution of chromosome and genome size in plants.Ann Bot. 2024 Dec 31;134(6):1067-1076. doi: 10.1093/aob/mcae149. Ann Bot. 2024. PMID: 39196767 Free PMC article.
-
Repeat competition and ecological shifts drive the evolution of the mobilome in Rhynchospora Vahl (Cyperaceae), the holocentric beaksedges.Ann Bot. 2025 May 9;135(5):909-924. doi: 10.1093/aob/mcae220. Ann Bot. 2025. PMID: 39693387
-
The evolutionary landscape of prokaryotic chromosome/plasmid balance.Commun Biol. 2024 Nov 4;7(1):1434. doi: 10.1038/s42003-024-07167-5. Commun Biol. 2024. PMID: 39496780 Free PMC article.
References
-
- Avdulov NP. 1931. Karyo-systematische untersuchungen der familie Gramineen. Bulletin of Applied Botany, of Genetics and Plant Breeding, Leningrad 44: 1–428.
-
- Benjamini Y, Hochberg Y. 1995. Controlling the false discovery rate: a practical and powerful approach to multiple testing. Journal of the Royal Statistical Society: Series B (Methodological) 57: 28989–28300. doi: 10.1111/j.2517-6161.1995.tb02031.x. - DOI
-
- Bennett MD. 1987. Variation in genomic form in plants and its ecological implications. New Phytologist 106: 177–200.
Publication types
MeSH terms
LinkOut - more resources
Full Text Sources
Research Materials
