. 2022 Nov 7;20(11):e3001844.
doi: 10.1371/journal.pbio.3001844. eCollection 2022 Nov.

Autotoxin-mediated latecomer killing in yeast communities

Affiliations

Autotoxin-mediated latecomer killing in yeast communities

Arisa H Oda et al. PLoS Biol. .

Abstract

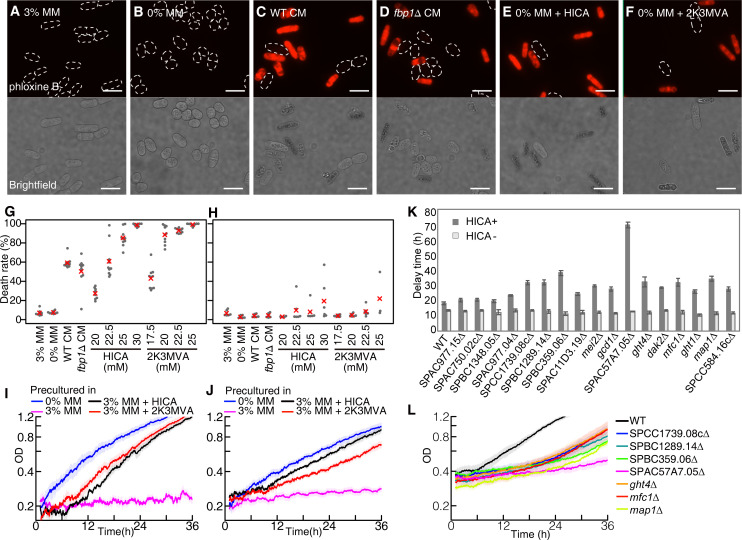
Cellular adaptation to stressful environments such as starvation is essential to the survival of microbial communities, but the uniform response of the cell community may lead to entire cell death or severe damage to their fitness. Here, we demonstrate an elaborate response of the yeast community against glucose depletion, in which the first adapted cells kill the latecomer cells. During glucose depletion, yeast cells release autotoxins, such as leucic acid and L-2keto-3methylvalerate, which can even kill the clonal cells of the ones producing them. Although these autotoxins were likely to induce mass suicide, some cells differentiated to adapt to the autotoxins without genetic changes. If nondifferentiated latecomers tried to invade the habitat, autotoxins damaged or killed the latecomers, but the differentiated cells could selectively survive. Phylogenetically distant fission and budding yeast shared this behavior using the same autotoxins, suggesting that latecomer killing may be the universal system of intercellular communication, which may be relevant to the evolutional transition from unicellular to multicellular organisms.


Conflict of interest statement

I have read the journal’s policy and the authors of this manuscript have the following competing interests: Patent applications have been filed for the technology described in this publication. A.H.O., T.S.H., and K.O. are named as the inventors of these patents. The remaining authors declare no competing interests.

Figures

Fig 1
Fig 1. Conditioned media caused a delay phase of cell growth and latecomer killing during glucose depletion.
(A) Schematic illustration of the experimental procedure for (B) and (C). (B and C) Growth curves of WT cells in (B) WT or (C) fbp1Δ CM without glucose. Different colored lines indicate a moving average of OD measured every minute in CM with different incubation times. Each line is an average of n≥10 samples, and the pale-colored area indicates the SEM. (D) Schematic illustration of the experimental procedure for (E). (E) Growth curves of WT cells in CM with 3% glucose. Each line represents an average of n≥7 samples. (F) Schematic illustration of the experimental procedure for (G). (G) Growth curves of WT cells, precultured without glucose, in the CM. Each line represents an average of n≥7 samples. (H and I) Competition assay in WT CM (H) between the cells precultured in 3% and 0% MM and (I) between the cells precultured in 0% MM. Green and red areas indicate the fraction of mNeonGreen- and mCherry-labelled cells, respectively, and overwriting outline characters indicate preculture conditions. Black vertical bars between 2 areas indicate SEM (the number of each sample is 12). The data underlying this figure can be found in S1 Data. CM, conditioned media; MM, minimal media; OD, optical density; SEM, standard error of the mean; WT, wild-type.
Fig 2
Fig 2. Identification of growth inhibitors.
(A) Venn diagram of compounds detected using CE-MS. Compounds in 0% MM, WT CM, and fbp1Δ CM were analysed. Twenty compounds were detected in both WT and fbp1Δ CM, and 8 of those were also detected in 0% MM. Thus, 12 compounds (hatching area) were detected uniquely in both types of CM (see Table A in S1 Text for details of the detected molecules). (B and C) The structure of (B) HICA and (C) 2K3MVA. (D and E) Growth curves in 0% MM in the presence of (D) HICA and (E) 2K3MVA. WT cells precultured in 3% MM were transferred to 0% MM with various concentrations of the inhibitory compound at 0 h. Each line represents the average of n≥6 samples. (F and G) Effects of adaptation and glucose administration on growth curves in the presence of (F) 30 mM HICA or (G) 25 mM 2K3MVA. The blue line indicates the growth curve of WT cells precultured in 0% MM in 0% MM with the inhibitory compound. The orange line is a growth curve of WT cells in MM with the inhibitory compound and 3% glucose. Pink and black lines indicate growth curves in 0% MM with the inhibitory compound and 3% MM as controls, respectively. Each line represents an average of n≥4 samples. (H and I) Cells precultured in 3% MM were inoculated to WT CM with additional HICA, 2K3MVA, or the mixture. (H) Growth curves and (I) length of the delay phase τ were plotted. A line for WT CM represents an average of n = 22 samples, and those for WT CM with the growth inhibitors represent an average of n = 3 samples. The data underlying this figure can be found in S1 Data. CE-MS, capillary electrophoresis mass spectrometry; CM, conditioned media; MM, minimal media; WT, wild-type.
Fig 3
Fig 3. Identified molecules kill cells and also facilitate cell adaptation to the molecule and deletion of some genes up-regulated in adapted cells prolonged the delay phase.
(AF) Fluorescent (upper) and brightfield (bottom) microscopic images of WT cells in various media after 24 h of incubation. Cells precultured in 3% MM were transferred to (A) 3% MM, (B) 0% MM, (C) WT CM, (D) fbp1Δ CM, (E) 0% MM with 25 mM HICA, and (F) 22.5 mM 2K3MVA. In fluorescent microscopic images, dead cells were stained with phloxine B. Scale bar indicates 10 μm. (G and H) The dyed cell ratio after 8 h of incubation. Cells were precultured in (G) 3% MM (n = 8–10) or (H) 0% MM (n = 3–6). Grey dots represent the dyed cell ratio in each sample, and red crosses represent the mean value. (I and J) Growth curves of cells precultured in the presence of one of the inhibitory molecules along with 3% glucose, in 0% MM with (I) 30 mM HICA or (J) 25 mM 2K3MVA. Cells were precultured in 0% MM (blue line), 3% MM (pink line), 3% MM with 30 mM HICA (black line), and 3% MM with 25 mM 2K3MVA (red line). (K) Calculated length of the delay phase in deletion mutant strains, where the relevant genes were up-regulated in adapted cells (see Table E in S1 Text for a list of the genes). The deletion mutants and WT cells were precultured in 3% MM with 30 mM HICA for 24 h and inoculated into 0% MM with or without 30 mM HICA. The time point when the initial concentration doubled, τ, for the SPAC57A7.05Δ strain was much longer than the observed time range, and thus we calculated the time when the initial concentration was 1.5 times higher. Then, we extrapolated by multiplying the value by log2/log1.5. (L) Growth curves of some deletion mutants that showed the significant prolongation of the delay phase longer than 30 h in 0% MM with 30 mM HICA. Each line represents an average of n≥4 samples. See S13 Fig for the growth curves of the rest of the mutants. The data underlying this figure can be found in S1 and S3 Data. CM, conditioned media; MM, minimal media; WT, wild-type.
Fig 4
Fig 4. Media conditioned with various strains of yeasts initiated the delay phase.
(A) Growth curves of S. cerevisiae (OC-2) cells in media conditioned with themselves. Different colored lines indicate growth curves of CM at different incubation times. Each line represents an average of n≥6 samples. (B) Growth curves of OC-2 in 0% MM with various concentrations of HICA. Each line represents an average of n≥5 samples. (C) Growth curves of OC-2 in 0% MM with various concentrations of 2K3MVA. Each line represents an average of n≥5 samples. (D) Growth curves of OC-2 precultured in 0% or 3% MM grown in OC-2 CM. Each line represents an average of n≥6 samples. (E) Growth curves of OC-2 precultured in 0% or 3% MM grown in 0% MM with 25 mM HICA or 25 mM 2K3MVA. Each line represents an average of n≥6 samples. (F, G, and H) Growth curves of (F) S. pombe, (G) OC-2, and (H) YEA8 in media conditioned with S. pombe, OC-2, or YEA8 for 30 h. Each line represents an average of n≥6 samples. The data underlying this figure can be found in S1 Data. CM, conditioned media; MM, minimal media.

References

    1. Takeshige K, Baba M, Tsuboi S, Noda T, Ohsumi Y. Autophagy in yeast demonstrated with proteinase-deficient mutants and conditions for its induction. J Cell Biol. 1992;119(2):301–311. doi: 10.1083/jcb.119.2.301 - DOI - PMC - PubMed
    1. Barkai N, Leibler S. Robustness in simple biochemical networks. Nature. 1997;387(6636):913–917. doi: 10.1038/43199 - DOI - PubMed
    1. Nguyen D, Joshi-Datar A, Lepine F, Bauerle E, Olakanmi O, Beer K, et al.. Active starvation responses mediate antibiotic tolerance in biofilms and nutrient-limited bacteria. Science. 2011;334(6058):982–986. doi: 10.1126/science.1211037 - DOI - PMC - PubMed
    1. Aertsen A, Michiels CW. Stress and how bacteria cope with death and survival. Crit Rev Microbiol. 2004;30(4):263–273. doi: 10.1080/10408410490884757 - DOI - PubMed
    1. Opalek M, Wloch-Salamon D. Aspects of Multicellularity in Saccharomyces cerevisiae Yeast: A Review of Evolutionary and Physiological Mechanisms. Genes. 2020;11(6):690. doi: 10.3390/genes11060690 - DOI - PMC - PubMed

Publication types

LinkOut - more resources