

Epidemiology and trends in stroke mortality in the USA, 1975-2019
- PMID: 36343092
- PMCID: PMC10244057
- DOI: 10.1093/ije/dyac210
Epidemiology and trends in stroke mortality in the USA, 1975-2019
Abstract
Background: Whether changes in stroke mortality are affected by age distribution and birth cohorts, and if the decline in stroke mortality exhibits heterogeneity by stroke type, remains uncertain.
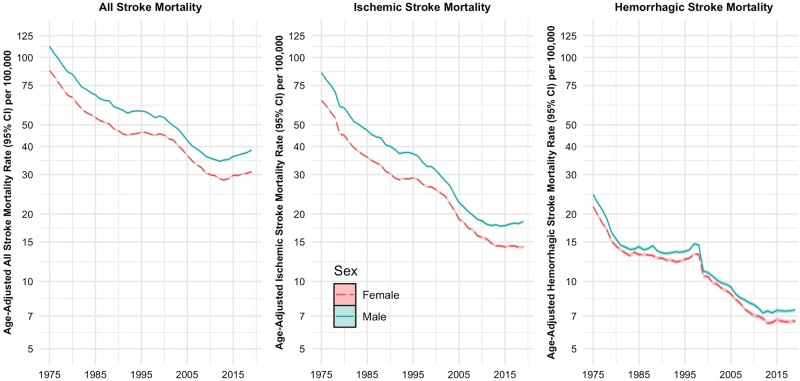
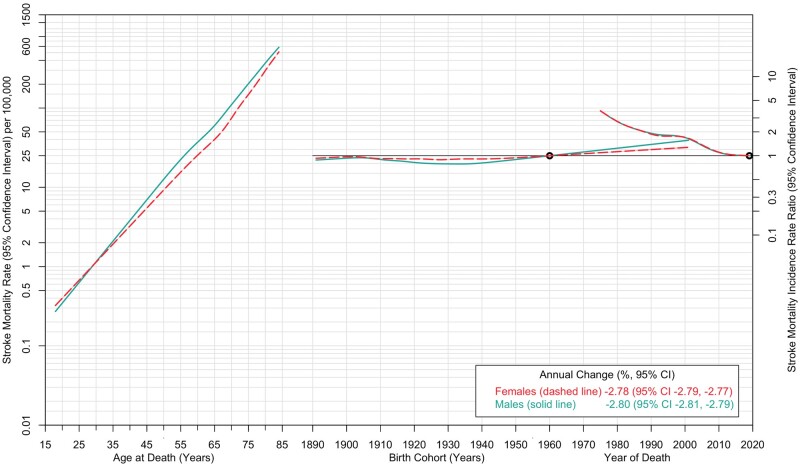
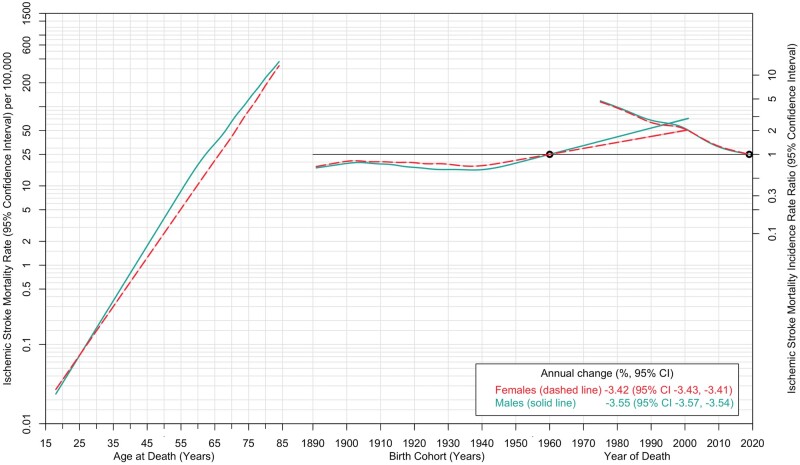
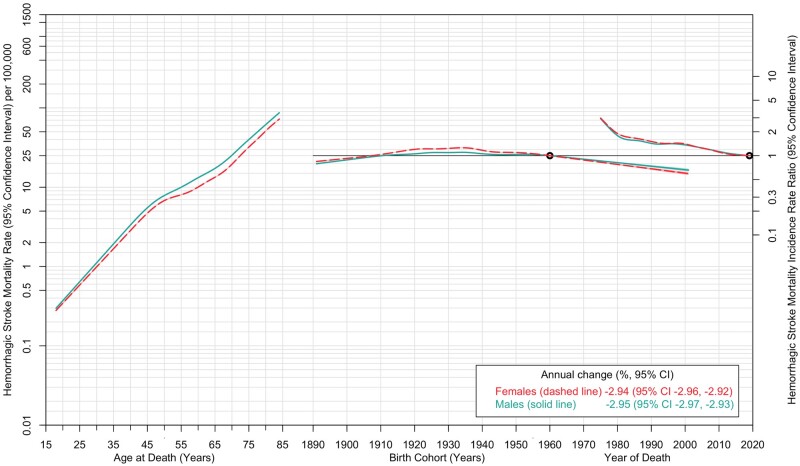
Methods: We undertook a sequential time series analysis to examine stroke mortality trends in the USA among people aged 18-84 years between 1975 and 2019 (n = 4 332 220). Trends were examined for overall stroke and by ischaemic and haemorrhagic subtypes. Mortality data were extracted from the US death files, and age-sex population data were extracted from US census. Age-standardized stroke mortality rates and incidence rate ratio (IRR) with 95% confidence interval [CI] were derived from Poisson regression models.
Results: Age-standardized stroke mortality declined for females from 87.5 in 1975 to 30.9 per 100 000 in 2019 (IRR 0.27, 95% CI 0.26, 0.27; average annual decline -2.78%, 95% CI -2.79, -2.78). Among males, age-standardized mortality rate declined from 112.1 in 1975 to 38.7 per 100 000 in 2019 (RR 0.26, 95% CI 0.26, 0.27; average annual decline -2.80%, 95% CI -2.81, -2.79). Stroke mortality increased sharply with advancing age. Decline in stroke mortality was steeper for ischaemic than haemorrhagic strokes.
Conclusions: Stroke mortality rates have substantially declined, more so for ischaemic than haemorrhagic strokes.
Keywords: Stroke; age-period-cohort analysis; haemorrhagic stroke; ischaemic stroke; mortality; sex.
© The Author(s) 2022; all rights reserved. Published by Oxford University Press on behalf of the International Epidemiological Association.
Conflict of interest statement
None declared.
Figures
References
-
- Heron M. Deaths: leading causes for 2017. Natl Vital Stat Rep 2019;68:1–77. - PubMed
-
- Cholesterol, diastolic blood pressure, and stroke: 13,000 strokes in 450,000 people in 45 prospective cohorts. Prospective studies collaboration. Lancet 1995;346:1647–53. - PubMed
-
- O'Donnell MJ, Xavier D, Liu L. et al.; INTERSTROKE investigators. Risk factors for ischaemic and intracerebral haemorrhagic stroke in 22 countries (the INTERSTROKE study): a case-control study. Lancet 2010;376:112–23. - PubMed
-
- Virani SS, Alonso A, Aparicio HJ. et al.; American Heart Association Council on Epidemiology and Prevention Statistics Committee and Stroke Statistics Subcommittee. Heart disease and stroke statistics-2021 update: a report from the American Heart Association. Circulation 2021;143:e254–743. - PubMed
Publication types
MeSH terms
Grants and funding
LinkOut - more resources
Full Text Sources
Medical
