. 2022 Nov 16;119(46):e2210247119.
doi: 10.1073/pnas.2210247119. Epub 2022 Nov 7.

Functional genomics of OCTN2 variants informs protein-specific variant effect predictor for Carnitine Transporter Deficiency

Affiliations

Functional genomics of OCTN2 variants informs protein-specific variant effect predictor for Carnitine Transporter Deficiency

Megan L Koleske et al. Proc Natl Acad Sci U S A. .

Abstract

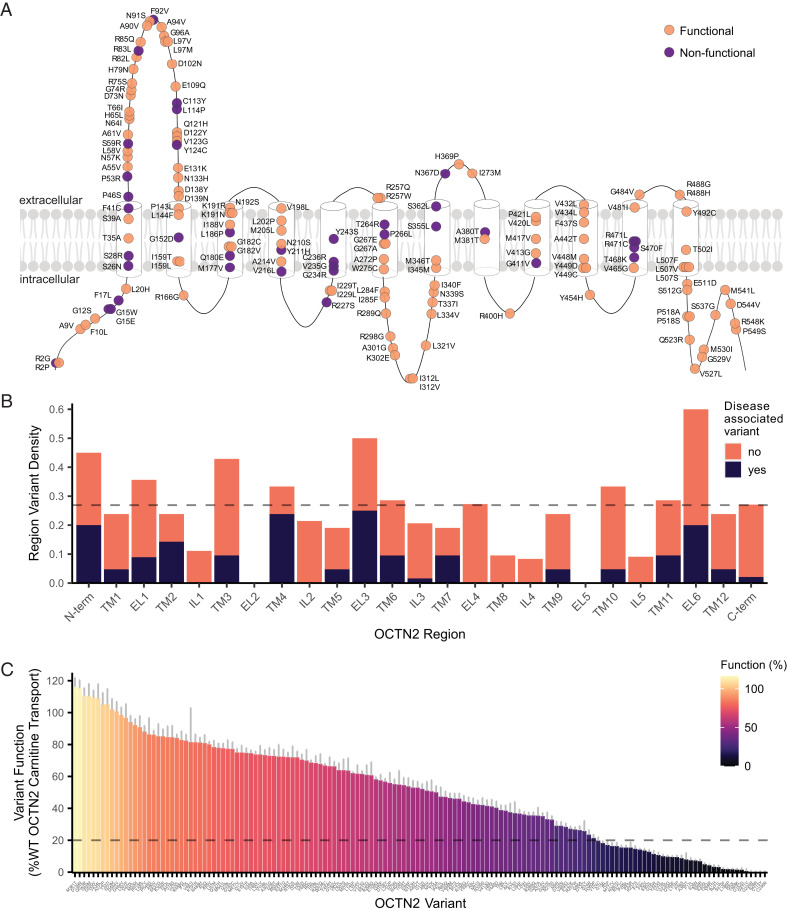
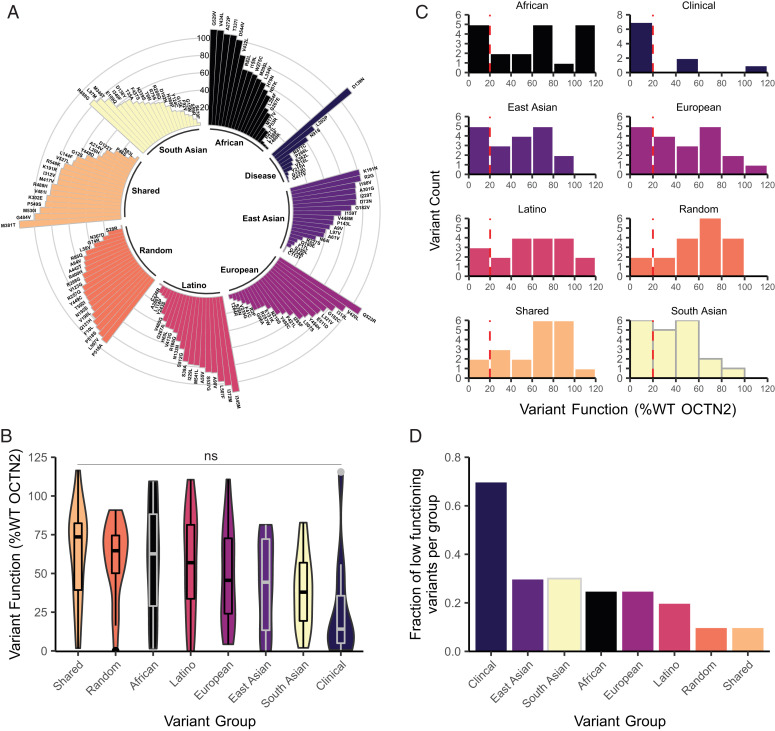
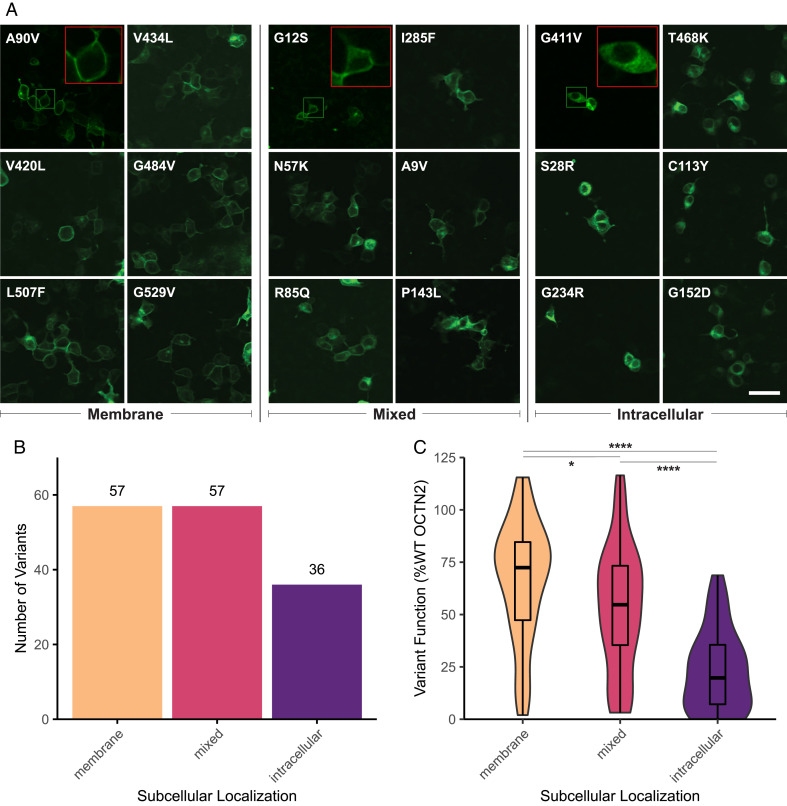
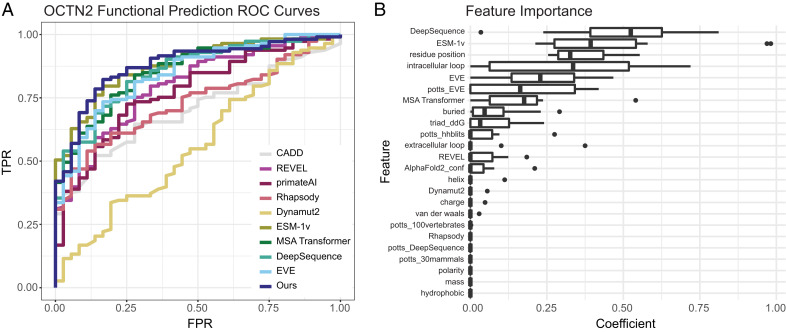
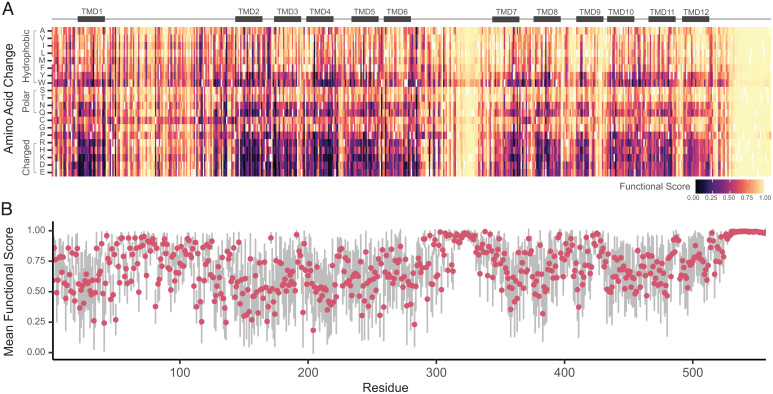
Genetic variants in SLC22A5, encoding the membrane carnitine transporter OCTN2, cause the rare metabolic disorder Carnitine Transporter Deficiency (CTD). CTD is potentially lethal but actionable if detected early, with confirmatory diagnosis involving sequencing of SLC22A5. Interpretation of missense variants of uncertain significance (VUSs) is a major challenge. In this study, we sought to characterize the largest set to date (n = 150) of OCTN2 variants identified in diverse ancestral populations, with the goals of furthering our understanding of the mechanisms leading to OCTN2 loss-of-function (LOF) and creating a protein-specific variant effect prediction model for OCTN2 function. Uptake assays with 14C-carnitine revealed that 105 variants (70%) significantly reduced transport of carnitine compared to wild-type OCTN2, and 37 variants (25%) severely reduced function to less than 20%. All ancestral populations harbored LOF variants; 62% of green fluorescent protein (GFP)-tagged variants impaired OCTN2 localization to the plasma membrane of human embryonic kidney (HEK293T) cells, and subcellular localization significantly associated with function, revealing a major LOF mechanism of interest for CTD. With these data, we trained a model to classify variants as functional (>20% function) or LOF (<20% function). Our model outperformed existing state-of-the-art methods as evaluated by multiple performance metrics, with mean area under the receiver operating characteristic curve (AUROC) of 0.895 ± 0.025. In summary, in this study we generated a rich dataset of OCTN2 variant function and localization, revealed important disease-causing mechanisms, and improved upon machine learning-based prediction of OCTN2 variant function to aid in variant interpretation in the diagnosis and treatment of CTD.

Keywords: machine learning; rare disease; transporter; variant interpretation.


Conflict of interest statement

The authors declare no competing interest.

Figures

Fig. 1.
Fig. 1.
Functional characterization of OCTN2 variants. (A) Two-dimensional location of variants selected for characterization along the predicted secondary structure of OCTN2. Variants are colored by functional status; variants in orange are functional (>20% WT OCTN2 carnitine transport) and variants in purple are nonfunctional (<20% transport). (B) Density of variants characterized in each topological region of OCTN2. Variants that have been clinically associated with CTD are shown in orange, and variants that have no known clinical association are shown in purple. The dashed line represents the average density of assayed variants across all regions. N-term, N terminus; TM, transmembrane domain; EL, extracellular loop; IL, intracellular loop; C-term, C terminus. (C) Functional characterization of 150 OCTN2 variants with respect to 14C-carnitine uptake in OCTN2-expressing HEK293T cells. Each bar represents the function of an individual OCTN2 variant represented as percentage of WT OCTN2 carnitine transport. The dashed line at 20% function represents the threshold below which variants may increase susceptibility for CTD. Data represent mean ± SEM of three individual biological replicates, all performed in triplicate.
Fig. 2.
Fig. 2.
Functional distribution of variants by ancestral group. (A) Function of individual OCTN2 variants in each ancestral group. Height of bars (radial y axis) represents variant function (%WT OCTN2 carnitine transport). (B) Violin plots summarize the function of variants in each group. Each embedded box plot summarizes median, interquartile range, and whiskers in the style of Tukey. ns, not significant as determined by ANOVA with Tukey post hoc test. (C) Histogram of the distribution of variants from each group into functional bins. Vertical red dotted line illustrates the cutoff of 20% function, below which variants have increased risk for CTD. (D) Fraction of low-functioning variants (<20% WT) assayed in each variant group.
Fig. 3.
Fig. 3.
Subcellular localization of OCTN2 variants. (A) Representative images of OCTN2 variants conjugated to msfGFP in HEK293T cells. Three distinct patterns were observed: membrane localization (Left), intracellular localization (Middle), and mixed localization (Right). (Scale bar, 50 µm and is consistent for all images.) One Inset is shown for each localization pattern with original area outlined in green and 3× zoom in Upper Right Corner outlined in red. (B) Distribution of variants with each subcellular localization pattern. (C) Box plot–embedded violin plots show distribution of variant function with respect to carnitine transport based on variant subcellular localization. Box plots display median and interquartile range (IQR), and whiskers extend to the most extreme value no more than 1.5*IQR in either direction. *P value < 0.05; ****P value < 0.0001; Welch’s ANOVA between means with Games-Howell post hoc test.
Fig. 4.
Fig. 4.
Performance of OCTN2 functional classification model. (A) Receiver operator characteristics (ROC) curve for our model compared to other variant effect prediction models. FPR, false-positive rate; TPR, true-positive rate. (B) Importance of features in performance of our model by normalized LASSO coefficient. Feature importance is represented in box plots for each feature showing the distribution of beta-coefficient from the LASSO model across each fold in 10-fold repeated random sampling. Middle bar and width of box plots represent median coefficient and interquartile range (IQR), respectively, and whiskers extend to the most extreme value no more than 1.5*IQR in either direction. Values for each feature were scaled independently from 0 to 1 prior to model training in order to make coefficients directly comparable. Features are described in depth in SI Appendix, SI Text.
Fig. 5.
Fig. 5.
Predicted function of all possible missense variants in OCTN2. (A) Normalized functional score for all possible substitutions at every residue. Functional scores greater than 0.5 indicate function greater than 20% of WT OCTN2 function, with scores closer to 1 indicating increased confidence in prediction; functional scores less than 0.5 indicate function less than 20% of WT OCTN2, with scores closer to 0 indicating increased confidence in prediction. Reference residues are colored in white. Cartoon of OCTN2 secondary structure is aligned above heatmap. TMD, transmembrane domain. (B) Mean functional score for each residue position. Dots and bars represent mean and SD of functional score for all residues at that position, respectively.

Similar articles

Cited by

References

    1. Lin L., Yee S. W., Kim R. B., Giacomini K. M., SLC transporters as therapeutic targets: Emerging opportunities. Nat. Rev. Drug Discov. 14, 543–560 (2015). - PMC - PubMed
    1. Ferreira C. R., van Karnebeek C. D. M., Vockley J., Blau N., A proposed nosology of inborn errors of metabolism. Genet. Med. 21, 102–106 (2019). - PMC - PubMed
    1. Online Mendelian Inheritance in Man (McKusick-Nathans Institute of Genetic Medicine, Johns Hopkins University, Baltimore, MD: ).
    1. Rinaldo P., Stanley C. A., Hsu B. Y., Sanchez L. A., Stern H. J., Sudden neonatal death in carnitine transporter deficiency. J. Pediatr. 131, 304–305 (1997). - PubMed
    1. Rasmussen J., et al. , Increased risk of sudden death in untreated primary carnitine deficiency. J. Inherit. Metab. Dis. 43, 290–296 (2020). - PubMed

Publication types

Substances

Supplementary concepts