. 2023 Mar 20;41(9):1695-1702.
doi: 10.1200/JCO.21.01987. Epub 2022 Nov 7.

In Multiple Myeloma, High-Risk Secondary Genetic Events Observed at Relapse Are Present From Diagnosis in Tiny, Undetectable Subclonal Populations

Affiliations

In Multiple Myeloma, High-Risk Secondary Genetic Events Observed at Relapse Are Present From Diagnosis in Tiny, Undetectable Subclonal Populations

Romain Lannes et al. J Clin Oncol. .

Abstract

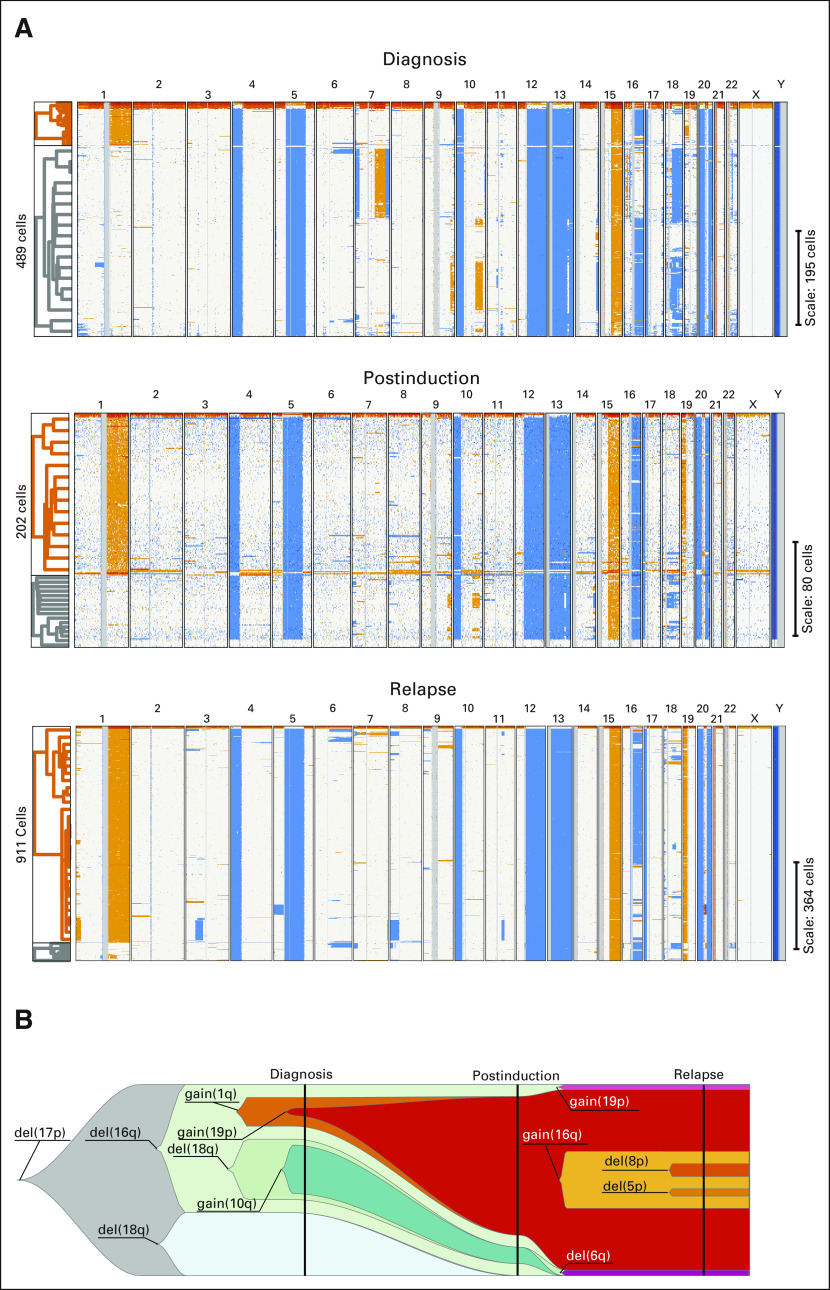
Purpose: Multiple myeloma (MM) is characterized by copy number abnormalities (CNAs), some of which influence patient outcomes and are sometimes observed only at relapse(s), suggesting their acquisition during tumor evolution. However, the presence of micro-subclones may be missed in bulk analyses. Here, we use single-cell genomics to determine how often these high-risk events are missed at diagnosis and selected at relapse.

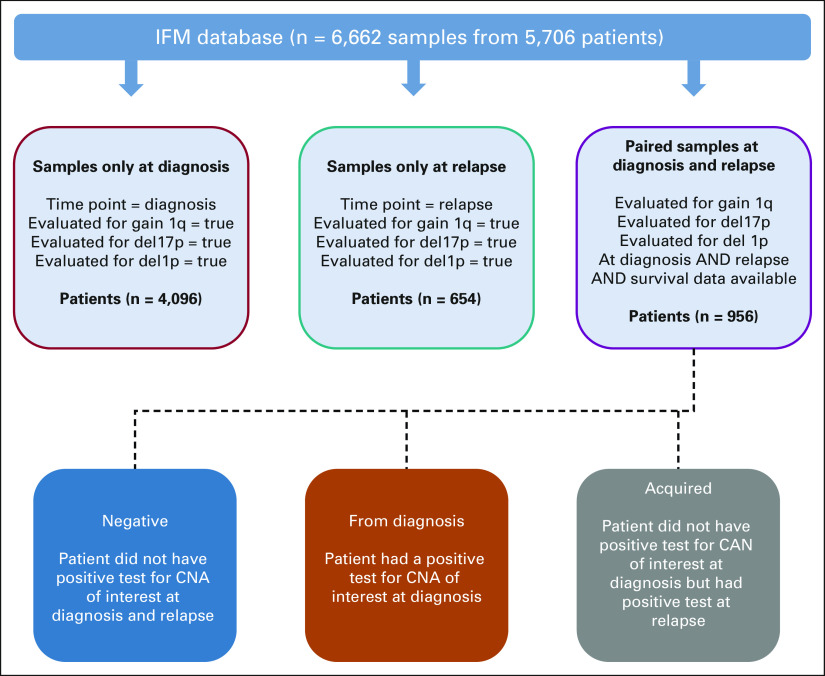
Materials and methods: We analyzed 81 patients with plasma cell dyscrasias using single-cell CNA sequencing. Sixty-six patients were selected at diagnosis, nine at first relapse, and six in presymptomatic stages. A total of 956 newly diagnosed patients with MM and patients with first relapse MM have been identified retrospectively with required cytogenetic data to evaluate enrichment of CNA risk events and survival impact.

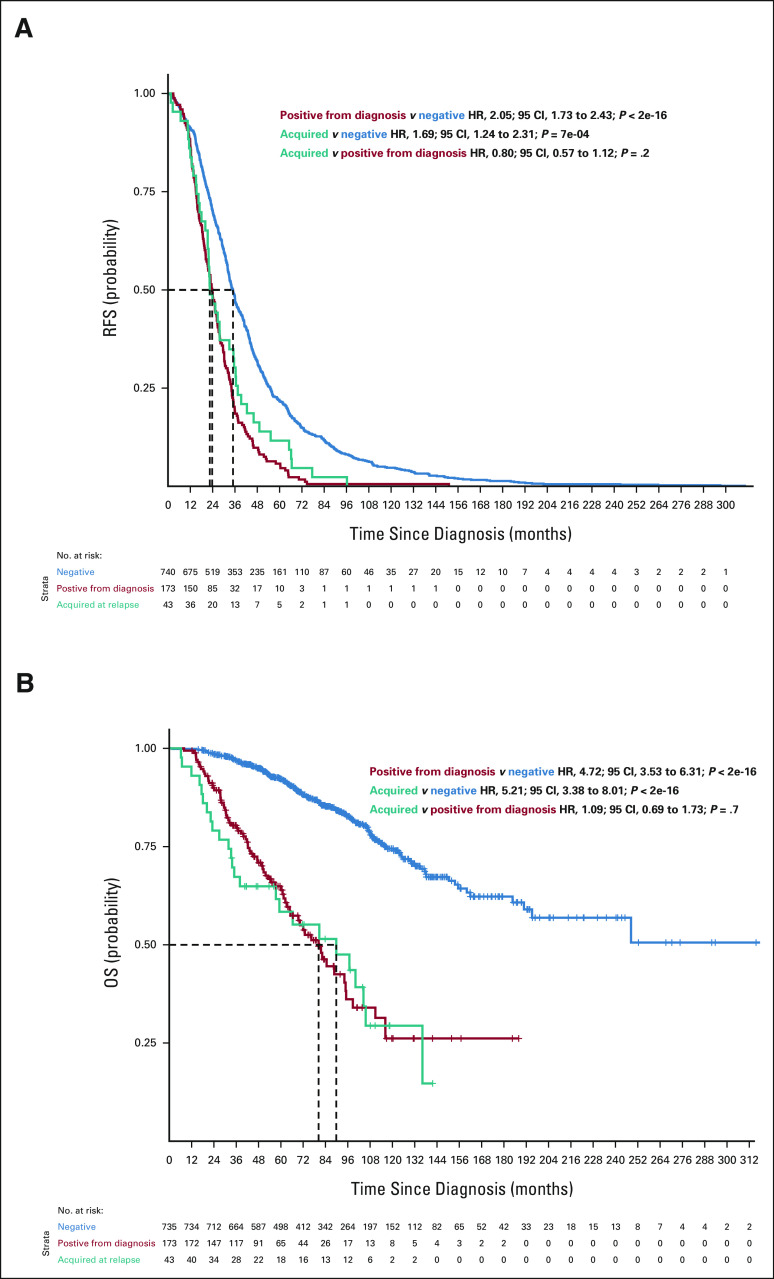
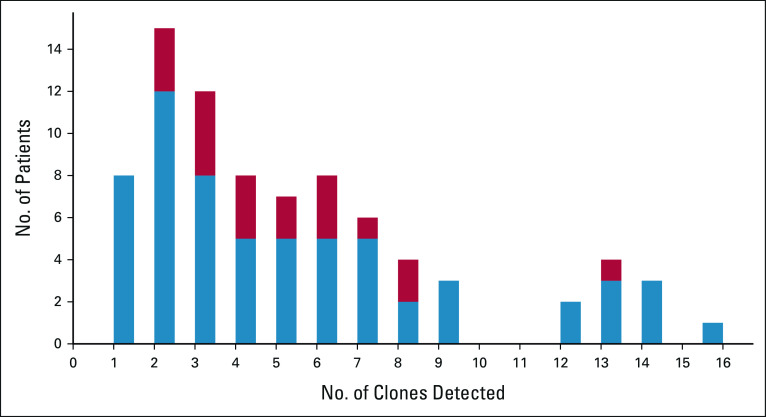
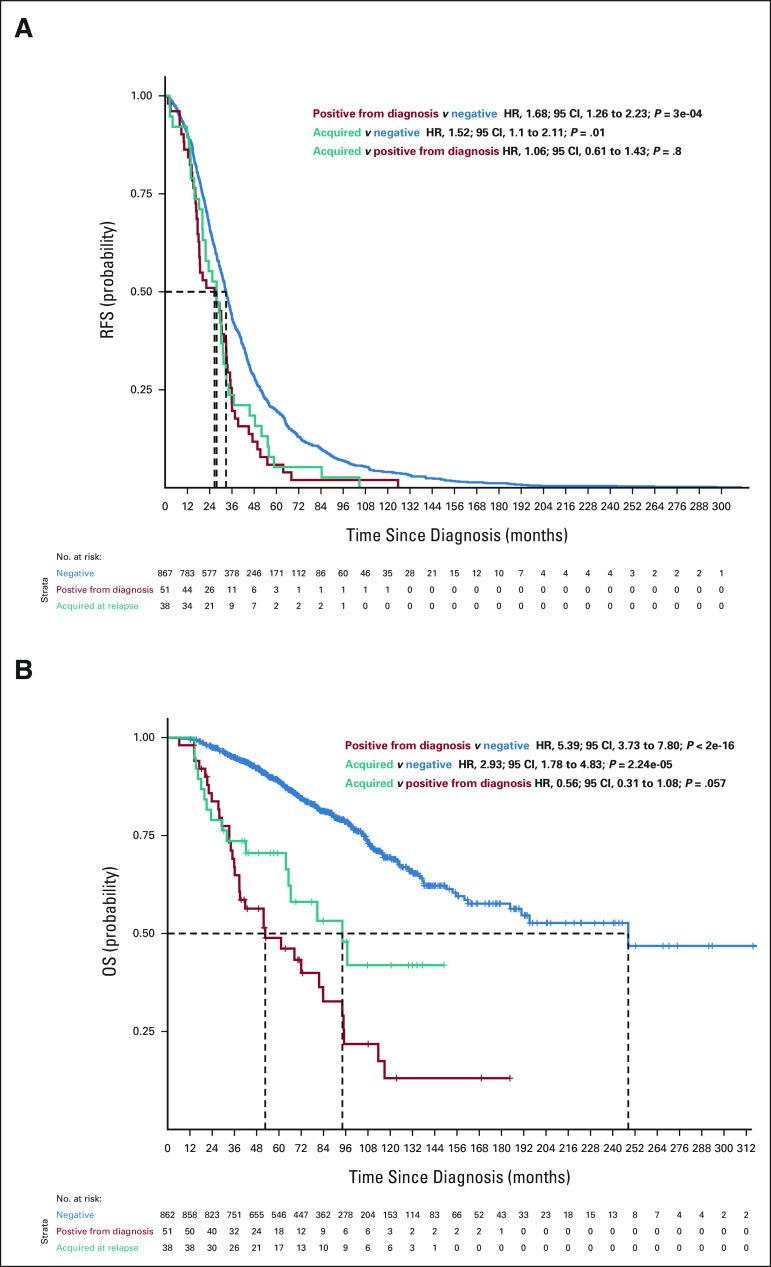
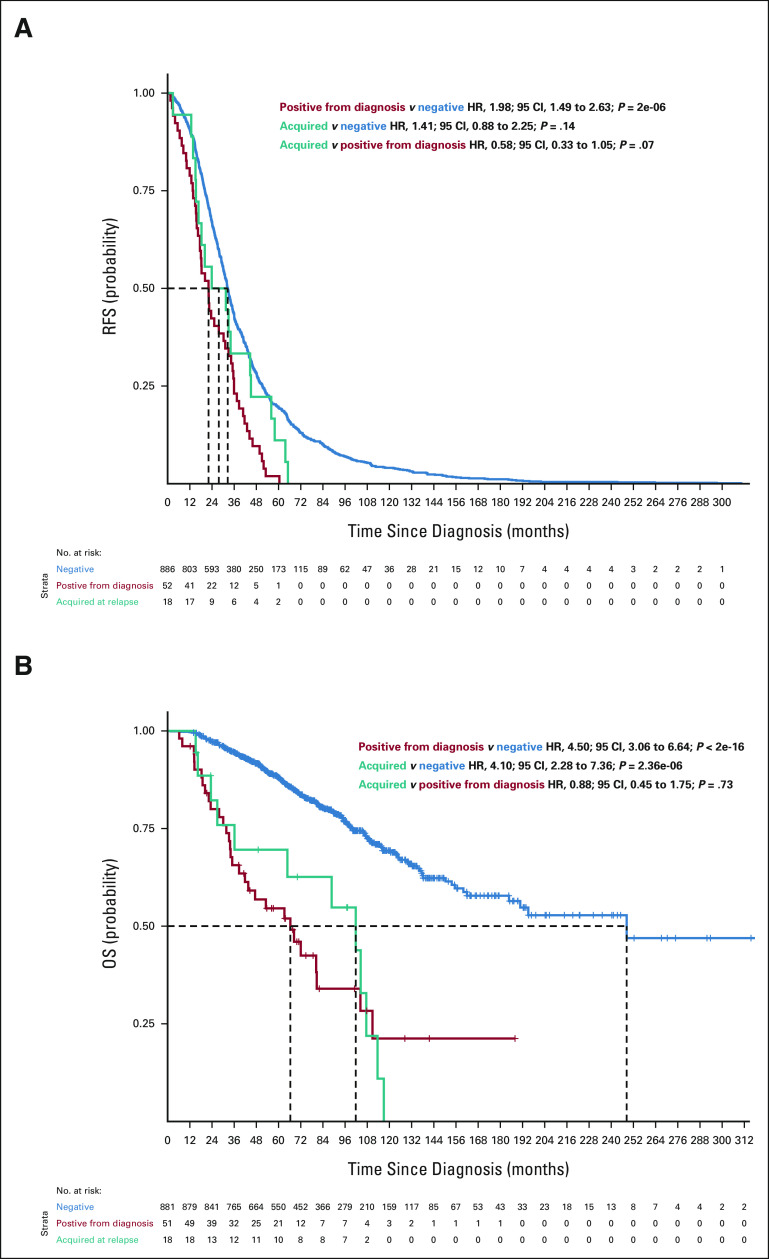
Results: A total of 52,176 MM cells were analyzed. Seventy-four patients (91%) had 2-16 subclones. Among these patients, 28.7% had a subclone with high-risk features (del(17p), del(1p32), and 1q gain) at diagnosis. In a patient with a subclonal 1q gain at diagnosis, we analyzed the diagnosis, postinduction, and first relapse samples, which showed a rise of the high-risk 1q gain subclone (16%, 70%, and 92%, respectively). In our clinical database, we found that the 1q gain frequency increased from 30.2% at diagnosis to 43.6% at relapse (odds ratio, 1.78; 95% CI, 1.58 to 2.00). We subsequently performed survival analyses, which showed that the progression-free and overall survival curves were superimposable between patients who had the 1q gain from diagnosis and those who seemingly acquired it at relapse. This strongly suggests that many patients had 1q gains at diagnosis in microclones that were missed by bulk analyses.

Conclusion: These data suggest that identifying these scarce aggressive cells may necessitate more aggressive treatment as early as diagnosis to prevent them from becoming the dominant clone.


Conflict of interest statement

In Multiple Myeloma, High-Risk Secondary Genetic Events Observed at Relapse are Present From Diagnosis in Tiny, Undetectable Subclonal Populations

The following represents disclosure information provided by authors of this manuscript. All relationships are considered compensated unless otherwise noted. Relationships are self-held unless noted. I = Immediate Family Member, Inst = My Institution. Relationships may not relate to the subject matter of this manuscript. For more information about ASCO's conflict of interest policy, please refer to www.asco.org/rwc or ascopubs.org/jco/authors/author-center.

Open Payments is a public database containing information reported by companies about payments made to US-licensed physicians (Open Payments).

Figures

FIG 1.
FIG 1.
(A) Single-cell CNA plots for patient #T19979. Each line represents CNA for a single cell. Blue represents losses, and orange represents gains. The samples at diagnosis, after induction, and at relapse are shown from top to bottom, respectively. Hierarchical clustering is shown to the left of each panel. Orange represents 1q gain cells, and gray represents other cells. At diagnosis, 1q gain was observed in 16% of the single plasma cells versus 70% after induction chemotherapy and 92% at relapse. (B) Fish plot of the inferred clonal evolution on the basis of single-cell CNA data (clonal evolution). A fish plot is a schematic of tumor evolution along the horizontal axis, where a clone is represented by a specific colored shape and nested clones indicate a descent relationship. For each clone, one anomaly that differentiates it from its precursor is displayed. For clarity, only a subset of clones is included. The vertical line highlights sampling points at diagnosis, postinduction, and relapse. At diagnosis, the diploid CNA profile was undetectable, and all cells have a del(17p); thus, this anomaly was inferred as an early event. 1q gain was present in subclones representing 9% of the cells, hence not detectable by standard diagnostic methods. After induction, 1q gain subclones represented the majority of cells and, at relapse, most of the cells. Clones were manually curated. The fish plot figure was created using the fishplot package for R. CNA, copy number abnormality.
FIG 2.
FIG 2.
(A) RFS (n = 956) and (B) OS (n = 951) curves for patients according to 1q gains detected in the bulk analysis (chr1q gain). Blue curves show survival probability (y-axis) for patients with no 1q gain detected at diagnosis or at relapse. The red curve represents survival probability for patients with 1q gain detected at diagnosis, and the teal curve shows survival probability for patients with 1q gain detected only at relapse but not at diagnosis. HR, 95% CIs, and P values for group comparisons are given at the top right. The number of patients at risk for a given month since diagnosis (x-axis) is shown at the bottom. HR, hazard ratio; OS, overall survival; RFS, relapse-free survival.
FIG A1.
FIG A1.
A workflow for the IFM patient database investigation. Five thousand fifty-two patients at diagnosis fulfilling the criteria listed in the red box and 1,610 patients fulfilling the criteria listed in the teal box were selected from the IFM database. Nine hundred fifty-six patients who had data at diagnosis and relapse and who fulfilled the criteria listed in the purple box were divided into three groups, given at the bottom, on the basis of the criteria listed in each box. IFM, Intergroupe Francophone du Myélome.
FIG A2.
FIG A2.
Distribution of the number of subclones for the 81 patients (the x axis represents the subclone numbers, and the y axis the number of patients). In blue, patients with no high-risk subclones are given, and in red, patients with at least one high-risk subclone are given.
FIG A3.
FIG A3.
(A) RFS and (B) OS curves for patients according to del(17p) detected in the bulk analysis. Blue curves show survival probability (y-axis) for patients with no del(17p) detected at diagnosis or at relapse. The red curve represents survival probability for patients with del(17p) detected at diagnosis, and the teal curve shows survival probability for patients with del(17p) detected only at relapse but not at diagnosis. HR, 95% CIs, and P values for group comparisons are given at the top right. The number of patients at risk for a given month since diagnosis (x-axis) is shown at the bottom. HR, hazard ratio; OS, overall survival; RFS, relapse-free survival.
FIG A4.
FIG A4.
(A) RFS and (B) OS curves for patients according to del(1p) detected in the bulk analysis. Blue curves show survival probability (y-axis) for patients with no del(1p) detected at diagnosis or at relapse. The red curve represents survival probability for patients with del(1p) detected at diagnosis, and the teal curve shows survival probability for patients with del(1p) detected only at relapse but not at diagnosis. HR, 95% CIs, and P values for group comparisons are given at the top right. The number of patients at risk for a given month since diagnosis (x-axis) is shown at the bottom. HR, hazard ratio; OS, overall survival; RFS, relapse-free survival.

References

    1. Palumbo A, Anderson K: Multiple myeloma. N Engl J Med 364:1046-1060, 2011 - PubMed
    1. Perrot A, Lauwers-Cances V, Tournay E, et al. : Development and validation of a cytogenetic prognostic index predicting survival in multiple myeloma. J Clin Oncol 37:1657-1665, 2019 - PMC - PubMed
    1. Samur MK, Aktas Samur A, Fulciniti M, et al. : Genome-wide somatic alterations in multiple myeloma reveal a superior outcome group. J Clin Oncol 38:3107-3118, 2020 - PMC - PubMed
    1. Thakurta A, Ortiz M, Blecua P, et al. : High subclonal fraction of 17p deletion is associated with poor prognosis in multiple myeloma. Blood 133:1217-1221, 2019 - PMC - PubMed
    1. Hebraud B, Leleu X, Lauwers-Cances V, et al. : Deletion of the 1p32 region is a major independent prognostic factor in young patients with myeloma: The IFM experience on 1195 patients. Leukemia 28:675-679, 2014 - PMC - PubMed

Publication types