. 2023 Jan 3;22(1):52-62.
doi: 10.1158/1535-7163.MCT-22-0101.

Genotype-Tailored ERK/MAPK Pathway and HDAC Inhibition Rewires the Apoptotic Rheostat to Trigger Colorectal Cancer Cell Death

Affiliations

Genotype-Tailored ERK/MAPK Pathway and HDAC Inhibition Rewires the Apoptotic Rheostat to Trigger Colorectal Cancer Cell Death

Laura J Jenkins et al. Mol Cancer Ther. .

Abstract

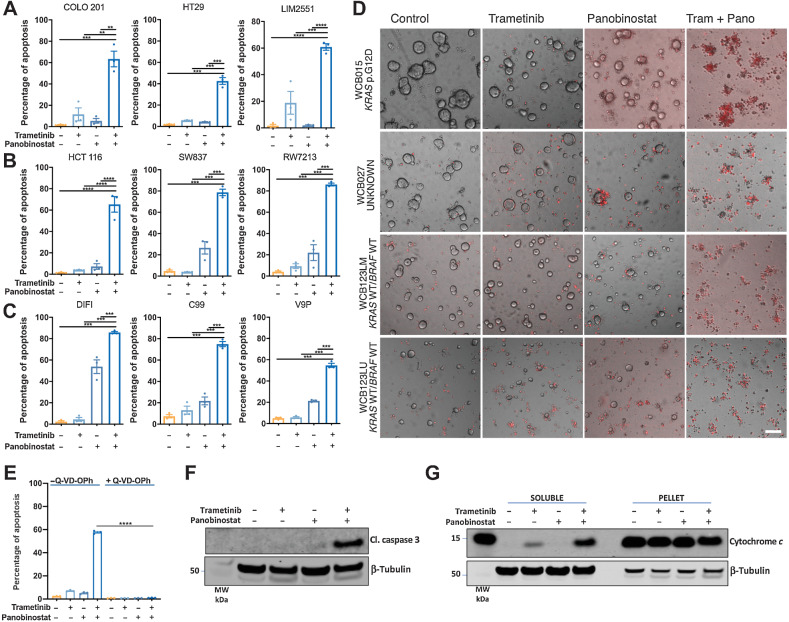
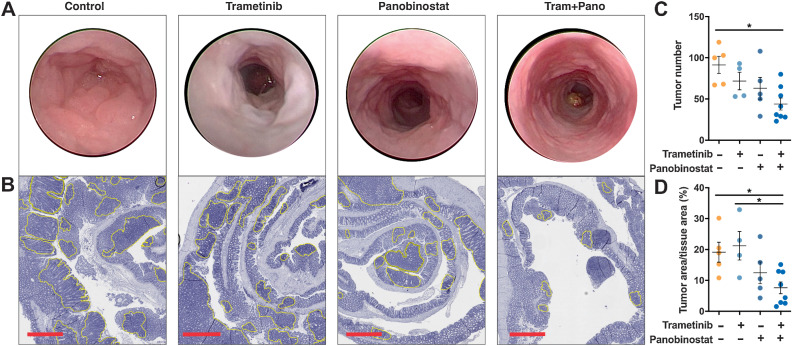
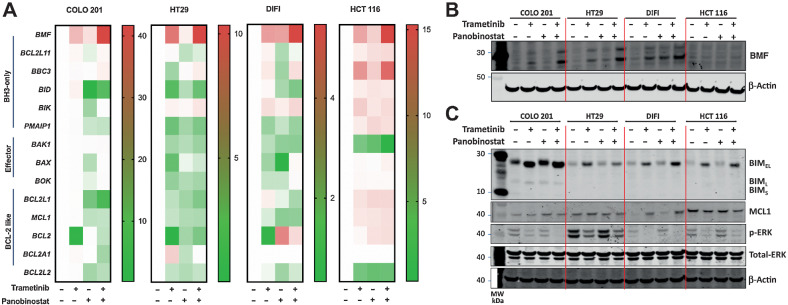
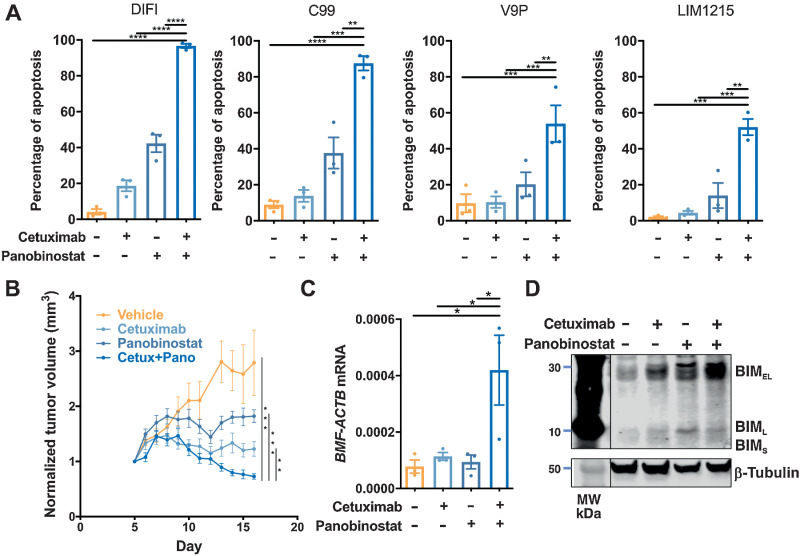
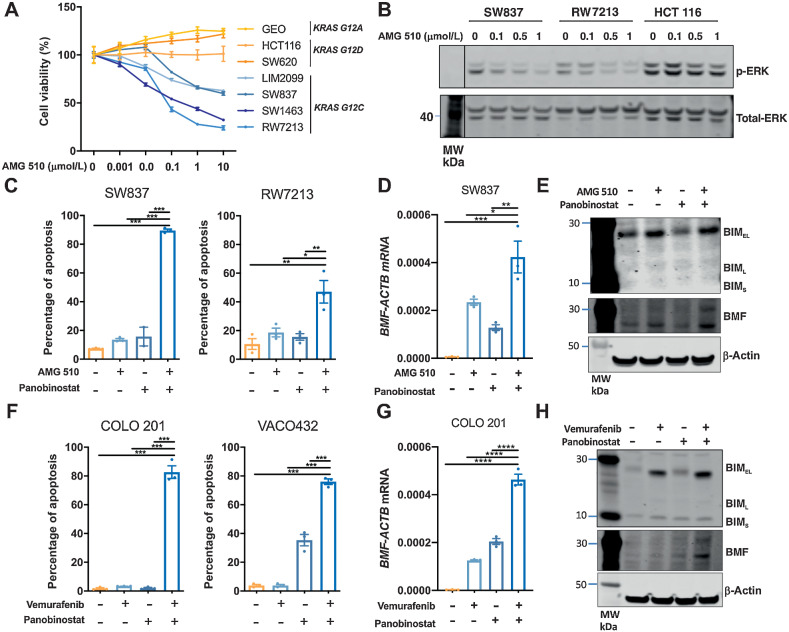
The EGFR/RAS/MEK/ERK signaling pathway (ERK/MAPK) is hyperactivated in most colorectal cancers. A current limitation of inhibitors of this pathway is that they primarily induce cytostatic effects in colorectal cancer cells. Nevertheless, these drugs do induce expression of proapoptotic factors, suggesting they may prime colorectal cancer cells to undergo apoptosis. As histone deacetylase inhibitors (HDACis) induce expression of multiple proapoptotic proteins, we examined whether they could synergize with ERK/MAPK inhibitors to trigger colorectal cancer cell apoptosis. Combined MEK/ERK and HDAC inhibition synergistically induced apoptosis in colorectal cancer cell lines and patient-derived tumor organoids in vitro, and attenuated Apc-initiated adenoma formation in vivo. Mechanistically, combined MAPK/HDAC inhibition enhanced expression of the BH3-only proapoptotic proteins BIM and BMF, and their knockdown significantly attenuated MAPK/HDAC inhibitor-induced apoptosis. Importantly, we demonstrate that the paradigm of combined MAPK/HDAC inhibitor treatment to induce apoptosis can be tailored to specific MAPK genotypes in colorectal cancers, by combining an HDAC inhibitor with either an EGFR, KRASG12C or BRAFV600 inhibitor in KRAS/BRAFWT; KRASG12C, BRAFV600E colorectal cancer cell lines, respectively. These findings identify a series of ERK/MAPK genotype-tailored treatment strategies that can readily undergo clinical testing for the treatment of colorectal cancer.


Figures

Figure 1. Combined MEK/HDAC inhibition induces apoptosis and reduces viability of colorectal cancer cells and patient-derived colorectal tumor organoids. A, BRAFV600E mutant, (B) KRAS mutant, and (C) KRAS/BRAF wild-type colorectal cancer cell lines were treated with trametinib (10 nmol/L) and panobinostat (25 nmol/L) alone or in combination for 72 hours and apoptosis induction determined by propidium iodide staining and FACS analysis. The values shown are mean ± SEM from three independent experiments. Differences were compared using a one-way ANOVA, with Tukey's multiple comparison testing; **, P ≤ 0.01; ***, P ≤ 0.001; and ****, P ≤ 0.0001. D, Effect of trametinib/panobinostat combination treatment on apoptosis in patient-derived colorectal tumor organoids (PDTO). Representative images of propidium iodide–stained PDTO's treated with trametinib (10 nmol/L) and panobinostat (25 nmol/L) alone and in combination for 72 hours. Images were obtained at ×4 magnifications; scale bar, 100 μm. Cells that have incorporated propidium iodide are stained red. E, COLO 201 cells treated with trametinib (10 nmol/L) and panobinostat (25 nmol/L) alone and in combination in the presence or absence of the pan-caspase inhibitor Q-VD-OPh (10 μmol/L) for 24 hours, and apoptosis determined by PI staining and FACS analysis. The values shown are mean ± SEM from a single experiment performed in technical triplicate. Differences were compared using a one-way ANOVA, with Tukey's multiple comparison testing; ****, P ≤ 0.0001. Western blot analysis for (F) cleaved caspase 3 expression and (G) cytochrome c release in COLO 201 cells treated with trametinib (10 nmol/L) and panobinostat (25 nmol/L) for 24 hours. β-Tubulin was used as a loading control.
Figure 1.
Combined MEK/HDAC inhibition induces apoptosis and reduces viability of colorectal cancer cells and patient-derived colorectal tumor organoids. A,BRAFV600E mutant, (B) KRAS mutant, and (C) KRAS/BRAF wild-type colorectal cancer cell lines were treated with trametinib (10 nmol/L) and panobinostat (25 nmol/L) alone or in combination for 72 hours, and apoptosis induction was determined by propidium iodide staining and FACS analysis. The values shown are mean ± SEM from three independent experiments. Differences were compared using a one-way ANOVA, with Tukey's multiple comparison testing; **, P ≤ 0.01; ***, P ≤ 0.001; and ****, P ≤ 0.0001. D, Effect of trametinib/panobinostat combination treatment on apoptosis in patient-derived colorectal tumor organoids (PDTOs). Representative images of propidium iodide–stained PDTOs treated with trametinib (10 nmol/L) and panobinostat (25 nmol/L) alone and in combination for 72 hours. Images were obtained at ×4 magnifications; scale bar, 100 μm. Cells that have incorporated propidium iodide are stained red. E, COLO 201 cells treated with trametinib (10 nmol/L) and panobinostat (25 nmol/L) alone and in combination in the presence or absence of the pan-caspase inhibitor Q-VD-OPh (10 μmol/L) for 24 hours, and apoptosis determined by PI staining and FACS analysis. The values shown are mean ± SEM from a single experiment performed in technical triplicate. Differences were compared using a one-way ANOVA, with Tukey's multiple comparison testing; ****, P ≤ 0.0001. Western blot analysis for (F) cleaved caspase 3 expression and (G) cytochrome c release in COLO 201 cells treated with trametinib (10 nmol/L) and panobinostat (25 nmol/L) for 24 hours. β-Tubulin was used as a loading control.
Figure 2. Combined MEK/HDAC inhibition attenuates colonic adenoma formation. A, Representative endoscopy images of control and drug-treated mice obtained immediately before the experimental endpoint. Mice were treated with trametinib (0.3 mg/kg), panobinostat (5 mg/kg) or the combination for five consecutive days followed by 2 days of rest and received a total of 12 treatments. B, Representative hematoxylin and eosin (H&E) stains of the entire colon from mice treated with vehicle control, trametinib, panobinostat or trametinib plus panobinostat. Yellow outlining indicates tumors; scale bar, 900 μm. C, Tumor number obtained from macroscopic counting of adenomas in resected colons. D, Tumor burden as determined by computing total tumor area relative to total tissue area from H&E-stained sections of the entire colon, from vehicle control (n = 5), trametinib (n = 4), panobinostat (n = 5), and combination (n = 8) treated mice. The values shown are mean ± SEM from the biological replicates. One-way ANOVA, with Tukey's multiple comparison testing; *, P ≤ 0.05; ***, P ≤ 0.001.
Figure 2.
Combined MEK/HDAC inhibition attenuates colonic adenoma formation. A, Representative endoscopy images of control and drug-treated mice obtained immediately before the experimental endpoint. Mice were treated with trametinib (0.3 mg/kg), panobinostat (5 mg/kg) or the combination for five consecutive days followed by 2 days of rest and received a total of 12 treatments. B, Representative hematoxylin and eosin (H&E) stains of the entire colon from mice treated with vehicle control, trametinib, panobinostat or trametinib plus panobinostat. Yellow outlining indicates tumors; scale bar, 900 μm. C, Tumor number obtained from macroscopic counting of adenomas in resected colons. D, Tumor burden as determined by computing total tumor area relative to total tissue area from H&E-stained sections of the entire colon, from vehicle control (n = 5), trametinib (n = 4), panobinostat (n = 5), and combination (n = 8) treated mice. The values shown are mean ± SEM from the biological replicates. One-way ANOVA, with Tukey's multiple comparison testing; *, P ≤ 0.05.
Figure 3. Induction of BMF and BIM by combined MEK/HDAC inhibition in colorectal cancer cells. Effect of trametinib (10 nmol/L) and panobinostat (25 nmol/L) treatment alone and in combination in COLO 201, HT29, DIFI, and HCT 116 cells on (A). Changes in expression of the proapoptotic genes; BMF, BCL2L11, BBC3, BID, BIK, and PMAIP1 the apoptotic effectors; BAK, BAX and BOK and the Bcl-2 only genes; BCL2L1, MCL1, BCL2, BCL2A1, and BCL2L2 as determined by qRT-PCR and presented as fold change over DMSO control. B, BMF protein expression following 24 hours treatment and (C) BIM, MCL1, pERK, and total-ERK following 6 hours of treatment as determined by Western blot. β-Actin was used as a loading control.
Figure 3.
Induction of BMF and BIM by combined MEK/HDAC inhibition in colorectal cancer cells. Effect of trametinib (10 nmol/L) and panobinostat (25 nmol/L) treatment alone and in combination in COLO 201, HT29, DIFI, and HCT 116 cells on (A). Changes in expression of the proapoptotic genes BMF, BCL2L11, BBC3, BID, BIK, and PMAIP1; the apoptotic effectors BAK, BAX, and BOK; and the Bcl-2 only genes BCL2L1, MCL1, BCL2, BCL2A1, and BCL2L2 as determined by qRT-PCR and presented as fold change over DMSO control. B, BMF protein expression following 24 hours of treatment and (C) BIM, MCL1, pERK, and total-ERK following 6 hours of treatment as determined by Western blot. β-Actin was used as a loading control.
Figure 4. Effect of dual inactivation of BIM and BMF on trametinib and panobinostat induced apoptosis. COLO 201 BIM deletion CRISPR cells [minus doxycycline (−DOX) and plus doxycycline (+DOX)] were transiently transfected with non-targeting or BMF-targeting siRNAs for 24 hours. Cells were then treated with trametinib (10 nmol/L) and panobinostat (25 nmol/L) alone and in combination for 24 hours. A, Knockdown efficiency of BMF as determined by qRT-PCR. B, Validation of CRISPR-Cas9–mediated BIM deletion by Western blot. β-Tubulin was used as a loading control. C, Apoptosis determined by propidium iodide staining and FACS analysis. The values shown are mean ± SEM from a single experiment performed in technical triplicate. Similar results were obtained in a second independent experiment. One-way ANOVA, with Tukey's multiple comparison testing; ****, P ≤ 0.0001)
Figure 4.
Effect of dual inactivation of BIM and BMF on trametinib and panobinostat-induced apoptosis. COLO 201 BIM deletion CRISPR cells [minus doxycycline (−DOX) and plus doxycycline (+DOX)] were transiently transfected with nontargeting or BMF-targeting siRNAs for 24 hours. Cells were then treated with trametinib (10 nmol/L) and panobinostat (25 nmol/L) alone and in combination for 24 hours. A, Knockdown efficiency of BMF as determined by qRT-PCR. B, Validation of CRISPR-Cas9–mediated BIM deletion by Western blot. β-Tubulin was used as a loading control. C, Apoptosis determined by propidium iodide staining and FACS analysis. The values shown are mean ± SEM from a single experiment performed in technical triplicate. Similar results were obtained in a second independent experiment. One-way ANOVA, with Tukey's multiple comparison testing; ****, P ≤ 0.0001.
Figure 5. Combined EGFR/HDAC inhibition induces apoptosis in colorectal cancer cells. A, KRAS/BRAF wild-type colorectal cancer cell lines treated with cetuximab (10 μg/mL) and panobinostat (25 nmol/L) alone or in combination for 72 hours and apoptosis induction determined by propidium iodide staining and FACS analysis. The values shown are mean ± SEM from three independent experiments. One-way ANOVA, with Tukey's multiple comparison testing; *, P ≤0.05; **, P ≤ 0.01; ***, P ≤ 0.001; and ****, P ≤ 0.0001. B, Effect of cetuximab and panobinostat on growth of LIM1215 tumor xenografts. BALB/c nude mice per group were subcutaneously injected with 2×10⁶ LIM1215 cells into the right and left flanks (n = 8–12). Mice were then randomized to receive either vehicle control, cetuximab (n = 5, 40 mg/kg), panobinostat (n = 5, 5 mg/kg) or the combination for a total of 12 treatments. Tumor volume was normalized to day 1 of treatment. The values shown are mean ± SEM. C, Expression of BMF mRNA expression in excised tumors (n = 3, all groups). The values shown are mean ± SEM. One-way ANOVA, with Tukey's multiple comparison testing; * P ≤ 0.05. D, Expression of BIM in representative excised tumors from each treatment group as determined by Western blot analysis. β-Tubulin was used as a loading control.
Figure 5.
Combined EGFR/HDAC inhibition induces apoptosis in colorectal cancer cells. A,KRAS/BRAF wild-type colorectal cancer cell lines treated with cetuximab (10 μg/mL) and panobinostat (25 nmol/L) alone or in combination for 72 hours and apoptosis induction determined by propidium iodide staining and FACS analysis. The values shown are mean ± SEM from three independent experiments. One-way ANOVA, with Tukey's multiple comparison testing; *, P ≤0.05; **, P ≤ 0.01; ***, P ≤ 0.001; and ****, P ≤ 0.0001. B, Effect of cetuximab and panobinostat on growth of LIM1215 tumor xenografts. BALB/c nude mice per group were subcutaneously injected with 2×10⁶ LIM1215 cells into the right and left flanks (n = 8–12). Mice were then randomized to receive either vehicle control, cetuximab (n = 5, 40 mg/kg), panobinostat (n = 5, 5 mg/kg), or the combination for a total of 12 treatments. Tumor volume was normalized to day 1 of treatment. The values shown are mean ± SEM. C, Expression of BMF mRNA expression in excised tumors (n = 3, all groups). The values shown are mean ± SEM. One-way ANOVA, with Tukey's multiple comparison testing; * P ≤ 0.05. D, Expression of BIM in representative excised tumors from each treatment group as determined by Western blot analysis. β-Tubulin was used as a loading control.
Figure 6. Combined KRAS/HDAC and BRAF/HDAC inhibition induces apoptosis in colorectal cancer cells. A, Effect of AMG 510 on cell viability in colorectal cancer cells. KRASG12C mutant (LIM2099, RW7213, SW837, and SW1463), KRASG12D mutant (HCT116 and SW620), and KRASG12A mutant (GEO) colorectal cancer cells were treated with escalating doses of AMG 510 for 72 hours, and cell viability assessed by MTS assay. The values shown are mean ± SD from a single experiment performed in technical triplicate. Similar results were obtained in a second independent experiment. B, SW837, RW7213, and HCT 116 cells treated with AMG 510 for 1 hour and p-ERK and total ERK levels determined by Western blot analysis. C, Apoptosis analysis as determined by propidium iodide staining and FACS analysis in SW837 and RW7213 cells treated with AMG 510 (0.1 μmol/L) and panobinostat (25 nmol/L) alone and in combination for 72 hours. The values shown are mean ± SEM from a single representative experiment performed in technical triplicate. Similar results were obtained in two additional independent experiments. One-way ANOVA, with Tukey's multiple comparison testing; *, P ≤0.05; **, P ≤0.01; and ***, P ≤0.001. D, BMF mRNA expression as determined by qRT-PCR in SW837 cells treated with AMG 510 (0.1 μmol/L) and panobinostat (25 nmol/L) for 12 hours. The values shown are mean ± SEM from a single representative experiment performed in technical triplicate; *, P ≤ 0.05; **, P ≤ 0.01; ***, P ≤ 0.001). E, Corresponding western blot analysis for BIM and BMF expressions. β-Tubulin was used as a loading control. F, Apoptosis analysis as determined by propidium iodide staining and FACS analysis in COLO 201 and VACO432 cells treated with vemurafenib (2.5 μmol/L) and panobinostat (25 nmol/L) alone and in combination for 72 hours. The values shown are mean ± SEM from a single representative experiment performed in technical triplicate. Similar results were obtained in two additional independent experiments. One-way ANOVA, with Tukey's multiple comparison testing; ***, P ≤ 0.001; ****, P ≤ 0.0001. G, BMF mRNA expression as determined by qRT-PCR in COLO 201 cells treated with vemurafenib (2.5 μmol/L) and panobinostat (25 nmol/L) for 12 hours. The values shown are mean ± SEM from a single representative experiment performed in technical triplicate; ****, P ≤ 0.0001. H, Corresponding western blot analysis for BIM and BMF expressions. β-Tubulin was used as a loading control.
Figure 6.
Combined KRAS/HDAC and BRAF/HDAC inhibition induces apoptosis in colorectal cancer cells. A, Effect of AMG 510 on cell viability in colorectal cancer cells. KRASG12C mutant (LIM2099, RW7213, SW837, and SW1463), KRASG12D mutant (HCT116 and SW620), and KRASG12A mutant (GEO) colorectal cancer cells were treated with escalating doses of AMG 510 for 72 hours, and cell viability assessed by MTS assay. The values shown are mean ± SD from a single experiment performed in technical triplicate. Similar results were obtained in a second independent experiment. B, SW837, RW7213, and HCT 116 cells treated with AMG 510 for 1 hour and p-ERK and total ERK levels determined by Western blot analysis. C, Apoptosis analysis as determined by propidium iodide staining and FACS analysis in SW837 and RW7213 cells treated with AMG 510 (0.1 μmol/L) and panobinostat (25 nmol/L) alone and in combination for 72 hours. The values shown are mean ± SEM from a single representative experiment performed in technical triplicate. Similar results were obtained in two additional independent experiments. One-way ANOVA, with Tukey's multiple comparison testing; *, P ≤0.05; **, P ≤0.01; and ***, P ≤0.001. D,BMF mRNA expression as determined by qRT-PCR in SW837 cells treated with AMG 510 (0.1 μmol/L) and panobinostat (25 nmol/L) for 12 hours. The values shown are mean ± SEM from a single representative experiment performed in technical triplicate; *, P ≤ 0.05; **, P ≤ 0.01; ***, P ≤ 0.001). E, Corresponding Western blot analysis for BIM and BMF expressions. β-Actin was used as a loading control. F, Apoptosis analysis as determined by propidium iodide staining and FACS analysis in COLO 201 and VACO432 cells treated with vemurafenib (2.5 μmol/L) and panobinostat (25 nmol/L) alone and in combination for 72 hours. The values shown are mean ± SEM from a single representative experiment performed in technical triplicate. Similar results were obtained in two additional independent experiments. One-way ANOVA, with Tukey's multiple comparison testing; ***, P ≤ 0.001; ****, P ≤ 0.0001. G,BMF mRNA expression as determined by qRT-PCR in COLO 201 cells treated with vemurafenib (2.5 μmol/L) and panobinostat (25 nmol/L) for 12 hours. The values shown are mean ± SEM from a single representative experiment performed in technical triplicate; ****, P ≤ 0.0001. H, Corresponding Western blot analysis for BIM and BMF expressions. β-Actin was used as a loading control.

References

    1. Muzny DM, Bainbridge MN, Chang K, Dinh HH, Drummond JA, Fowler G, et al. Comprehensive molecular characterization of human colon and rectal cancer. Nature 2012;487:330–7. - PMC - PubMed
    1. McKay JA, Murray LJ, Curran S, Ross VG, Clark C, Murray GI, et al. Evaluation of the epidermal growth factor receptor (EGFR) in colorectal tumours and lymph node metastases. Eur J Cancer 2002;38:2258–64. - PubMed
    1. Lavoie H, Gagnon J, Therrien M. ERK signalling: a master regulator of cell behaviour, life, and fate. Nat Rev Mol Cell Biol 2020;21:607–32. - PubMed
    1. Yang JY, Zong CS, Xia W, Yamaguchi H, Ding Q, Xie X, et al. ERK promotes tumorigenesis by inhibiting FOXO3a via MDM2-mediated degradation. Nat Cell Biol 2008;10:138–48. - PMC - PubMed
    1. Lin L, Ding D, Jiang Y, Li Y, Li S. MEK inhibitors induce apoptosis via FoxO3a-dependent PUMA induction in colorectal cancer cells. Oncogenesis 2018;7:67. - PMC - PubMed

Publication types

Substances