. 2022 Dec:41:100647.
doi: 10.1016/j.epidem.2022.100647. Epub 2022 Oct 22.

Impact of disruptions to routine vaccination programs, quantifying burden of measles, and mapping targeted supplementary immunization activities

Affiliations

Impact of disruptions to routine vaccination programs, quantifying burden of measles, and mapping targeted supplementary immunization activities

Natalya Kostandova et al. Epidemics. 2022 Dec.

Abstract

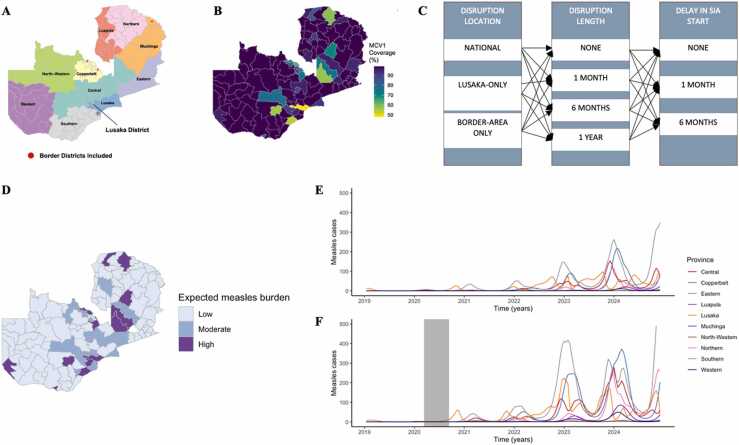
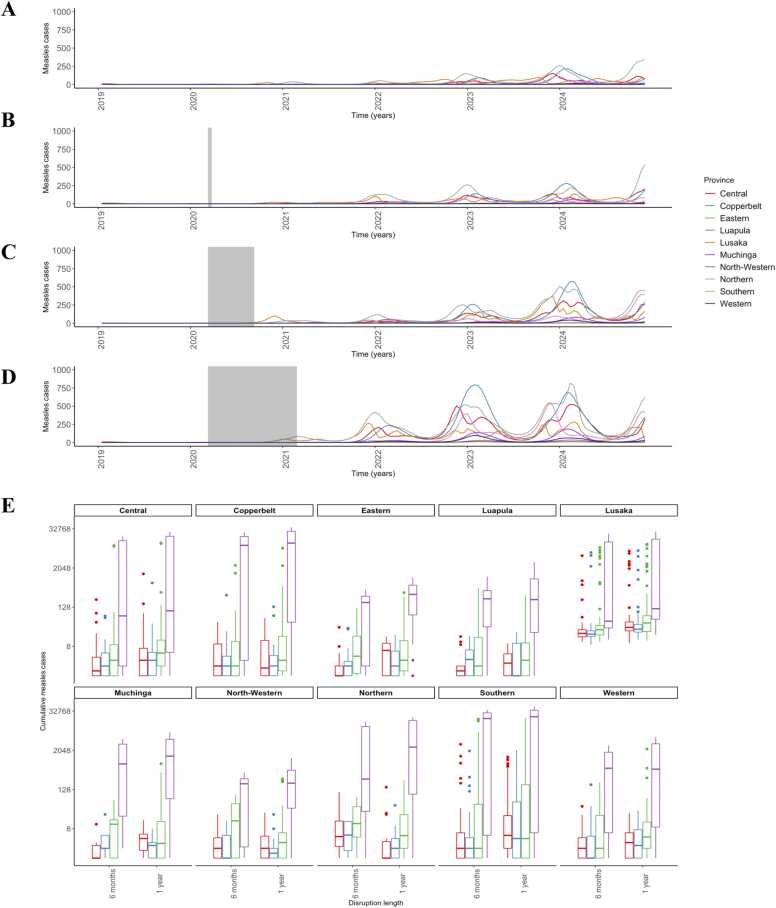
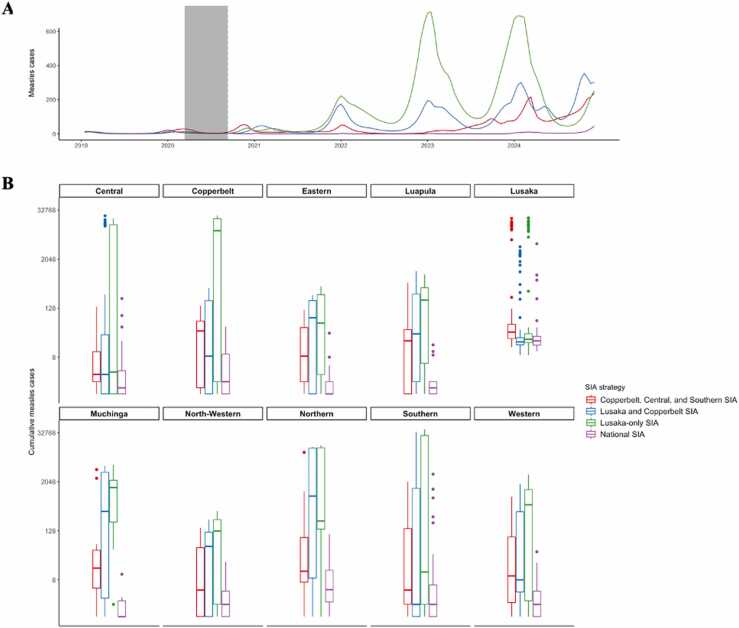
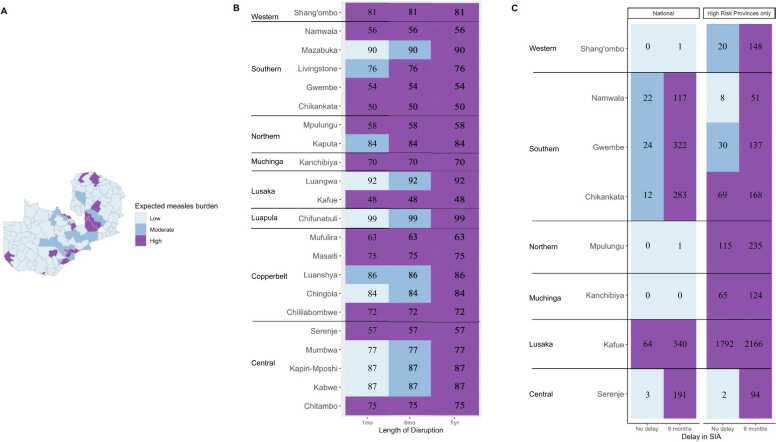
Measles is a highly transmissible disease that requires high levels of vaccination coverage for control and elimination. Areas that are unable to achieve and maintain high coverage levels are at risk for measles outbreaks resulting in increased morbidity and mortality. Public health emergencies, such as the current COVID-19 pandemic, pose a threat to the functioning of health systems by disrupting immunization services which can derail measles vaccination efforts. Efforts to bridge coverage gaps in immunization include the rapid return to fully functioning services as well as deploying supplementary immunization activities (SIAs), which are additional vaccination campaigns intended to catch-up children who have missed routine services. However, SIAs, which to date tend to be national efforts, can be difficult to mobilize quickly, resource-intensive, and even more challenging to deploy during a public health crisis. By mapping expected burden of measles, more effective SIAs that are setting-specific and resource-efficient can be planned and mobilized. Using a spatial transmission model of measles dynamics, we projected and estimated the expected burden of national and local measles outbreaks in Zambia with the current COVID-19 pandemic as a framework to inform disruptions to routine vaccination. We characterize the impact of disruptions to routine immunization services on measles incidence, map expected case burden, and explore SIA strategies to mitigate measles outbreaks. We find that disruptions lasting six months or longer as well as having low MCV1 coverage prior to disruptions resulted in an observable increase of measles cases across provinces. Targeting provinces at higher risk of measles outbreaks for SIAs is an effective strategy to curb measles virus incidence following disruptions to routine immunization services.

Keywords: COVID-19; Disruptions; Immunization campaigns; Measles; Outbreaks.


Conflict of interest statement

Declaration of Competing Interest None. This research did not receive any specific grant from funding agencies in the public, commercial, or not-for-profit sectors.

Figures

Fig. 1
Fig. 1
Overview of scenarios and illustration of the risk of measles burden due to disruptions to routine MCV1 services. (A) Map of Zambia with provinces labeled. (B) Routine MCV1 coverage in Zambia by district using 2018 estimates. (C) Scenarios run in this analysis. Each disruption location was run for varying lengths and addressed with different SIA strategies. (D) District-level distribution of measles burden from January 2020 to December 2022 following disruption to routine MCV1 services lasting six months not followed by an SIA. (E) Time-series of province-level distribution of measles burden in control scenarios with no disruptions and (F) a six month national disruption to routine MCV1 services not followed by an SIA. Shaded area represents the period of disruption.
Fig. 2
Fig. 2
Province-level case distribution in response to disruptions lasting one month, six months, or one year coupled with variable national SIA timing scheme. Time series of measles burden post-disruptions not followed by an SIA with disruption length varying by (A) no disruption (B) one month (C) six months, and (D) one year. The shaded area represents the period of disruptions to routine MCV1 services. (E) Measles burden for all provinces from January 2020 to December 2023, for different durations of routine service disruptions and delays in implementation of 2020 SIA. Y-axis is presented on logarithmic scale for convenience.
Fig. 3
Fig. 3
Exploring national vs targeted SIA strategies in response to disruptions at the province-level. Provinces targeted for SIAs were selected based on population size and outbreak risk. (A) Time series of SIA strategies addressing national measles burden post-disruptions lasting six months. The shaded area represents the period of disruptions to routine immunization services and the dotted line represents the 2020 SIA. (B) Measles burden associated with SIA strategies for all provinces from January 2020 to December 2023. Y-axis is presented on logarithmic scale for convenience.
Fig. 4
Fig. 4
Characterizing district-level expected burden of measles cases given varying disruptions lengths and comparing national versus targeted SIA strategies. (A) Map of Zambia illustrating expected measles burden across districts post-disruptions lasting six months not followed by an SIA. (B) Distribution of district-level expected measles burden following disruptions of varying lengths of one month, six months, or one year. Only districts with “High” expected burden following 1 year of routine disruptions are included. Numbers in cells are the 2018 estimated MCV1 coverage. (C) District-level distribution of expected measles burden following varying SIA strategies and routine MCV1 disruptions lasting six months. Only districts with “High” expected measles burden following 6 months of routine disruptions (either under national or High-Risk Provinces only SIA strategy) are displayed. Numbers in cells indicate cumulative number of cases between January 2020 – December 2023. The following values were used to categorize outbreak risk: Low = cases < 10, Moderate = 10–49 cases, High = >50 in January 2020 – December 2023 period.

Similar articles

Cited by

References

    1. Durrheim D.N., Crowcroft N.S., Blumberg L.H. Is the global measles resurgence a “public health emergency of international concern"? Int. J. Infect. Dis. 2019;83:95–97. - PubMed
    1. The World Bank Population, total - Zambia. World Bank Open Data. 2022 https://data.worldbank.org/indicator/SP.POP.TOTL?locations=ZM
    1. World Health Organization Global measles and rubella strategic plan: 2012 - 2020. World Health Organization. 2012
    1. Poland G.A. Midterm Rev. Glob. Measles Rubella Strateg. Plan. 2018:2012–2020.
    1. Portnoy A., Jit M., Helleringer S., Verguet S. Impact of measles supplementary immunization activities on reaching children missed by routine programs. Vaccine. 2018;36:170–178. - PMC - PubMed

Publication types

Substances