. 2023 Apr;32(4):e133-e144.
doi: 10.1016/j.jse.2022.10.009. Epub 2022 Nov 5.

High and low performers in internal rotation after reverse total shoulder arthroplasty: a biplane fluoroscopic study

Affiliations

High and low performers in internal rotation after reverse total shoulder arthroplasty: a biplane fluoroscopic study

Hema J Sulkar et al. J Shoulder Elbow Surg. 2023 Apr.

Abstract

Background: Internal rotation in adduction is often limited after reverse total shoulder arthroplasty (rTSA), but the origins of this functional deficit are unclear. Few studies have directly compared individuals who can and cannot perform internal rotation in adduction. Little data on underlying 3D humerothoracic, scapulothoracic, and glenohumeral joint relationships in these patients are available.

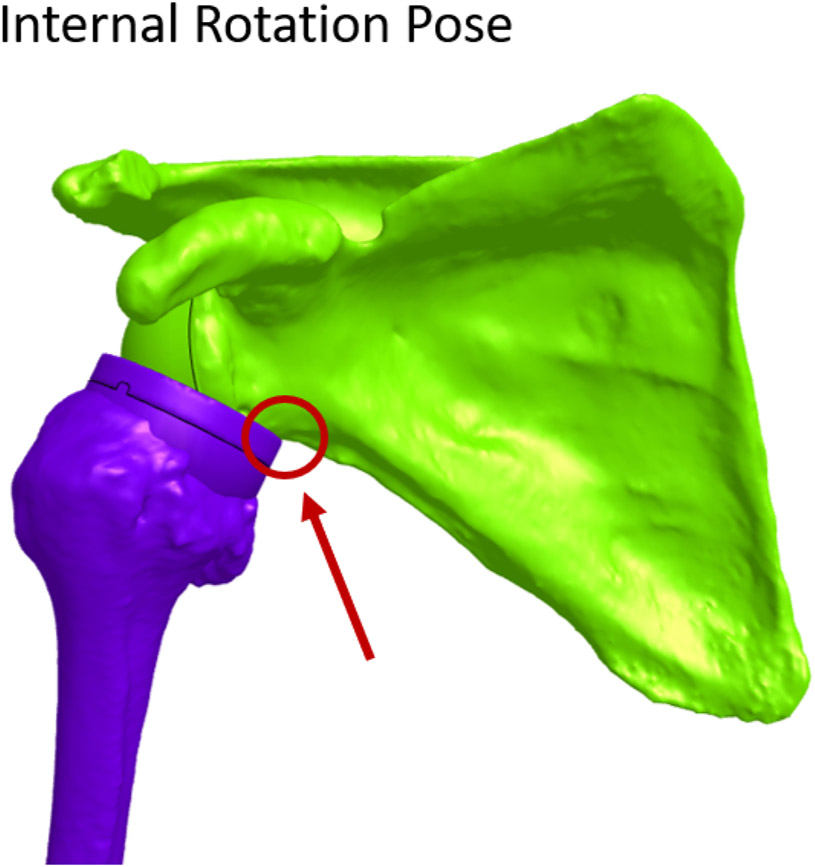
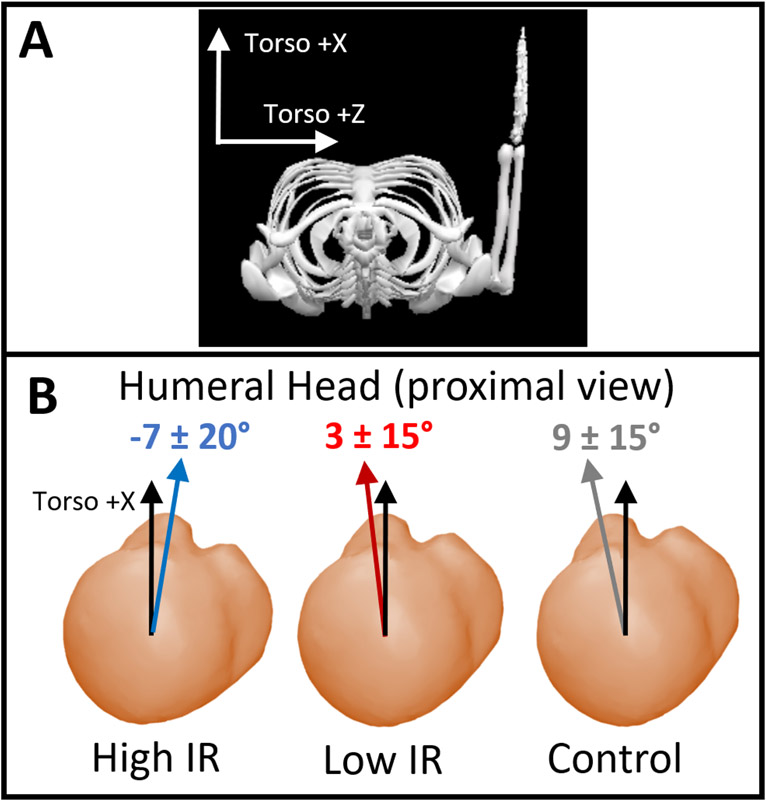
Methods: Individuals >1-year postoperative to rTSA were imaged with biplane fluoroscopy in resting neutral and internal rotation in adduction poses. Subjects could either perform internal rotation in adduction with their hand at T12 or higher (high, N = 7), or below the hip pocket (low, N = 8). Demographics, the American Shoulder and Elbow Surgeons score, Simple Shoulder Test, and scapular notching grade were recorded. Joint orientation angles were derived from model-based markerless tracking of the scapula and humerus relative to the torso. The 3D implant models were aligned to preoperative computed tomography models to evaluate bone-implant impingement.

Results: The Simple Shoulder Test was highest in the high group (11 ± 1 vs. 9 ± 2, P = .019). Two subjects per group had scapular notching (grades 1 and 2), and 3 high group and 4 low group subjects had impingement below the glenoid. In the neutral pose, the scapula had 7° more upward rotation in the high group (P = .100), and the low group demonstrated 9° more posterior tilt (P = .017) and 14° more glenohumeral elevation (P = .047). In the internal rotation pose, axial rotation was >45° higher in the high group (P ≤ .008) and the low group again had 11° more glenohumeral elevation (P = .058). Large rotational differences within subject groups arose from a combination of differences in the resting neutral and maximum internal rotation in adduction poses, not only the terminal arm position.

Conclusions: Individuals who were able to perform high internal rotation in adduction after rTSA demonstrated differences in joint orientation and anatomic biases versus patients with low internal rotation. The high rotation group had 7° more resting scapular upward rotation and used a 15°-30° change in scapular tilt to perform internal rotation in adduction versus patients in the low group. The combination of altered resting scapular posture and restricted scapulothoracic range of motion could prohibit glenohumeral rotation required to reach internal rotation in adduction. In addition, inter-patient variation in humeral torsion may contribute substantially to postoperative internal rotation differences. These data point toward modifiable implant design and placement factors, as well as foci for physical therapy to strengthen and mobilize the scapula and glenohumeral joint in response to rTSA surgery.

Keywords: Anatomic bias; Internal rotation; Joint angles; Reverse total shoulder arthroplasty; Shoulder.


Conflict of interest statement

Conflicts of interest: Peter Chalmers is a paid consultant for Depuy and DJO, receives intellectual property royalties from Depuy and Responsive Arthroscopy, receives research funding from Major League Baseball and LS Peery, and serves on the editorial board for the Journal of Shoulder and Elbow Surgery. Robert Tashjian is a paid consultant for Zimmer/Biomet, Depuy/Mitek, DJO and Stryker; has stock in Conextions, INTRAFUSE, and Genesis; receives intellectual property royalties from Zimmer/Biomet, Stryker, Shoulder Innovations; receives publishing royalties from Springer and the Journal of Bone and Joint Surgery, and serves on the editorial board for the Journal of Bone and Joint Surgery. The other authors, their immediate families, and any research foundation with which they are affiliated have not received any financial payments or other benefits from any commercial entity related to the subject of this article.

Figures

Figure 1.
Figure 1.
Schematic of the resting neutral pose showing the arm at the side with the forearm pointing forward (A), and the internal rotation in adduction pose showing the hand and forearm reaching behind the back (B). Rotations and coordinate systems of the scapula and humerus (C). Scapulothoracic upward rotation, protraction, and posterior tilt shown as positive rotations of the scapula. Humeral elevation, anterior plane of elevation and internal axial rotation shown as positive rotations of the humerus. These definitions apply to both humerothoracic and glenohumeral motion.
Figure 2.
Figure 2.
3D models of a high internal rotation subject (P2) in the internal rotation in adduction pose, using subject-specific implant placement in the preoperative bone. This model shows the potential for impingement of the polyethylene humeral component onto the antero-inferior scapular neck. Interestingly, this subject achieved high IR in adduction but demonstrated impingement and Grade 1 scapular notching. This illustrates that impingement/collision may not be the only indicator of achievable functional IR range of motion if scapulothoracic motion can compensate for the glenohumeral limitations.
Figure 3.
Figure 3.
Humerothoracic (HT) orientation angles in (A) elevation, (B) plane of elevation and (C) axial rotation in the neutral pose (open symbols) and internal rotation in adduction (IR) pose (solid symbols) for each subject. Horizontal lines in the scatter plots denote group means for neutral (dash) and IR (solid) poses. *→ indicates where statistical significance was detected between groups in a specific pose (Table 3). The relative change between neutral and IR poses is shown in the bar graphs below the scatter plots (Difference = IR – neutral). Horizontal lines below bar graphs indicate statistical significance in the difference between the groups. The difference did not reach statistical significance in elevation or plane of elevation, but in axial rotation was considerably smaller in the low IR group (p = 0.001), arising from the lack of IR in the low group. This is unsurprising since axial rotation range of motion was the primary grouping variable in the study design.
Figure 4.
Figure 4.
Scapulothoracic (ST) orientation angles for (A) upward rotation, (B) protraction and (C) posterior tilt in the neutral pose (open symbols) and internal rotation in adduction (IR) pose (solid symbols) for each subject. Horizontal lines in the scatter plots denote group means for neutral (dash) and IR (solid) poses. *→ indicates where statistical significance was detected between groups in a specific pose (Table 3). The relative change between neutral and IR poses is shown in the bar graphs below the scatter plots (Difference = IR – neutral). Horizontal lines below bar graphs indicate statistical significance in the difference between the groups p ≤ 0.01, black p ≤ 0.05). Patients with low IR capabilities had smaller changes in ST upward rotation (p = 0.096) and posterior tilt (p = 0.008).
Figure 5.
Figure 5.
Glenohumeral (GH) orientation angles in (A) elevation, (B) plane of elevation and (C) axial rotation in the neutral pose (open symbols) and internal rotation in adduction (IR) pose (solid symbols) for each subject. Horizontal lines in the scatter plots denote group means for neutral (dash) and IR (solid) poses. *→ indicates where statistical significance was detected between groups in a specific pose (Table 3). The relative change between neutral and IR poses is shown in the bar graphs below the scatter plots (Difference = IR – neutral). Horizontal lines below bar graphs indicate statistical significance in the difference between the groups (dotted green p ≤ 0.01, black p ≤ 0.05). While glenohumeral elevation differed between groups for both poses (Table 3), the difference in poses did not, indicating differences in posture but not changes in required range of motion. The high IR group used more anterior plane of elevation (+) for the IR pose (Table 3), where the low IR group changed more in plane of elevation (p = 0.053). The difference in axial rotation was considerably smaller in the low IR group (p = 0.001), arising from the lack of IR in the low group. This is unsurprising since axial rotation range of motion was the primary grouping variable in the study design.
Figure 6.
Figure 6.
Illustration of the corrected neutral pose orientation of the proximal humerus illustrating the mean orientation of the lesser tuberosity relative to the torso +x axis. All neutral poses were corrected to align forearm Vicon markers with the torso +x axis such that the hands pointed directly forward (A). The high internal rotation (IR) group had an externally rotated lesser tuberosity (−7°), the low IR group was slightly internally rotated (+3°), and the control group was the most internally rotated (+9°) (B). A healthy bone is shown for consistency in interpretation of the resting orientation. While only marginal statistical significance was detected between the high IR and control groups (p = 0.081), this trend is in need of further study. Depending on the implant system and its proximal humerus cutting guides, clocking humeral component retroversion relative to the humeral anatomic neck versus the forearm could affect the IR range of motion of the humerus relative to the torso.
Figure 7.
Figure 7.
Illustration of the relative degree of scapular tilt in the high (blue) and low (red) internal rotation groups, where the high group utilized 15-30° of scapular tilt to achieve internal rotation in adduction but the low group was limited to <5°. Here the opaque model represents the resting orientation and the semi-transparent model is the relative change when in the internal rotation in adduction pose. The black lines represent the scapular axis about which the yellow arrow represents the relative magnitude of change in tilt. The same scapula and glenosphere is shown for both groups to provide consistency in interpretation.
Figure 8.
Figure 8.
Illustration of the relative degree of scapulothoracic protraction for the high (blue) and low (red) internal rotation groups as compared the healthy controls (grey). In this cohort the high internal rotation group was 11° more retracted than controls, while the low internal rotation group was similar to controls. The same scapula is shown for all groups to provide consistency in interpretation. Scapulae are also enlarged for clarity.

References

    1. Aliaj K, Lawrence RL, Bo Foreman K, Chalmers PN, Henninger HB. Kinematic coupling of the glenohumeral and scapulothoracic joints generates humeral axial rotation. J Biomech 2022;136:111059. 10.1016/j.jbiomech.2022.111059 - DOI - PMC - PubMed
    1. Baek CH, Kim JG, Baek GR. Restoration of active internal rotation following reverse shoulder arthroplasty: anterior latissimus dorsi and teres major combined transfer. J Shoulder Elbow Surg 2021. 10.1016/j.jse.2021.11.008 - DOI - PubMed
    1. Barnes CJ, Van Steyn SJ, Fischer RA. The effects of age, sex, and shoulder dominance on range of motion of the shoulder. J Shoulder Elbow Surg 2001;10:242–6. - PubMed
    1. Berhouet J, Garaud P, Favard L. Evaluation of the role of glenosphere design and humeral component retroversion in avoiding scapular notching during reverse shoulder arthroplasty. J Shoulder Elbow Surg 2014;23:151–8. 10.1016/j.jse.2013.05.009 - DOI - PubMed
    1. Bey MJ, Zauel R, Brock SK, Tashman S. Validation of a new model-based tracking technique for measuring three-dimensional, in vivo glenohumeral joint kinematics. J Biomech Eng 2006;128:604–9. 10.1115/1.2206199 - DOI - PMC - PubMed

LinkOut - more resources