. 2022 Dec 14;42(50):9450-9472.
doi: 10.1523/JNEUROSCI.0562-22.2022. Epub 2022 Nov 7.

Loss of NF1 in Drosophila Larvae Causes Tactile Hypersensitivity and Impaired Synaptic Transmission at the Neuromuscular Junction

Affiliations

Loss of NF1 in Drosophila Larvae Causes Tactile Hypersensitivity and Impaired Synaptic Transmission at the Neuromuscular Junction

Alex Dyson et al. J Neurosci. .

Abstract

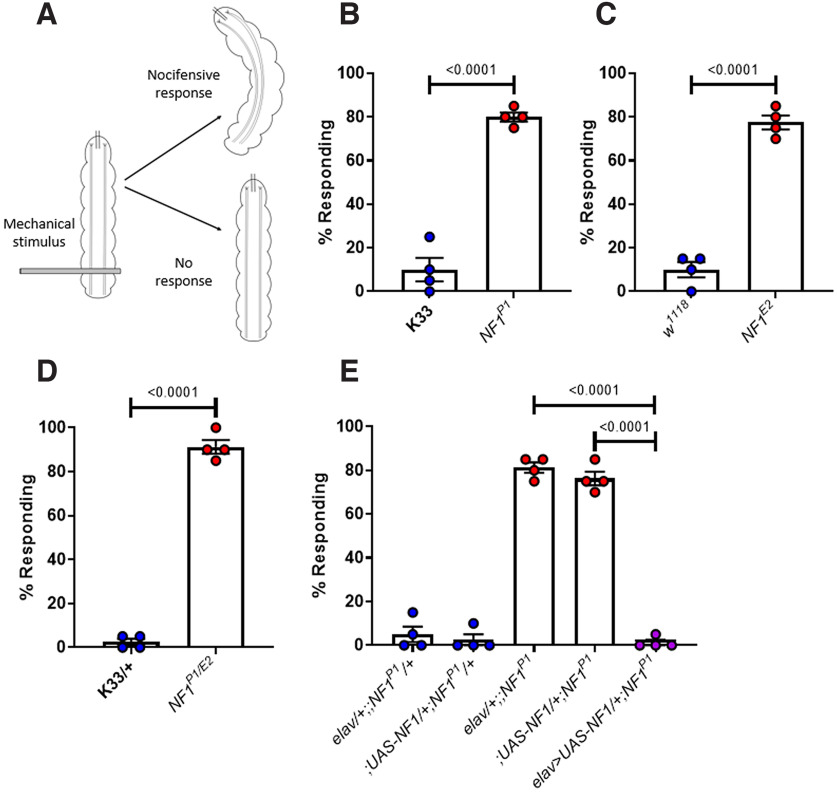
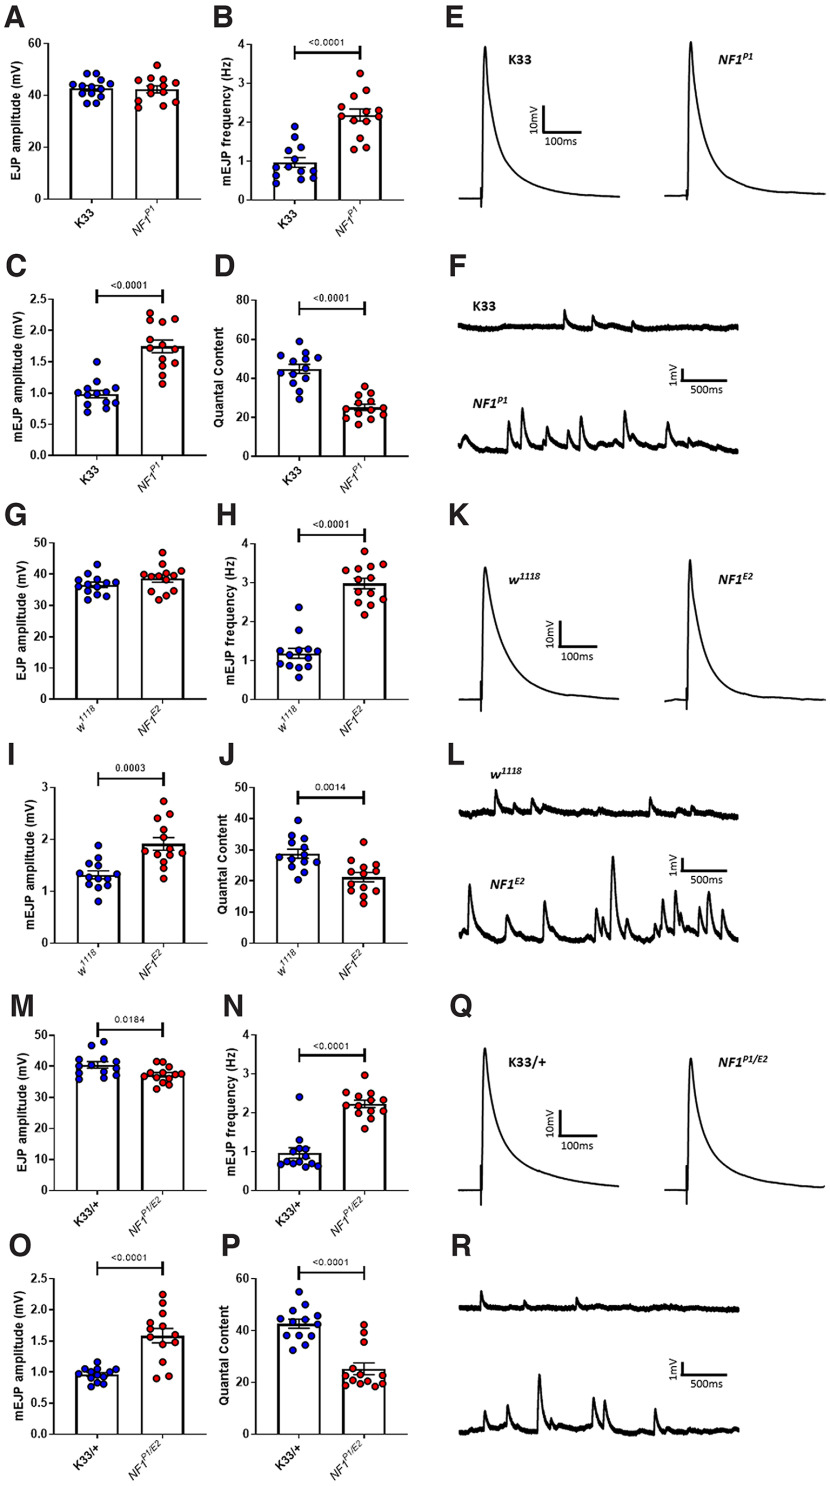
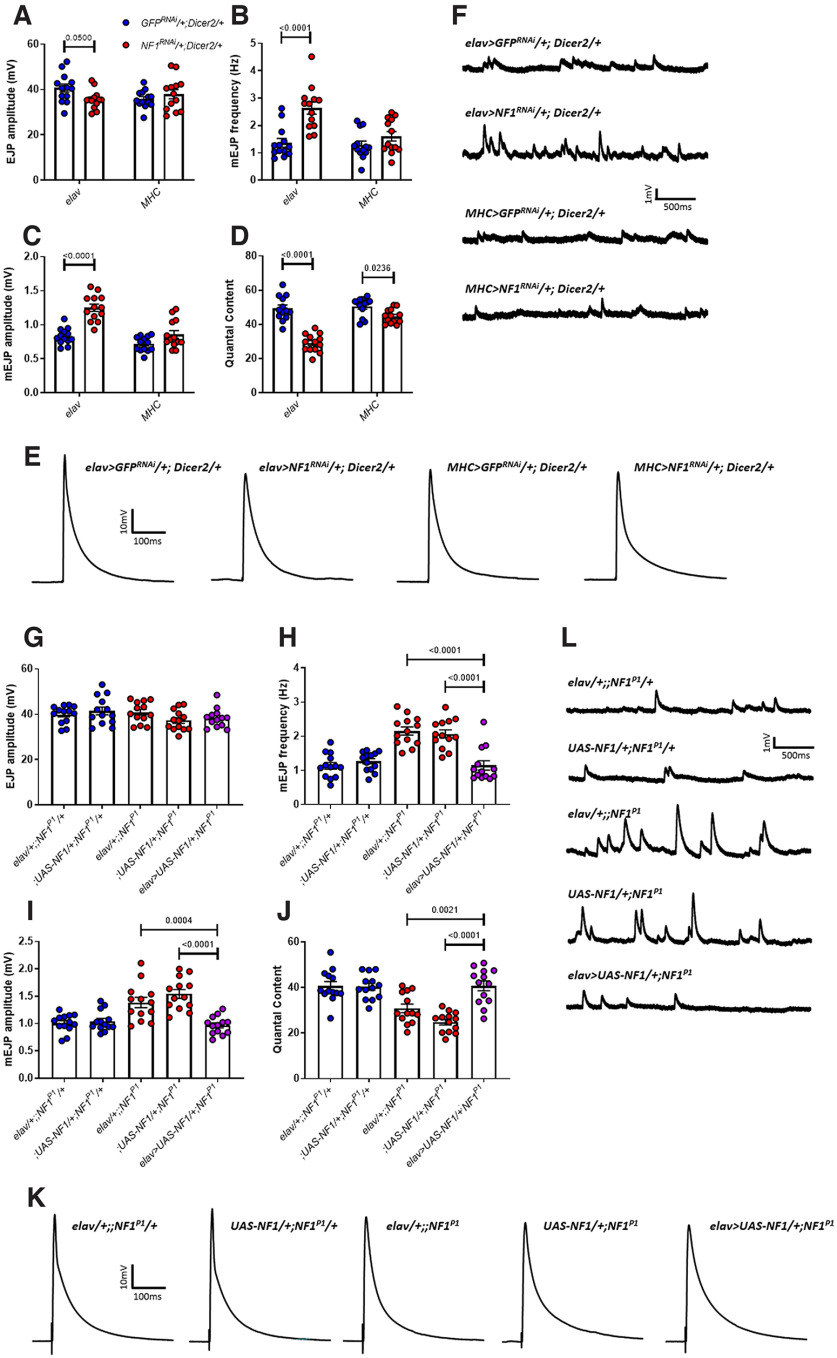
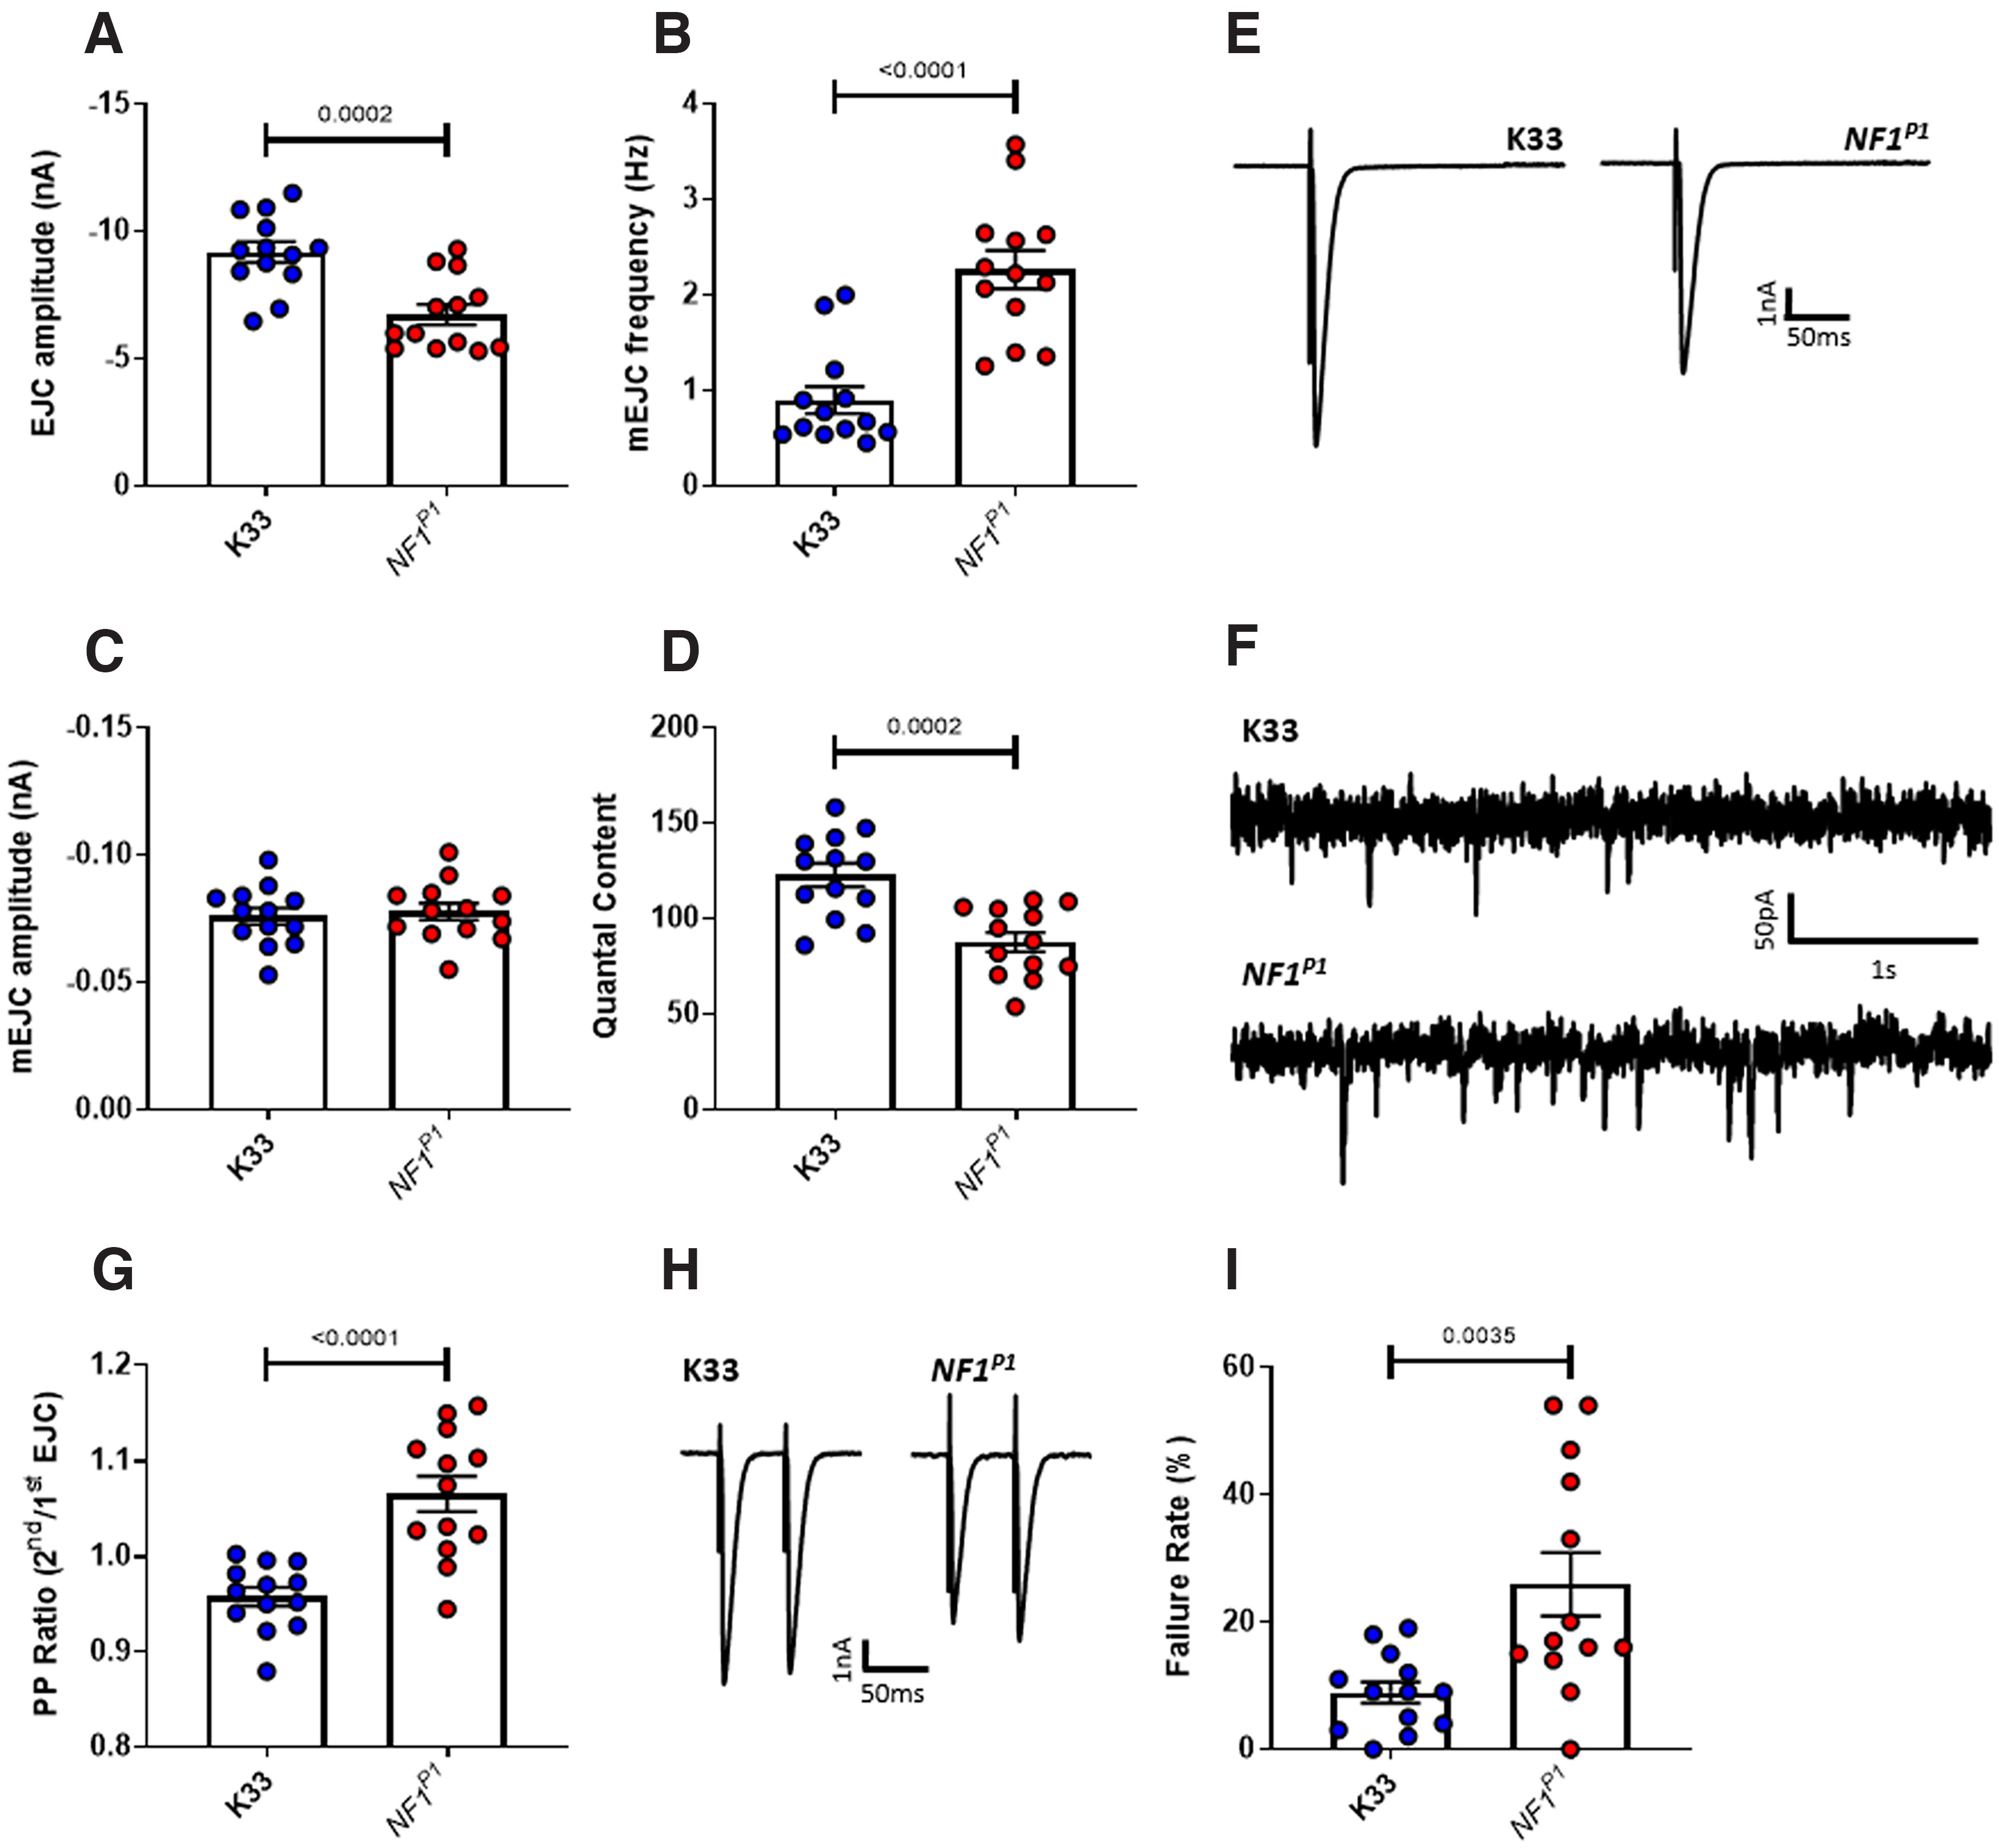
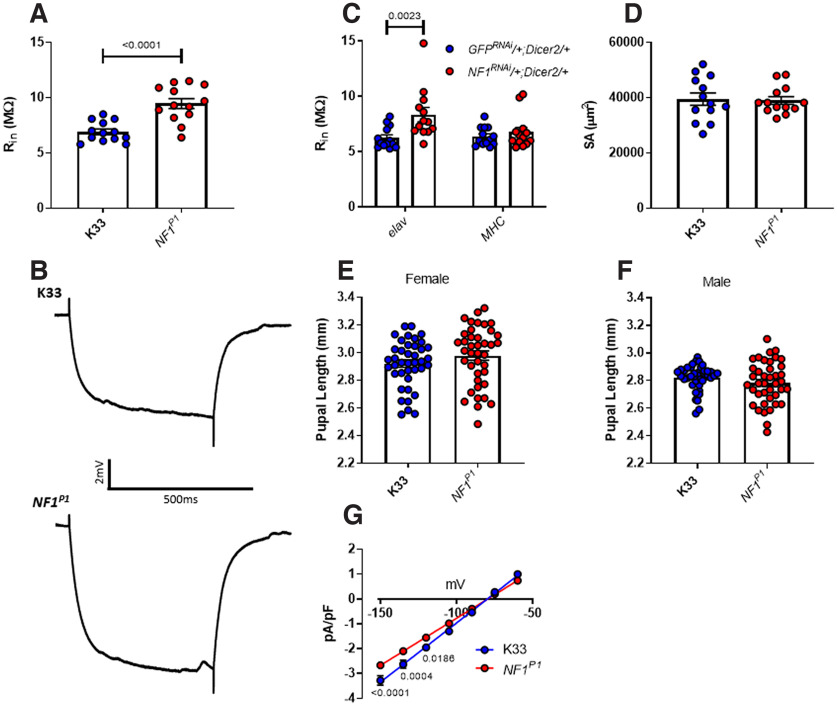
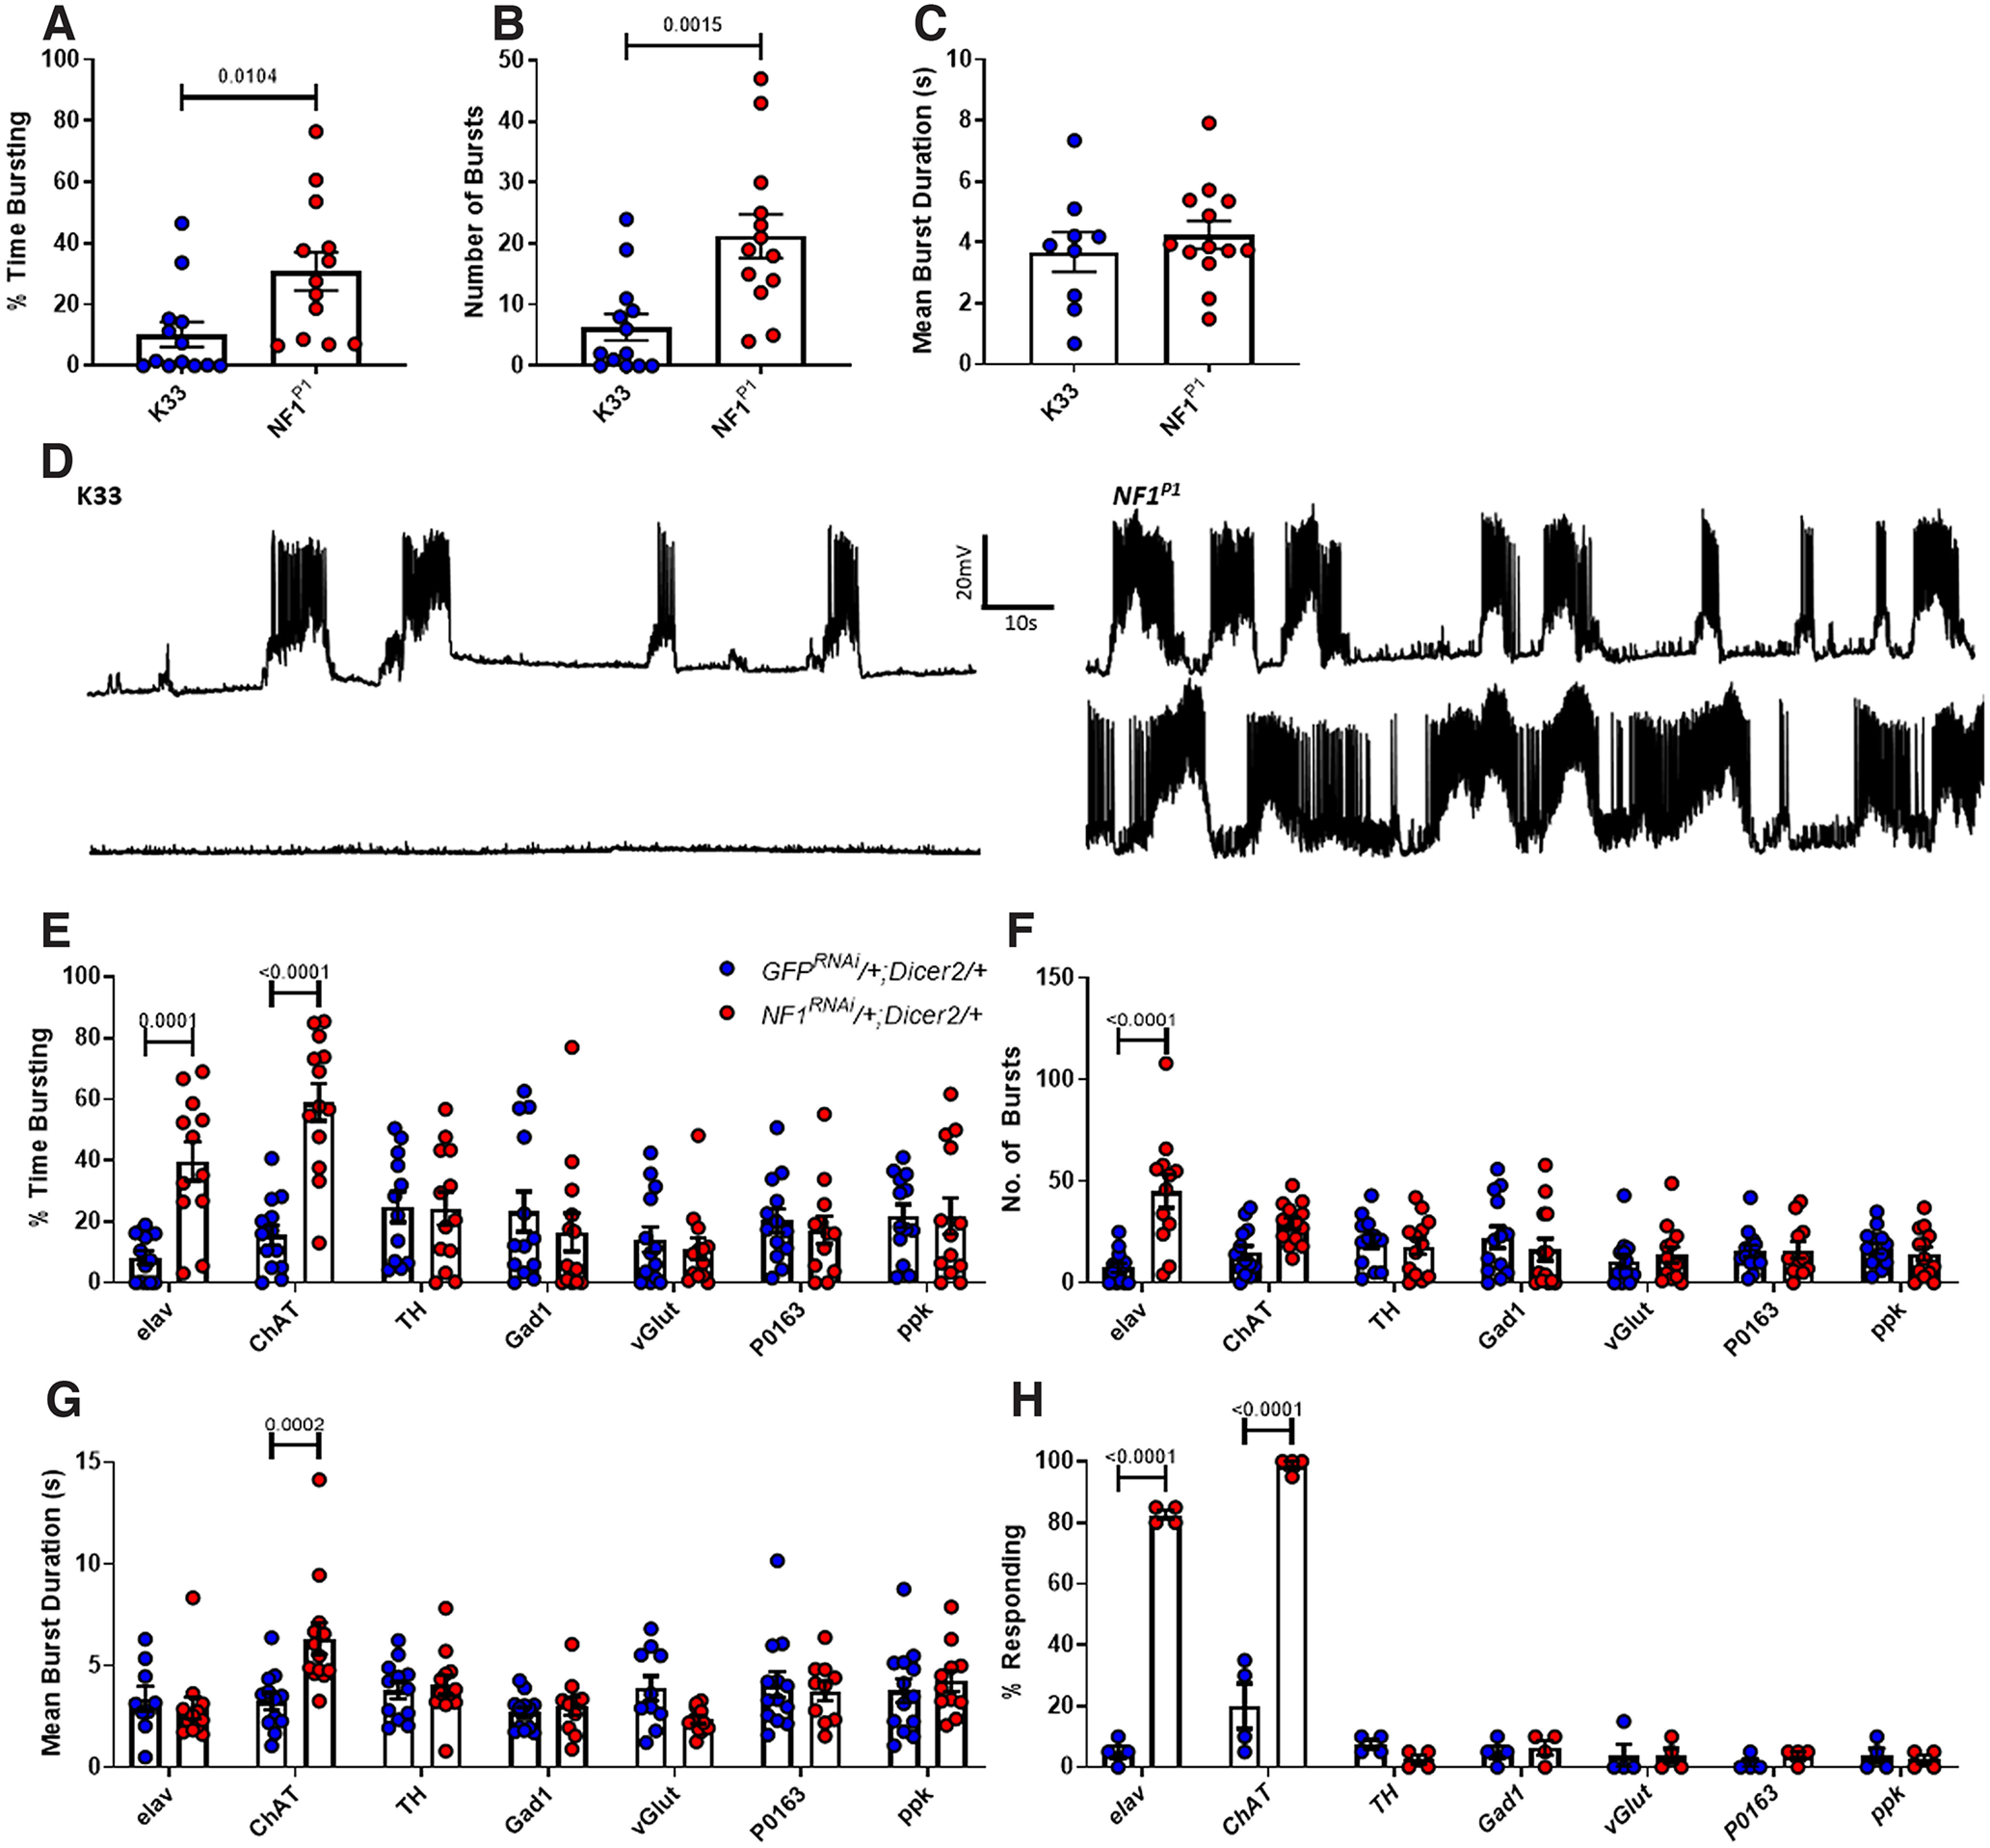
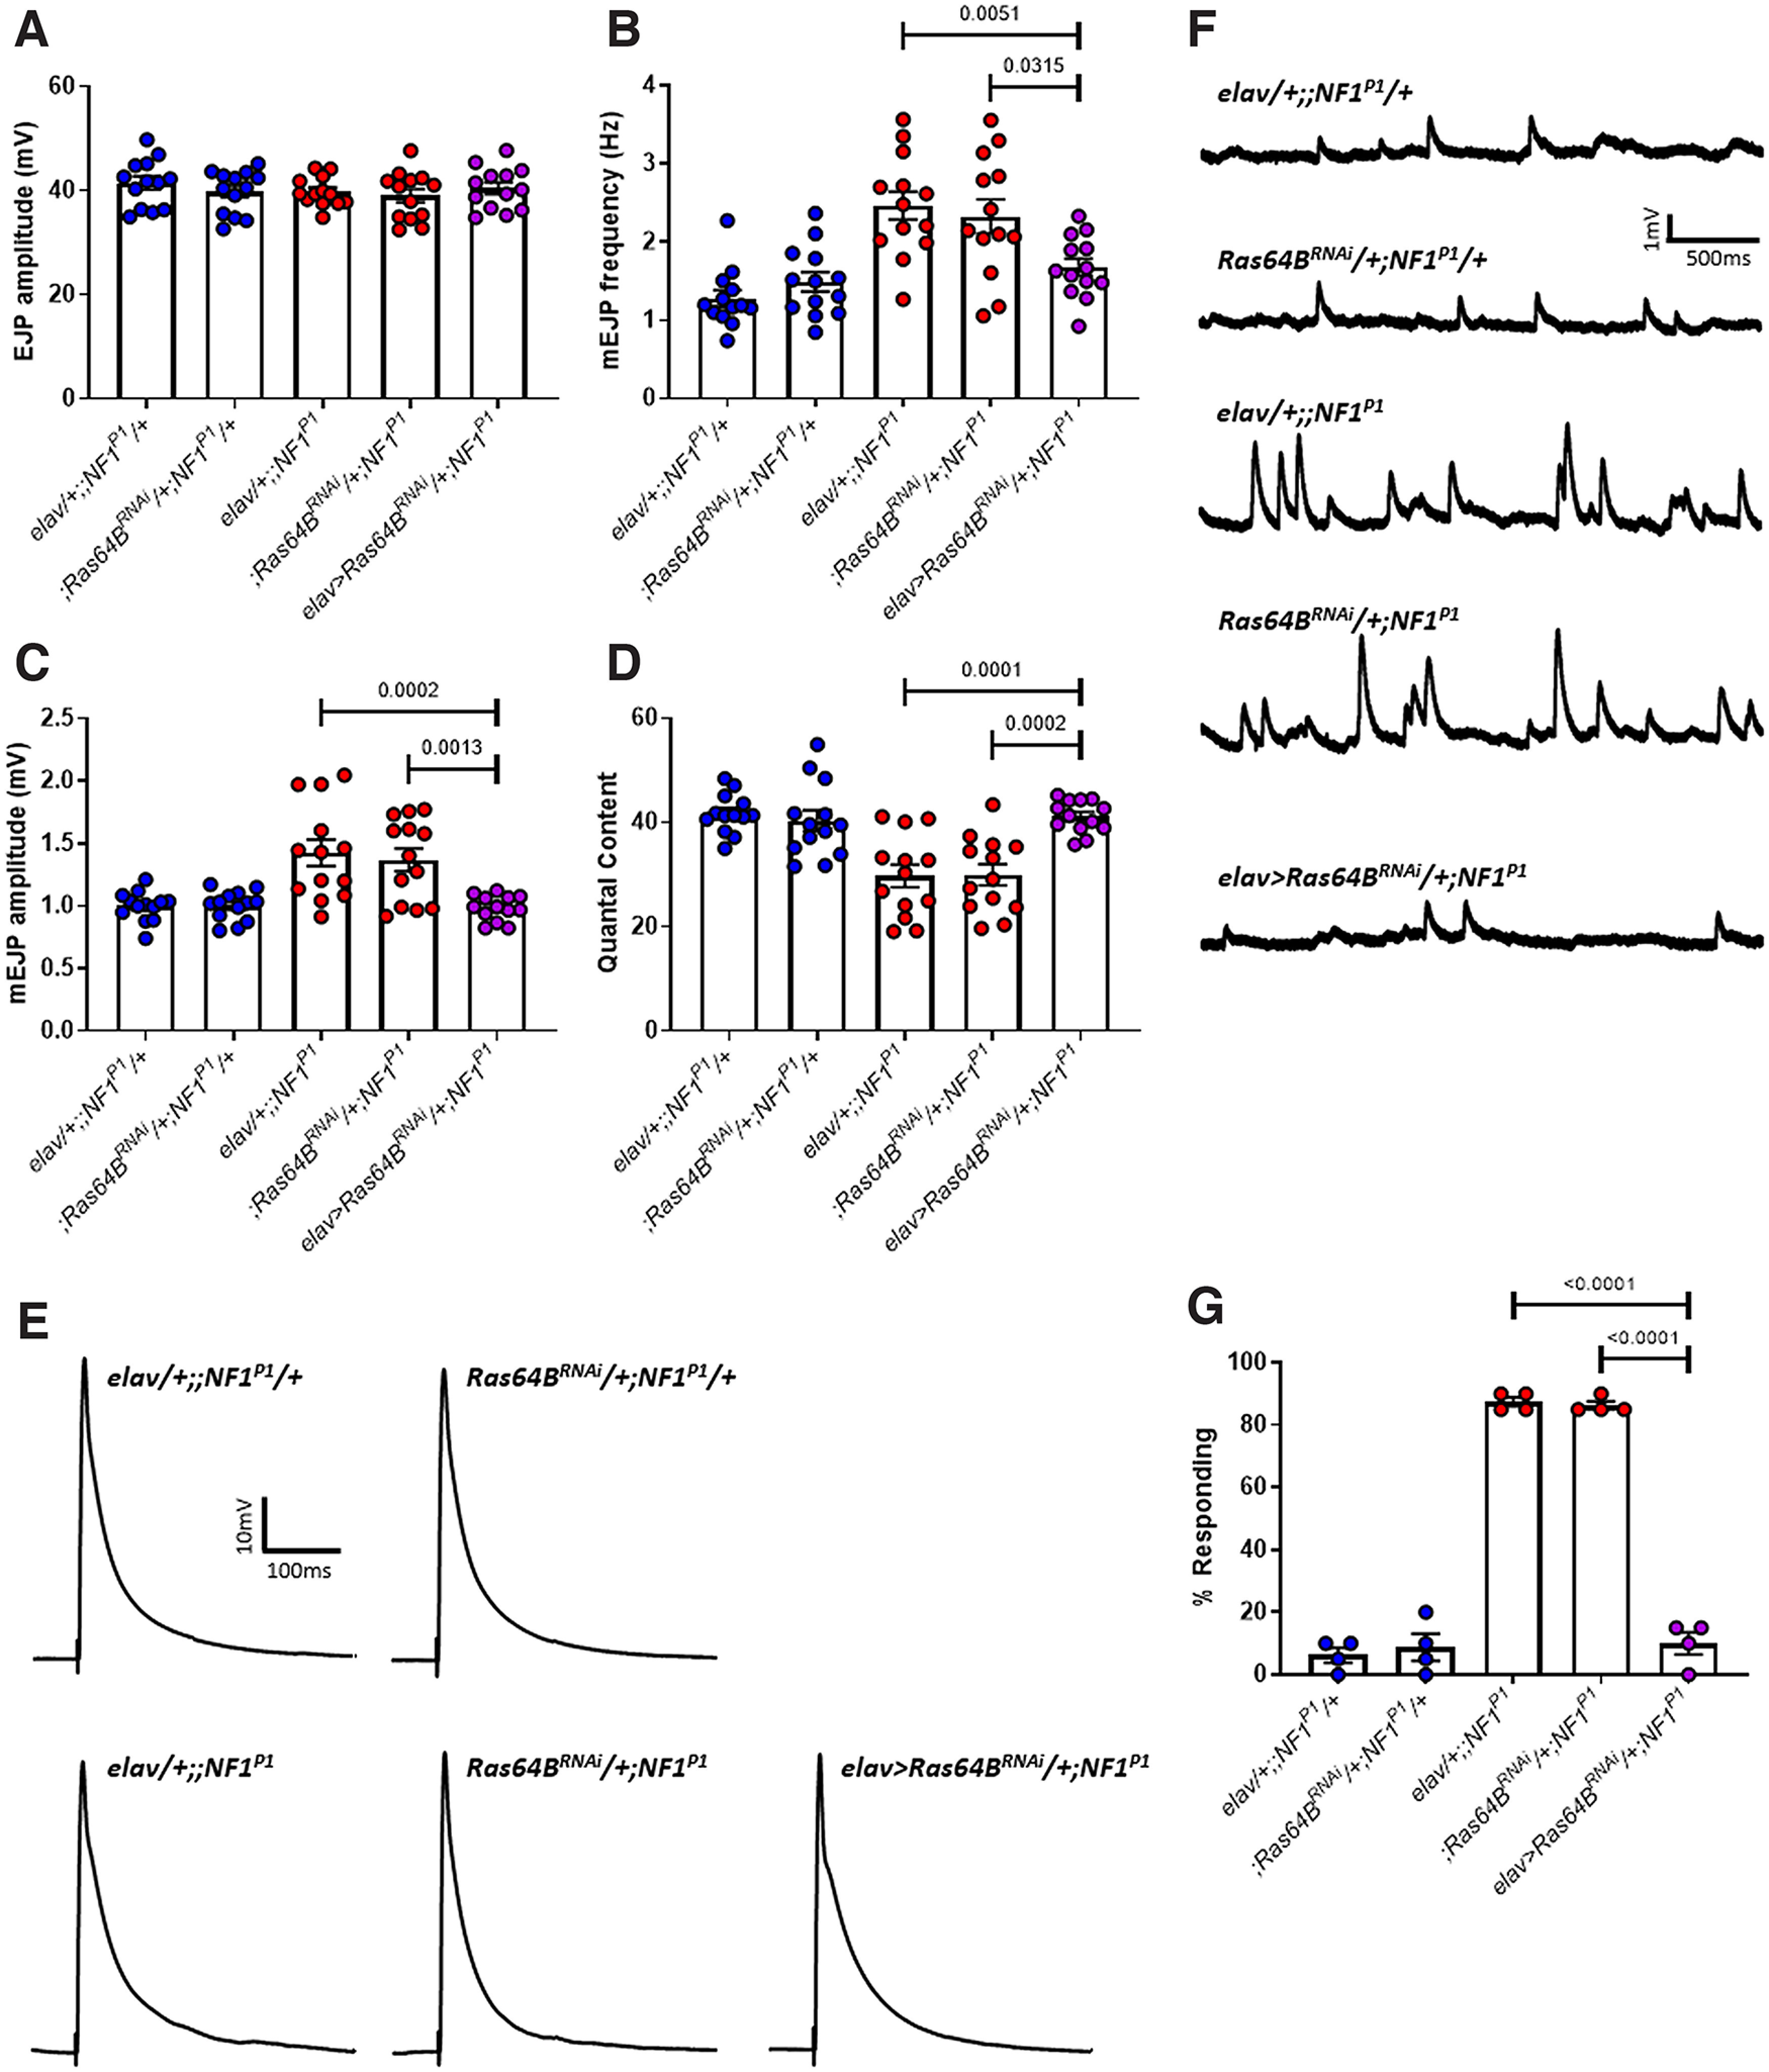
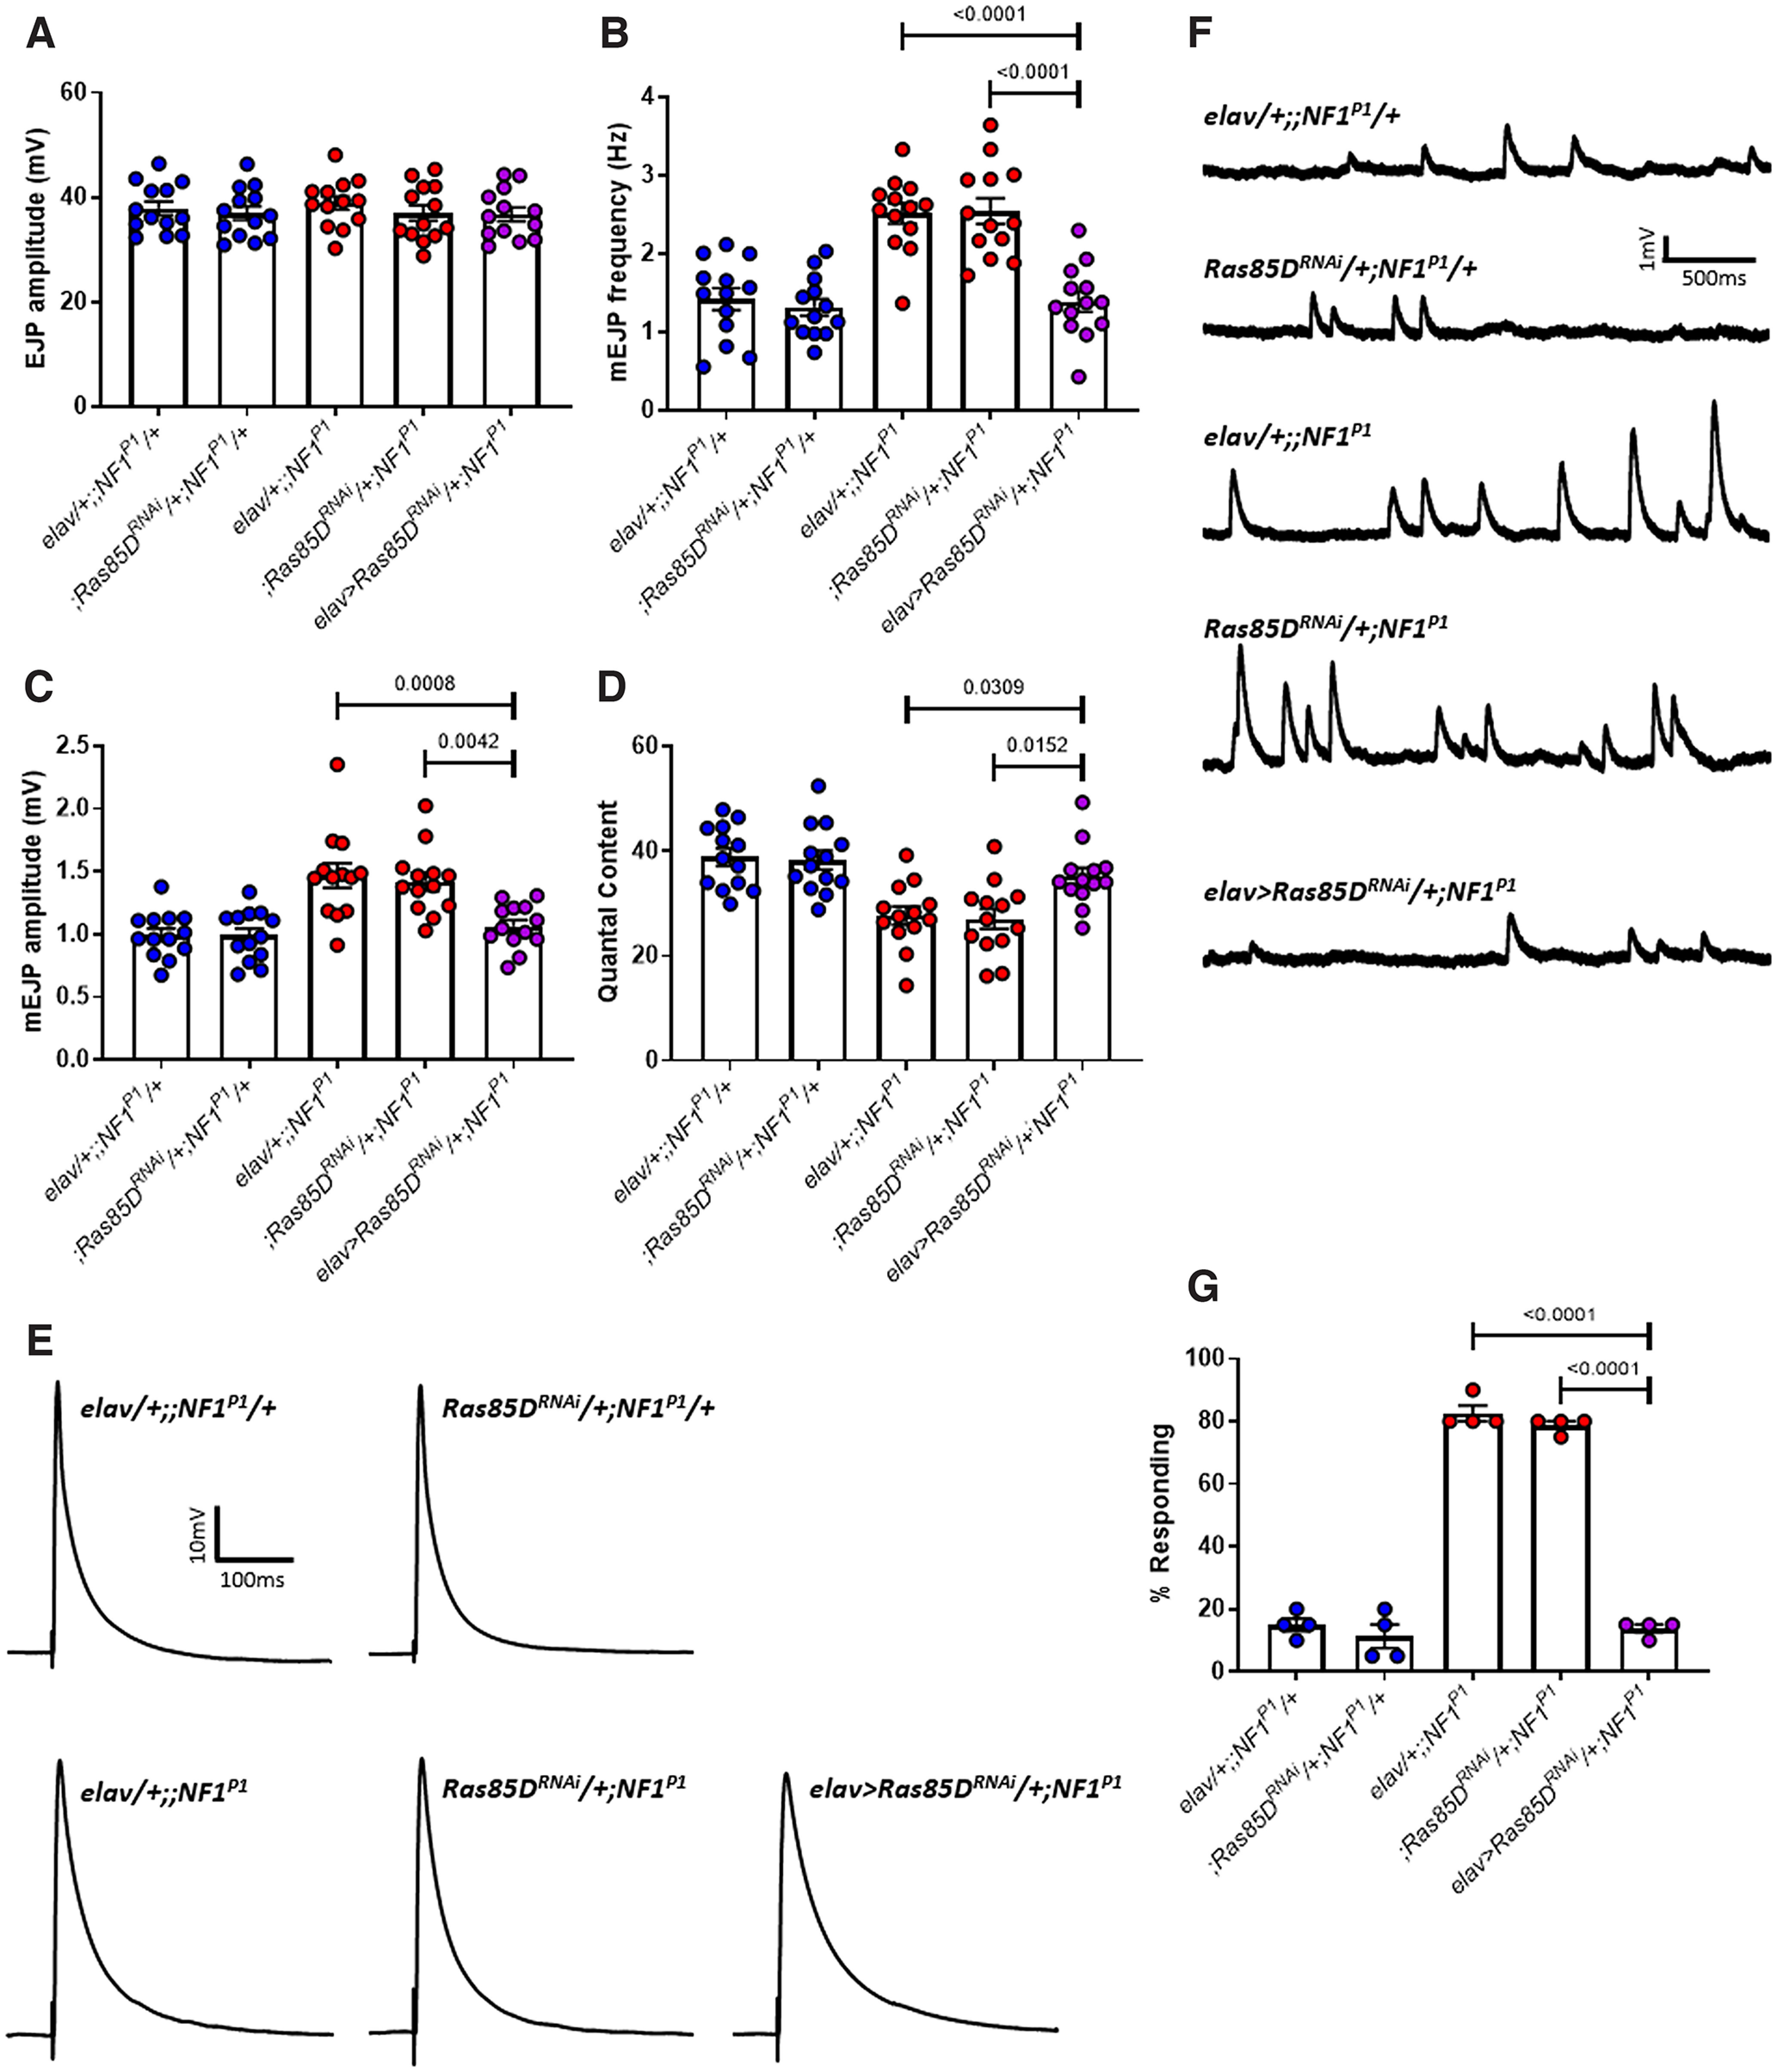
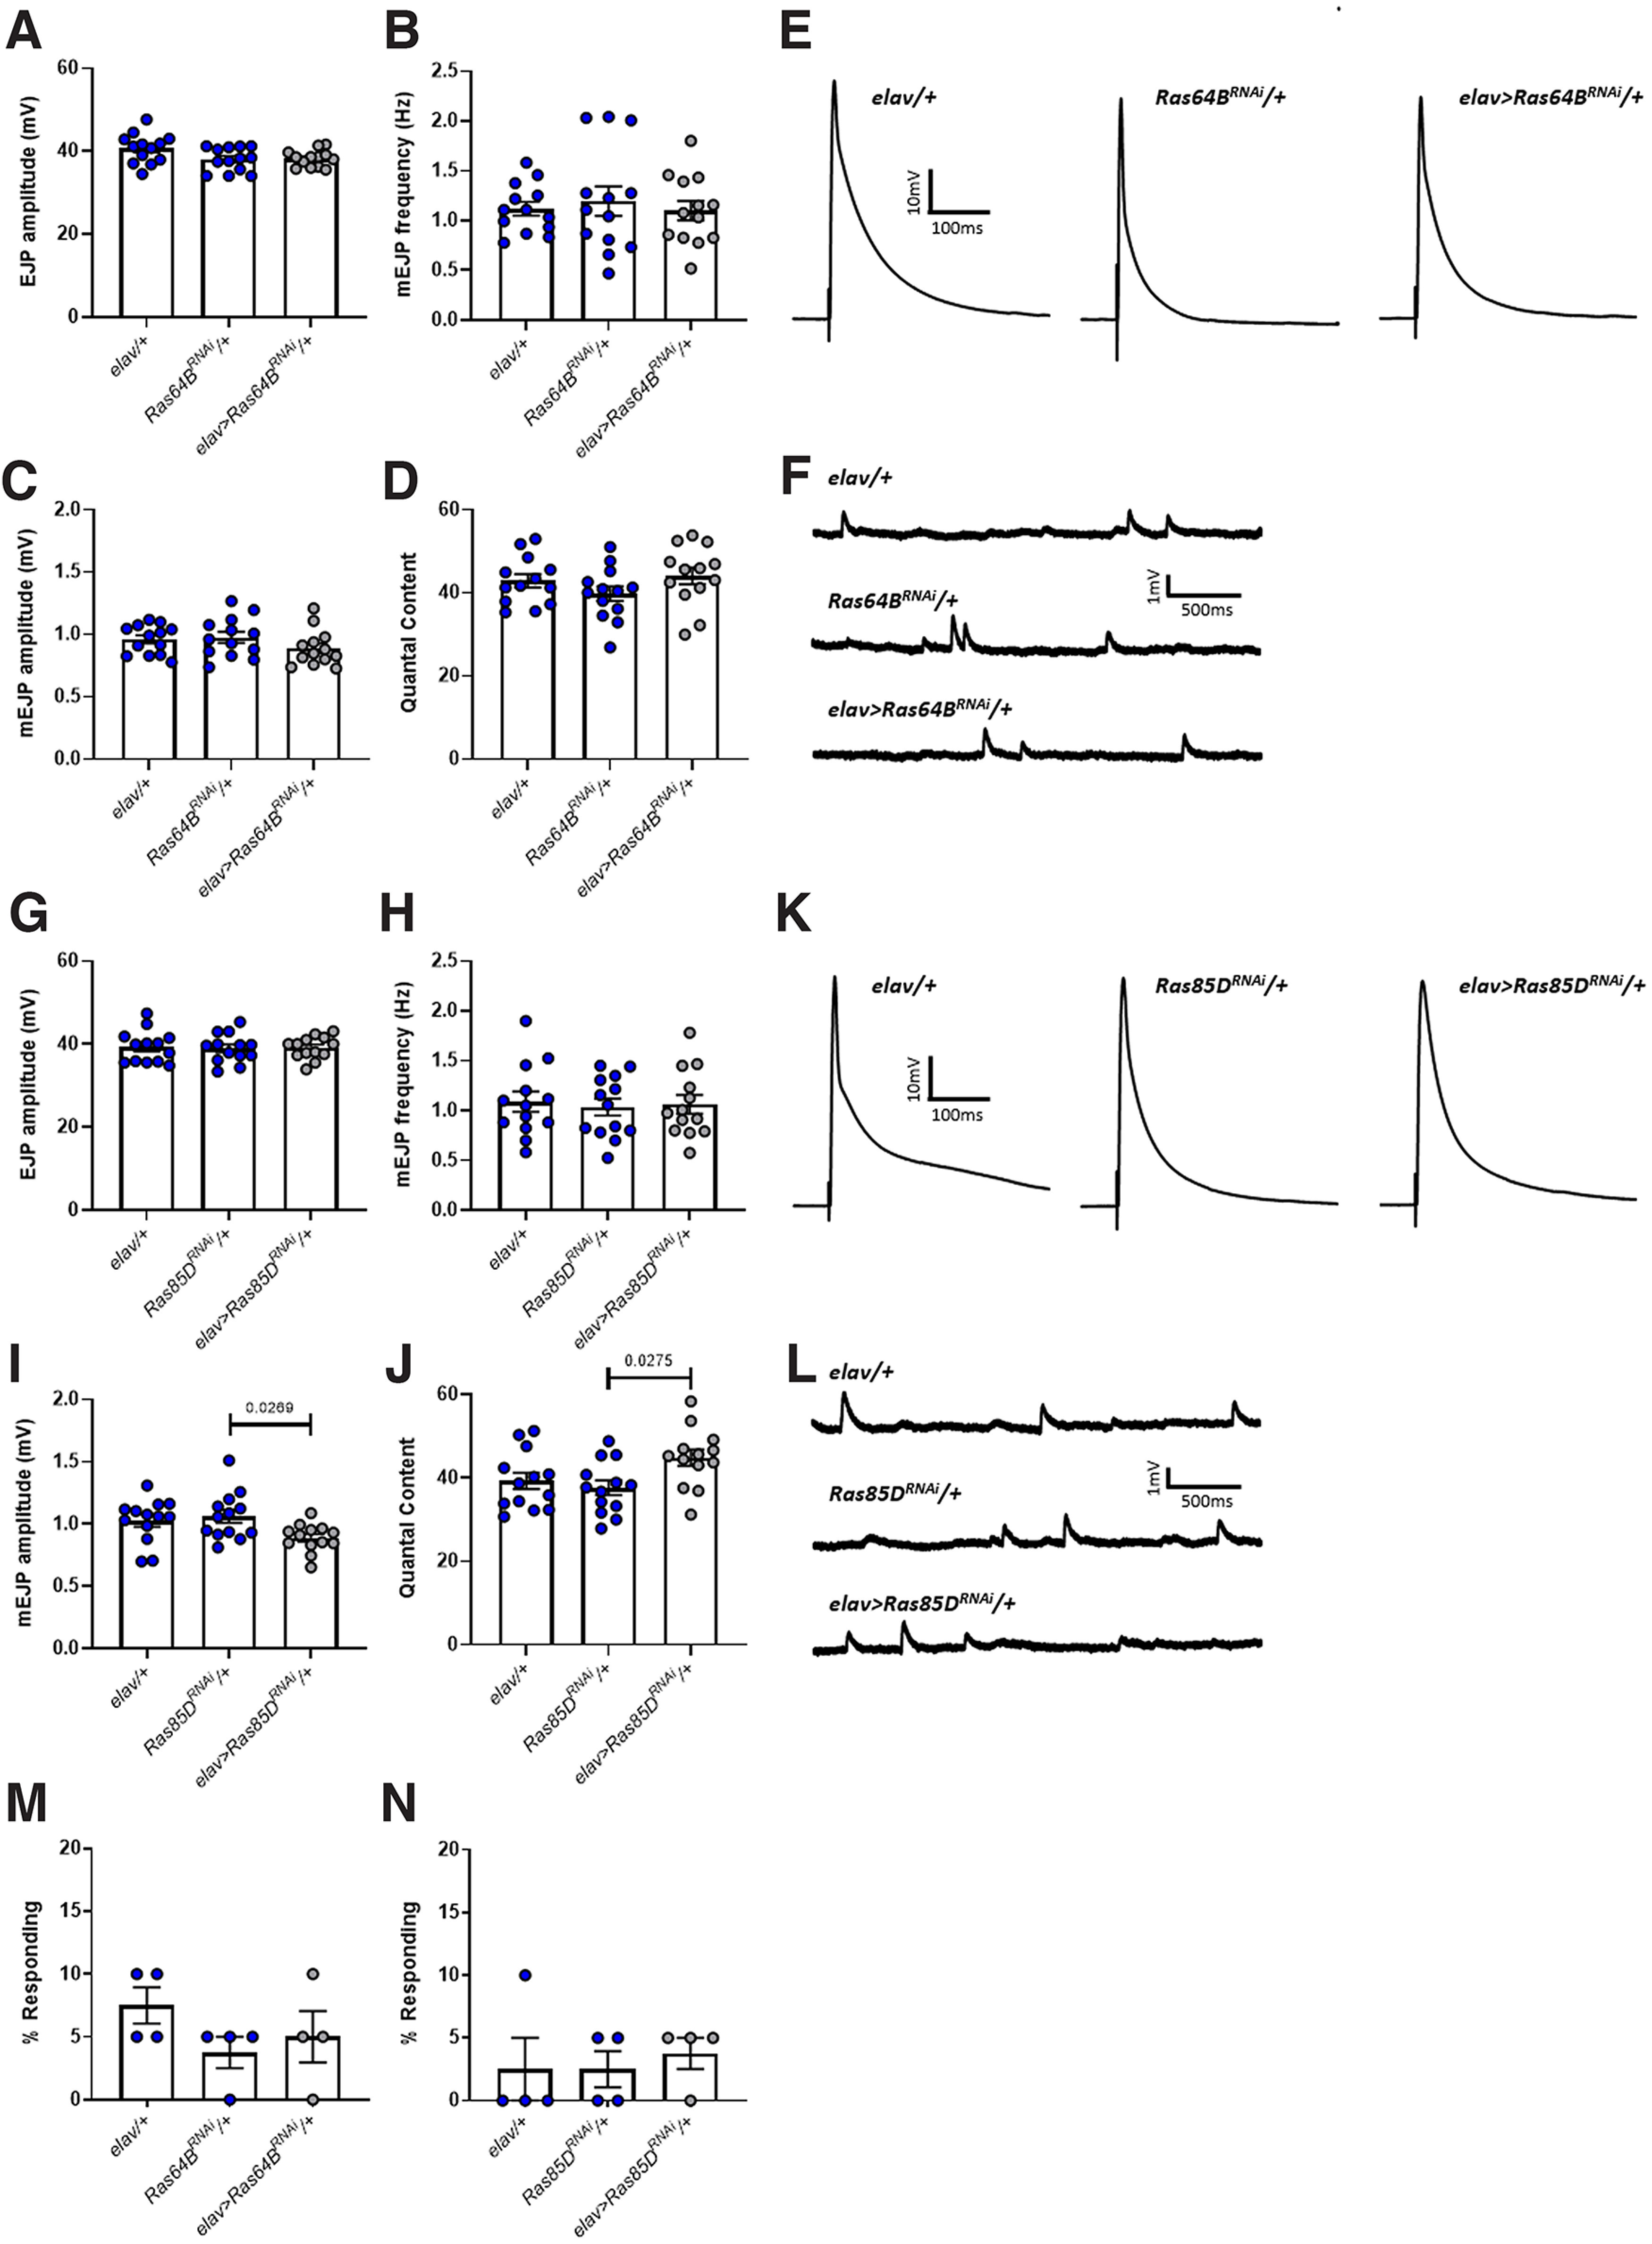
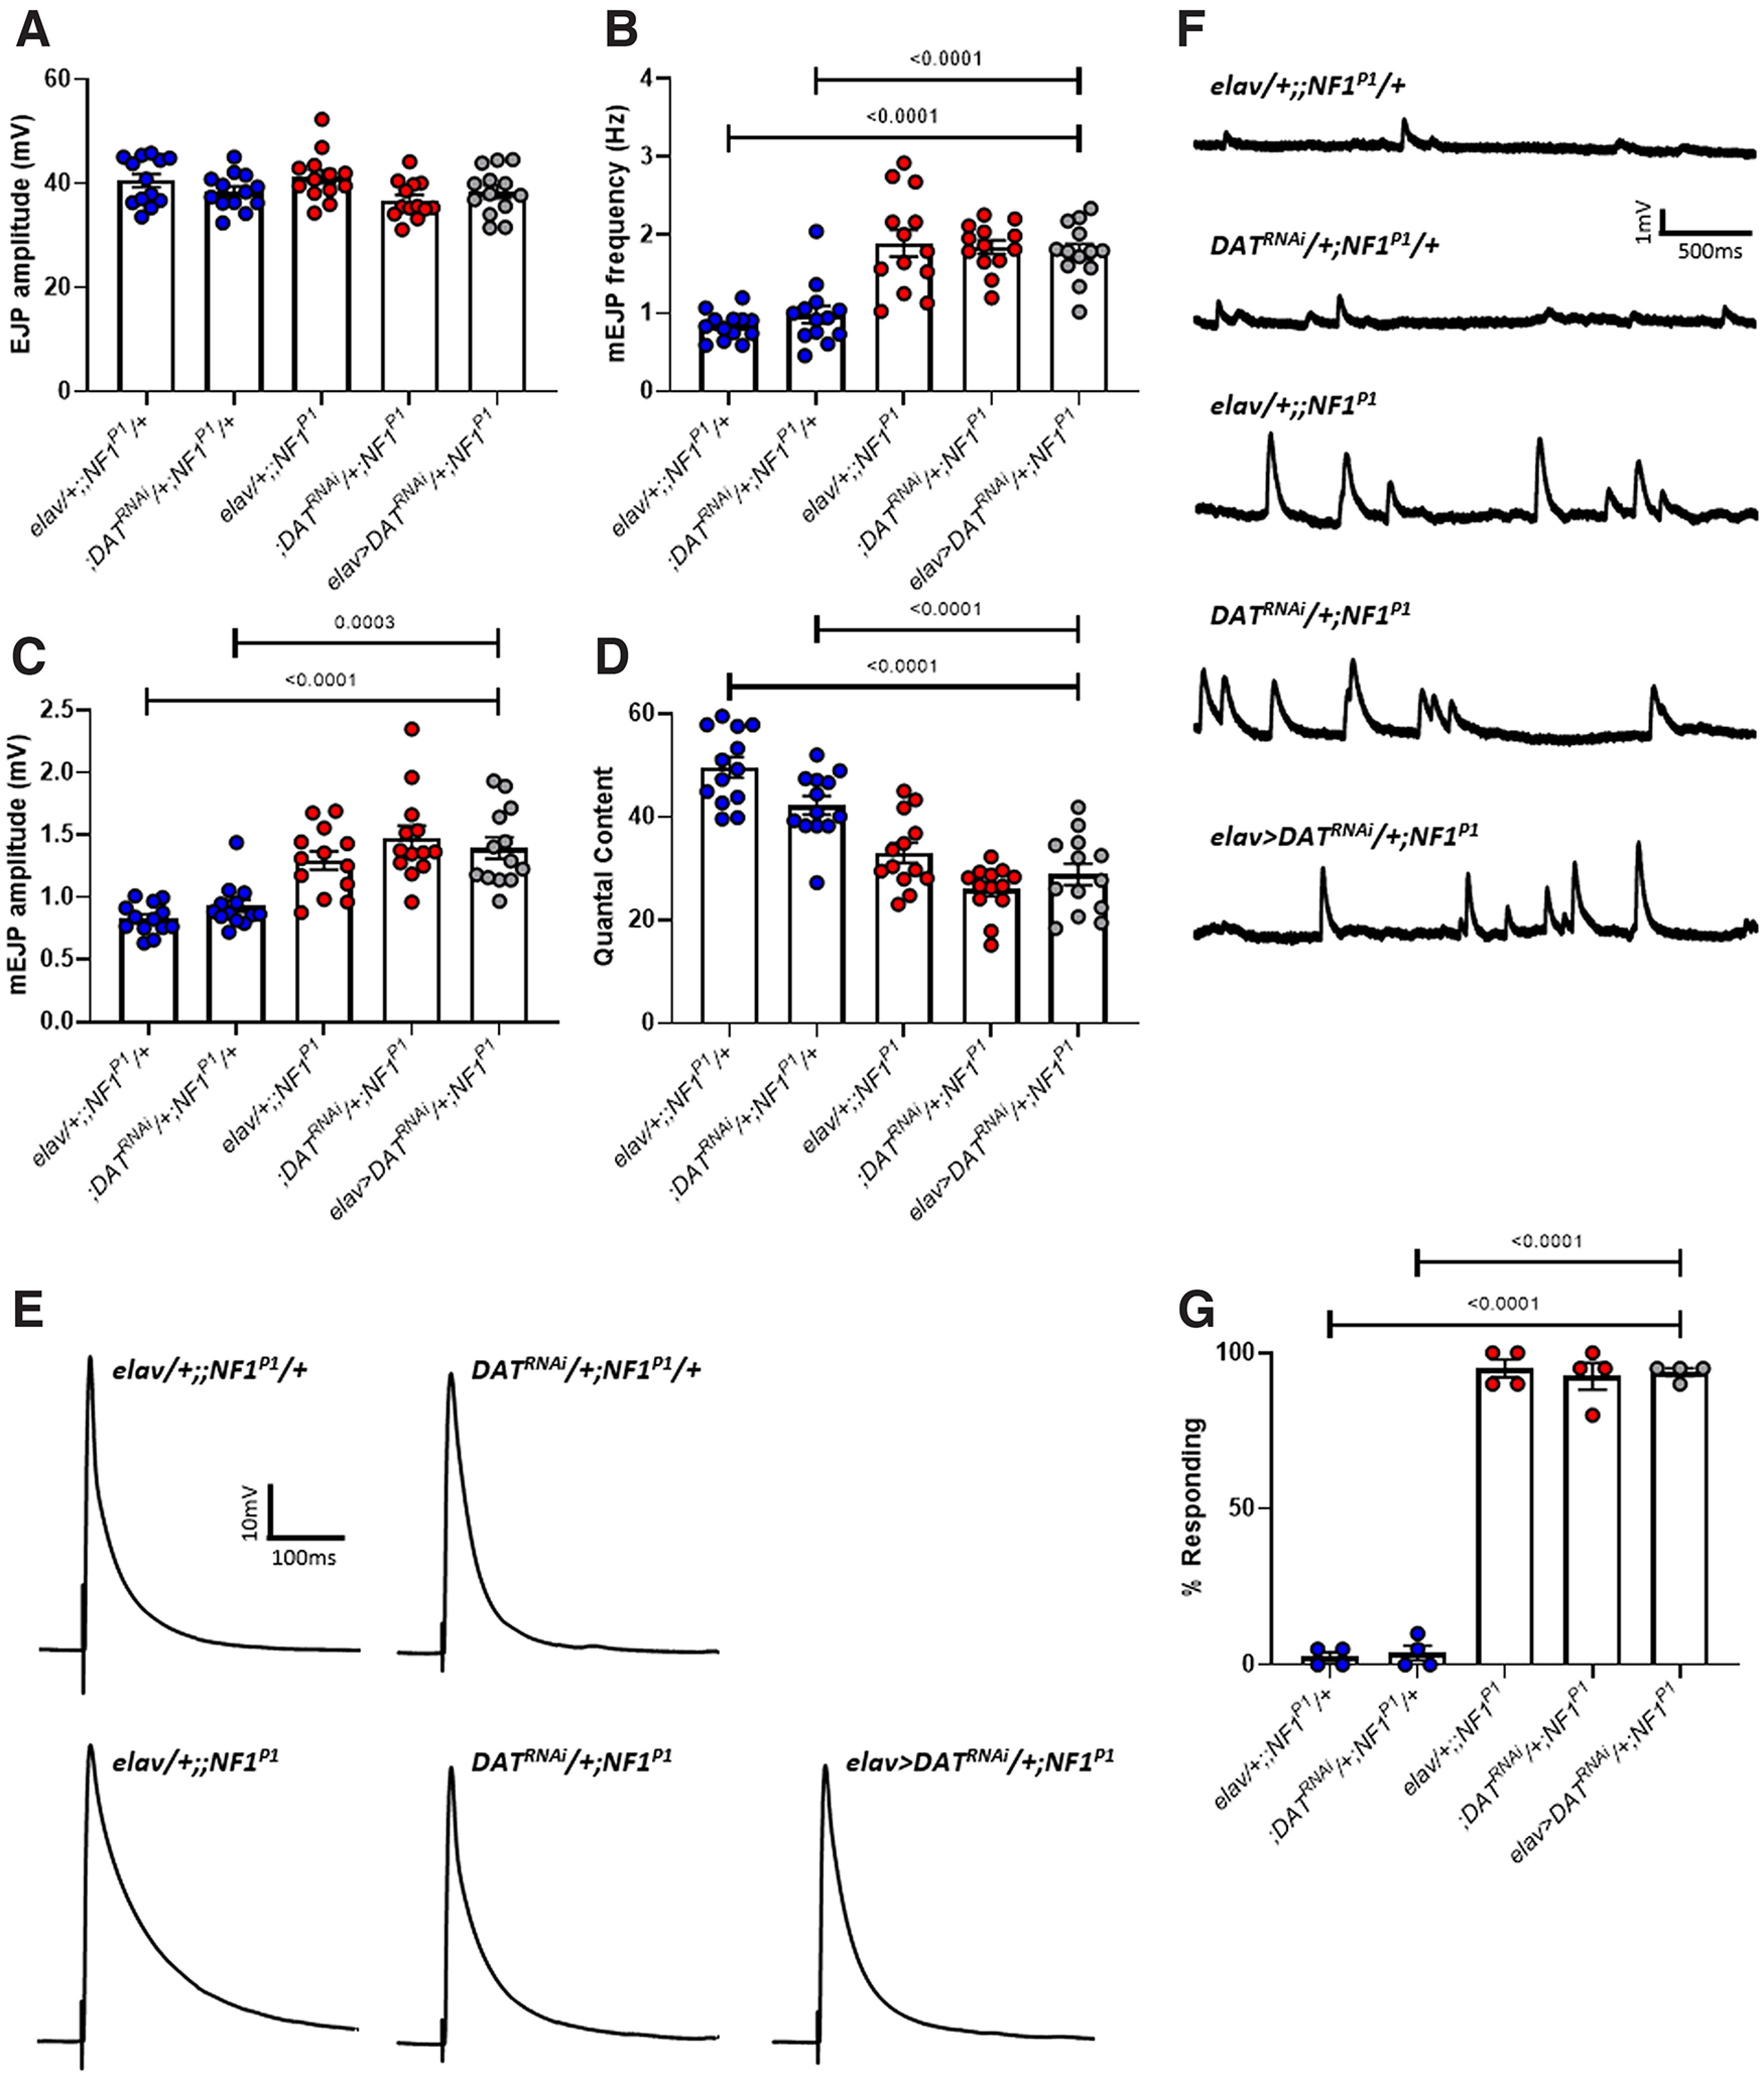
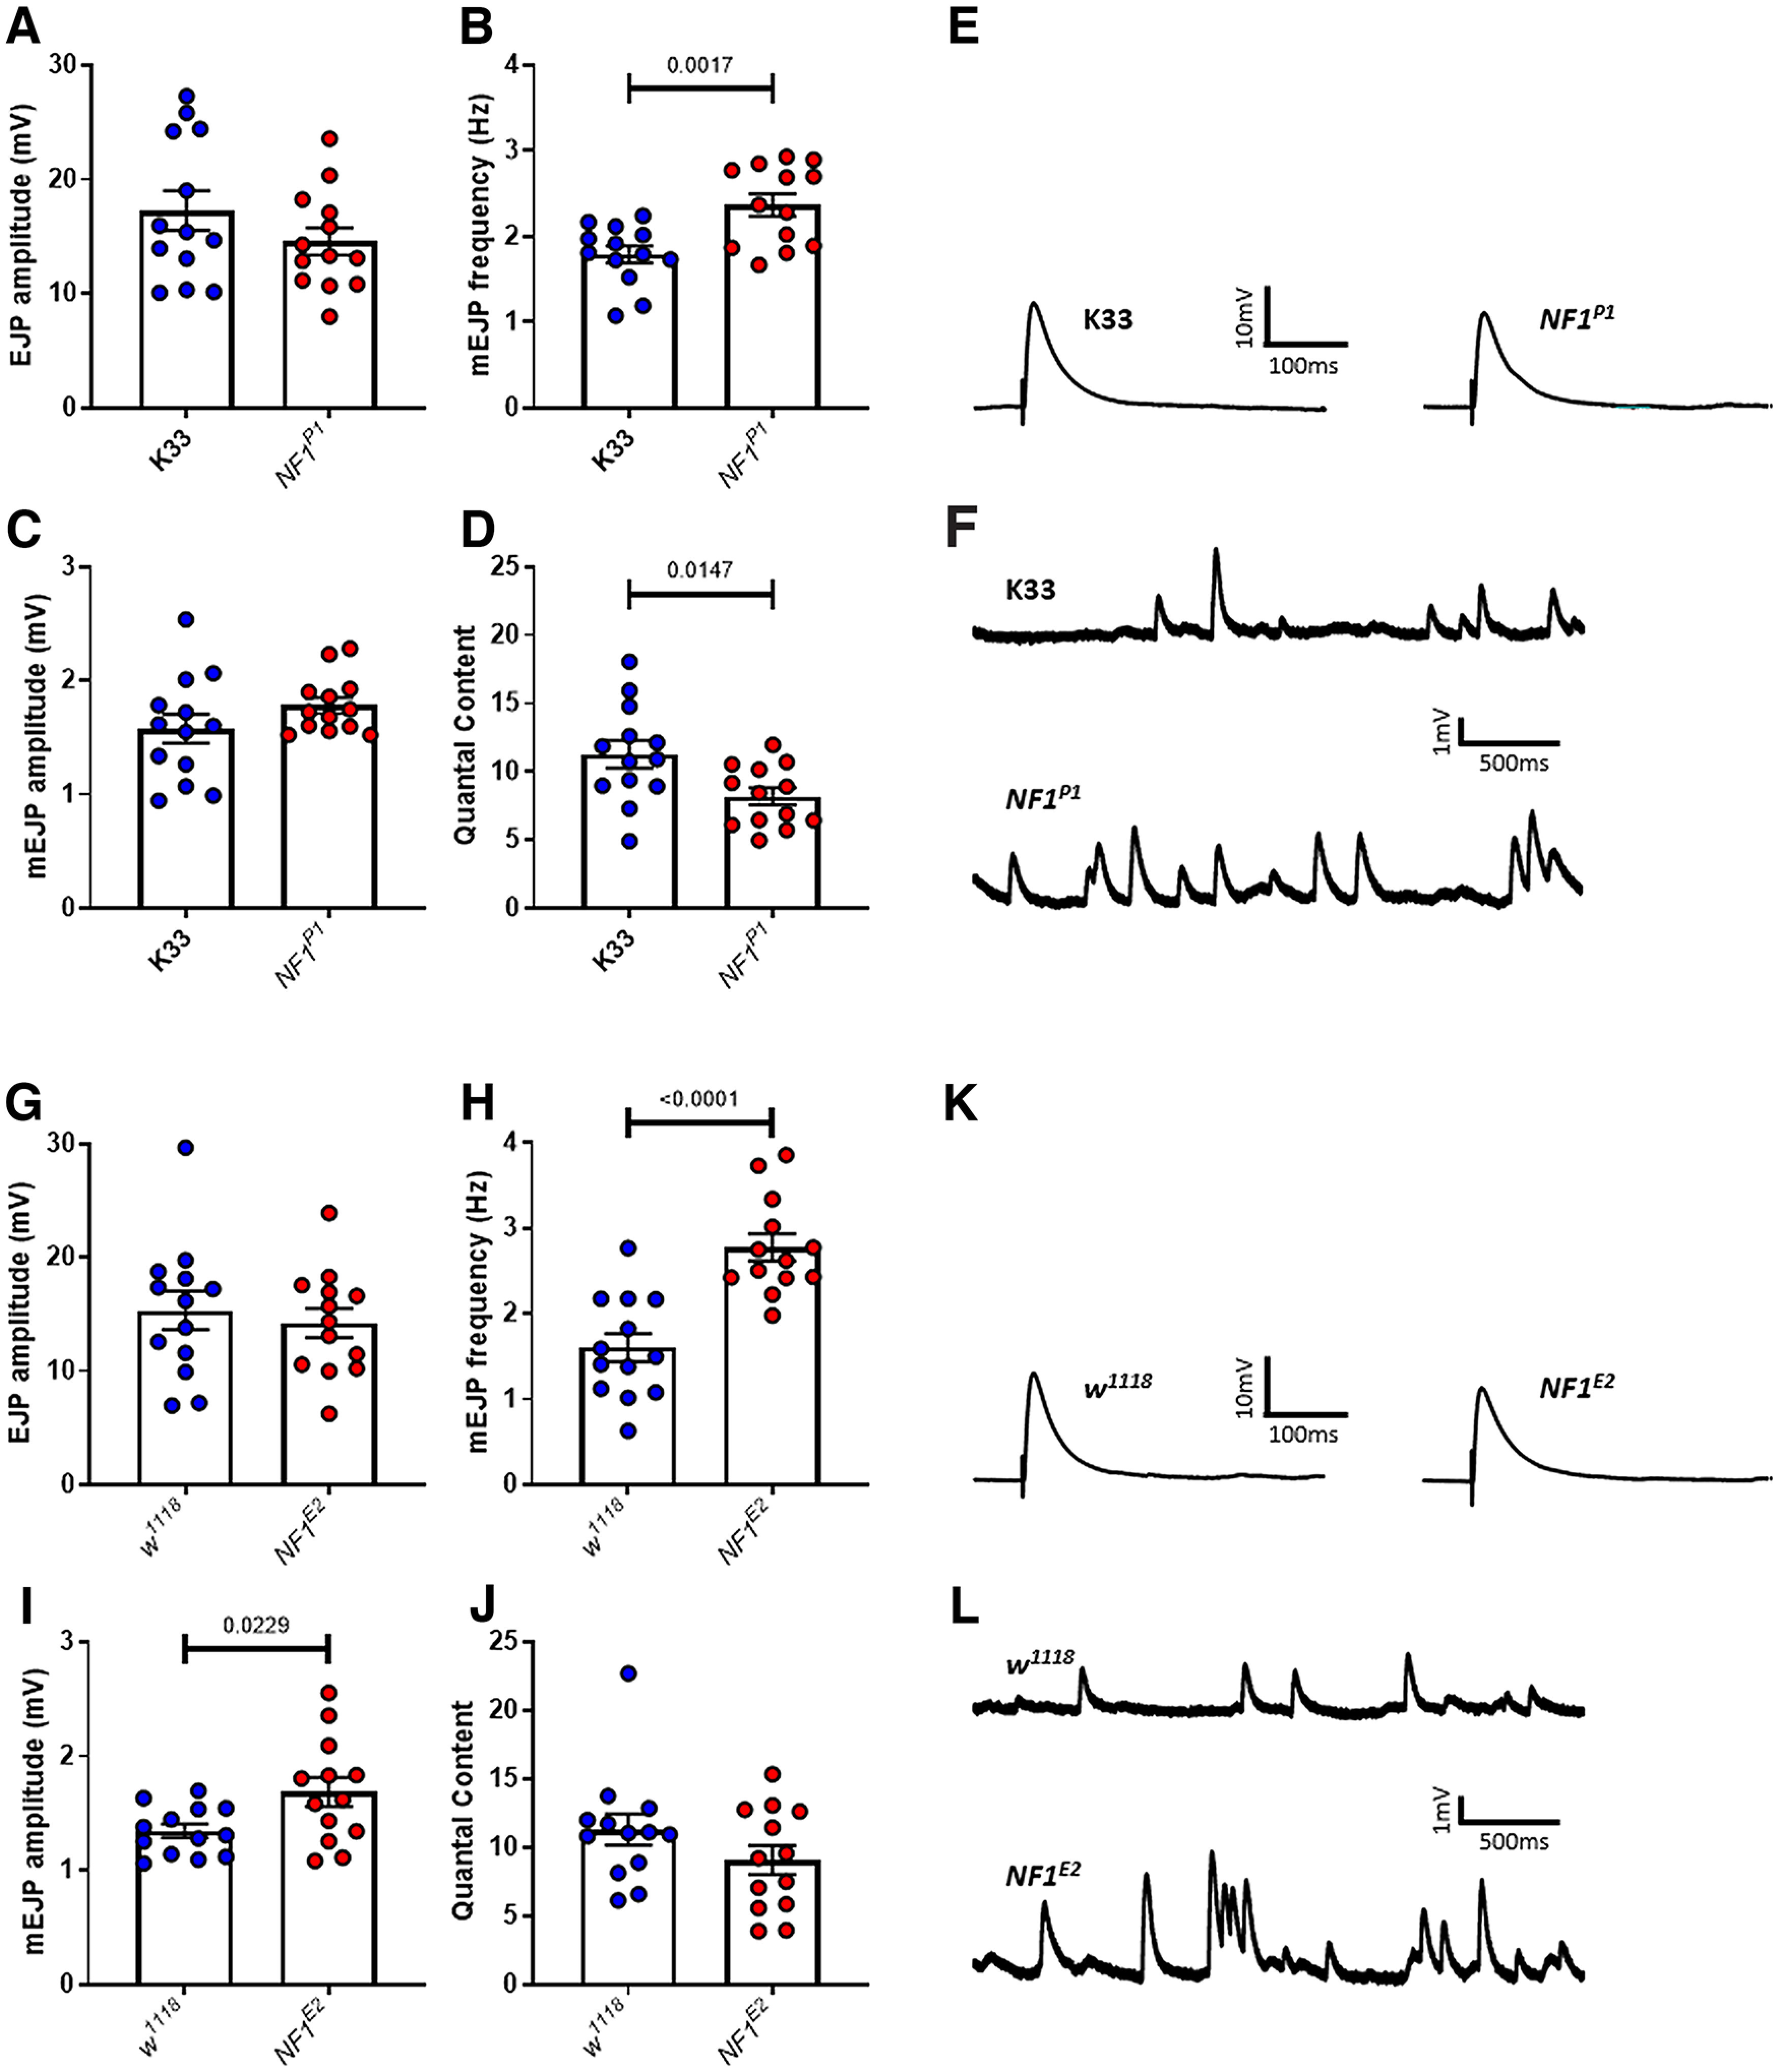
Autism spectrum disorder (ASD) is a neurodevelopmental condition in which the mechanisms underlying its core symptomatology are largely unknown. Studying animal models of monogenic syndromes associated with ASD, such as neurofibromatosis type 1 (NF1), can offer insights into its etiology. Here, we show that loss of function of the Drosophila NF1 ortholog results in tactile hypersensitivity following brief mechanical stimulation in the larva (mixed sexes), paralleling the sensory abnormalities observed in individuals with ASD. Mutant larvae also exhibit synaptic transmission deficits at the glutamatergic neuromuscular junction (NMJ), with increased spontaneous but reduced evoked release. While the latter is homeostatically compensated for by a postsynaptic increase in input resistance, the former is consistent with neuronal hyperexcitability. Indeed, diminished expression of NF1 specifically within central cholinergic neurons induces both excessive neuronal firing and tactile hypersensitivity, suggesting the two may be linked. Furthermore, both impaired synaptic transmission and behavioral deficits are fully rescued via knock-down of Ras proteins. These findings validate NF1 -/- Drosophila as a tractable model of ASD with the potential to elucidate important pathophysiological mechanisms.SIGNIFICANCE STATEMENT Autism spectrum disorder (ASD) affects 1-2% of the overall population and can considerably impact an individual's quality of life. However, there are currently no treatments available for its core symptoms, largely because of a poor understanding of the underlying mechanisms involved. Examining how loss of function of the ASD-associated NF1 gene affects behavior and physiology in Drosophila may shed light on this. In this study, we identify a novel, ASD-relevant behavioral phenotype in NF1 -/- larvae, namely an enhanced response to mechanical stimulation, which is associated with Ras-dependent synaptic transmission deficits indicative of neuronal hyperexcitability. Such insights support the use of Drosophila neurofibromatosis type 1 (NF1) models in ASD research and may provide outputs for genetic or pharmacological screens in future studies.

Keywords: Drosophila; NF1; Ras; autism spectrum disorder; neuromuscular junction; synaptic transmission.


Figures

Figure 1.
Figure 1.
NF1−/− larvae display hypersensitivity to mechanical stimulation. A, Schematic of the mechanoreception assay used to characterize tactile hypersensitivity. An insect pin is pressed down firmly across the posterior end of a larva, an action that may or may not induce a nocifensive rolling motion. B, The mean percentage of larvae (n = 4 trials, 20 larvae per trial, thus n = 80 larvae in total) responding to mechanical stimulation is significantly greater in NF1P1 than in the K33 control. A similar effect is seen when comparing (C) NF1E2 to w1118 controls, and (D) NF1P1/E2 to K33/+ controls. E, Pan-neuronal overexpression of UAS-NF1 in the NF1P1 background fully rescues the phenotype. All data are presented as mean ± SEM. Each data point represents the percentage of larvae responding in a single trial. Statistical comparisons were made via either an unpaired, two-tailed Student's t test (panels B–D) or a one-way ANOVA followed by Tukey's post hoc test (panel E).
Figure 2.
Figure 2.
NF1−/− mutants display reduced evoked but increased spontaneous excitatory synaptic transmission. A, Under current clamp, EJP amplitude is not significantly altered (p = 0.82) in NF1P1 mutants compared with that of K33 controls. However, both (B) mEJP frequency and (C) mEJP amplitude are significantly increased, while (D) quantal content is significantly decreased. E, F, Representative traces of EJPs and mEJPs, respectively, for K33 and NF1P1 lines. G–J, A similar phenotype is seen in NF1E2 mutants compared with w1118 controls, with no change in EJP amplitude (p = 0.18), a significant increase in mEJP frequency and mEJP amplitude, and a significant decrease in quantal content. K, L, Representative traces of EJPs and mEJPs, respectively, analyzed in G–J. M–P, The NF1P1/E2 transheterozygote displays a small but significant reduction in EJP amplitude relative to K33/+ controls (i.e., progeny of K33 crossed to w1118), as well as a significant increase in mEJP frequency and mEJP amplitude, and a significant decrease in quantal content. Q, R, Representative traces of EJPs and mEJPs, respectively, analyzed in M–P. All data are presented as mean ± SEM. All statistical comparisons were made via unpaired, two-tailed Student's t test.
Figure 3.
Figure 3.
Synaptic transmission deficits are presynaptic in origin and specific to loss of NF1 expression. In panels A–D, presynaptic knock-down (left-hand side) is achieved via elav>NF1RNAi/+;Dicer2/+, and postsynaptic knock-down (right-hand side) by MHC>NF1RNAi/+;Dicer2/+. Controls (blue dots) are elav>GFPRNAi/+;Dicer2/+ and MHC>GFPRNAi/+;Dicer2/+, respectively. A, EJP amplitude is significantly reduced following presynaptic knock-down of NF1, whereas postsynaptic knock-down has no effect. B, Similar to NF1P1 and NF1E2, mEJP frequency is significantly reduced following presynaptic but not postsynaptic knock-down. C, Presynaptic NF1 knock-down increases mEJP amplitude, whereas postsynaptic knock-down does not. D, Quantal content is significantly reduced following NF1 knock-down both presynaptically and postsynaptically, although to a lesser extent in the latter. E, F, Representative traces of EJPs and mEJPs, respectively, analyzed in A–D. G–L, Pan-neuronal overexpression of UAS-NF1 via elav-GAL4 in the NF1P1 background rescues synaptic transmission deficits, with no significant differences between the rescue line (purple circles; elav>UAS-NF1/+;NFIP1) and either heterozygous control (blue circles) for any parameter examined. Furthermore, in panels H–J, both homozygous mutant controls (red circles) were significantly different to both heterozygous controls, and there were no significant differences between either of the heterozygous controls or either of the homozygous mutant controls, respectively. All data are presented as mean ± SEM. All statistical comparisons in A–D were made via two-way ANOVA followed by Sidak's multiple comparisons test, in order to compare elav>NF1RNAi/+;Dicer2/+ to elav>GFPRNAi/+;Dicer2/+ larvae, and MHC>NF1RNAi/+;Dicer2/+ to MHC>GFPRNAi/+;Dicer2/+ larvae. All comparisons in G–J were made via one-way ANOVA followed by Tukey's multiple comparisons test.
Figure 4.
Figure 4.
Pan-neuronal knock-down of NF1 via an alternative UAS-NF1RNAi construct (VDRC #35877) mimics the mutant phenotype. A, EJP amplitude is unaffected by pan-neuronal (elav-driven) knock-down of NF1 (elav>Dicer2/+;NF1RNAi/+, red dots), compared with expression of GFPRNAi instead (elav> GFPRNAi/+;Dicer2/+, blue dots). B, Knock-down of NF1 increases mEJP frequency and (C) mEJP amplitude, with a significant reduction in (D) quantal content. E, F, Representative traces of EJPs and mEJPs, respectively. All data are presented as mean ± SEM. All statistical comparisons were made via unpaired, two-tailed Student's t test.
Figure 5.
Figure 5.
Synaptic current is reduced in NF1P1 mutants. A, Under voltage clamp, EJC amplitude is significantly reduced in NF1P1 mutants. B, mEJC frequency is significantly increased in NFIP1 larvae, while (C) there is no significant difference in mEJC amplitude. D, Quantal content is significantly reduced for NF1P1 larvae. E, F, Representative traces of EJCs and mEJCs, respectively. G, Under voltage clamp in HL3 saline (1.5 mm Ca2+), the paired-pulse ratio (PPR; 2nd EJC amplitude/1st EJC amplitude) is significantly increased in NF1P1 larvae. H, Representative traces of two EJCs evoked with a 50-ms interval. I, In HL3 saline with a reduced Ca2+ concentration (0.4 mm Ca2+), the rate at which a stimulus fails to evoke an EJP under current clamp is significantly greater in NF1P1 larvae. All data are presented as mean ± SEM. All statistical comparisons were made via an unpaired, two-tailed Student's t test.
Figure 6.
Figure 6.
An increase in postsynaptic Rin compensates for reduced evoked transmission in NF1P1 larvae. A, Postsynaptic Rin is significantly increased at the NFIP1 NMJ. B, Representative traces of the voltage response to injection of −1-nA current into the muscle, which was used to estimate the amplitude of Rin, for each genotype. C, A significant increase in postsynaptic Rin is seen at the NMJ of larvae following presynaptic [left-hand side: elav>NF1RNAi/+;Dicer2/+ (red dots) vs elav>GFPRNAi/+;Dicer2/+ (blue dots)], but not postsynaptic [right-hand side: MHC>NF1RNAi/+;Dicer2/+ (red dots) vs MHC>GFPRNAi/+;Dicer2/+ (blue dots)], knock-down of NF1, consistent with it being a homeostatic response to reduced synaptic drive. D, Muscle surface area (SA) is not significantly different between genotypes. E, F, There is no significant difference in pupal length between females or males, respectively, of the two genotypes. G, IV plot of leak currents as measured under voltage clamp from a holding potential of −80 mV. Current has been normalized to capacitance (pA/pF) to account for possible differences in muscle size. The slope of the NF1P1 linear regression is significantly different (p < 0.0001) to that of K33, as are pA/pF values at –150, −135, and –120 mV. All data are presented as mean ± SEM. All datasets were statistically compared via an unpaired, two-tailed Student's t test except for panels C and G, in which data were analyzed via two-way ANOVA followed by Sidak's post hoc test, to compare (C) elav>NF1RNAi/+;Dicer2/+ to elav>GFPRNAi/+;Dicer2/+ larvae, and MHC>NF1RNAi/+;Dicer2/+ to MHC>GFPRNAi/+;Dicer2/+ larvae, or (G) NF1P1and K33 larvae at each voltage step.
Figure 7.
Figure 7.
Loss of NF1 in cholinergic neurons results in neuronal hyperexcitability and tactile hypersensitivity. A–C, The percent time spent burst firing over a 5-min period was significantly greater for NF1P1 mutants compared with K33 controls, as was the number of individual bursts. In contrast, mean burst duration was unchanged between genotypes. D, Representative (top) and extreme (bottom) traces of burst firing for data in A–C. E, elav-driven knock-down of NF1 (elav>NF1RNAi/+;Dicer2/+) induces a significant increase in percent time bursting compared with elav>GFPRNAi/+;Dicer2/+ controls, as does that by ChAT-GAL4 (ChAT>NF1RNAi/+;Dicer2/+) compared with ChAT> GFPRNAi/+;Dicer2/+ controls. In contrast, TH-driven, Gad1-driven, vGlut-driven, P0136-driven, and ppk-driven knock-downs do not. F, As observed in NF1P1 larvae, excessive firing in elav>NF1RNAi/+;Dicer2/+ larvae arises from an increased number of bursts. While there is an increase in burst number for ChAT>NF1RNAi/+;Dicer2/+ larvae, this is nonsignificant. G, ChAT>NF1RNAi/+;Dicer2/+ larvae exhibit excessive activity via an augmented mean burst duration, which is not seen in any other line. H, Only elav-driven and ChAT-driven knock-downs of NF1 (elav>NF1RNAi/+;Dicer2/+ and ChAT>NF1RNAi/+;Dicer2/+, respectively) result in tactile hypersensitivity. All data are presented as mean ± SEM. All statistical analyses in A–C were conducted via unpaired Student's t test. Panels E–H were analyzed via two-way ANOVA followed by Sidak's post hoc test to compare GFPRNAi/+;Dicer2/+ (blue dots) and NF1RNAi/+;Dicer2/+ (red dots) lines within each GAL4 driver group.
Figure 8.
Figure 8.
Knock-down of Ras64B rescues synaptic transmission deficits and tactile hypersensitivity in NF1P1 larvae. A, EJP amplitude was not significantly different between any of the lines tested. B, mEJP frequency in elav>Ras64BRNAi/+;NF1P1 larvae (rescue line; purple circles) is significantly reduced compared with both homozygous mutant lines (red circles). Expression of UAS-Ras64BRNAi also rescues (C) increased mEJP amplitude and (D) reduced quantal content. There were no significant differences between the rescue line and either heterozygous control (blue circles) for any parameter examined. Furthermore, in panels B–D, both heterozygous controls were significantly different to both homozygous mutant controls, and there were no significant differences between either of the heterozygous controls or either of the homozygous mutant controls, respectively. E, F, Representative traces of EJPs and mEJPs, respectively, for each of the lines tested in A–D. G, Pan-neuronal expression of UAS-Ras64BRNAi is sufficient to rescue tactile hypersensitivity in NF1P1 larvae. All data are presented as mean ± SEM. All statistical comparisons were made via one-way ANOVA followed by Tukey's multiple comparisons test.
Figure 9.
Figure 9.
Knock-down of Ras85D rescues synaptic transmission deficits and tactile hypersensitivity in NF1P1 larvae. A, EJP amplitude was not significantly different between any of the lines tested. B, mEJP frequency in elav>Ras85DRNAi/+;NF1P1 larvae (rescue line; purple circles) is significantly reduced compared with both homozygous mutant lines (red circles). Expression of UAS-Ras85DRNAi also rescues (C) increased mEJP amplitude and (D) reduced quantal content. There were no significant differences between the rescue line and either heterozygous control (blue circles) for any parameter examined. Furthermore, in panels B–D, both heterozygous controls were significantly different to both homozygous mutant controls, and there were no significant differences between either of the heterozygous controls or either of the homozygous mutant controls, respectively. E, F, Representative traces of EJPs and mEJPs, respectively, for each of the lines tested in A–D. G, Pan-neuronal expression of UAS-Ras85DRNAi is sufficient to rescue tactile hypersensitivity in NF1P1 larvae. All data are presented as mean ± SEM. All statistical comparisons were made via a one-way ANOVA followed by Tukey's post hoc test.
Figure 10.
Figure 10.
Pan-neuronal knock-down of either Ras64B or Ras85D in otherwise wild-type larvae has no consistent effect on NMJ synaptic transmission or larval tactile sensitivity. A, EJP amplitude is not significantly different between elav/+, Ras64BRNAi/+, and elav>Ras64BRNAi/+ lines, nor is (B) mEJP frequent, (C) mEJP amplitude, or (D) quantal content. E, F, Representative traces of EJPs and mEJPs, respectively, for each of the lines tested in A–D. G, There is also no significant difference in EJP amplitude between elav/+, Ras85DRNAi/+, and elav>Ras85DRNAi/+ lines, as is the case for (H) mEJP frequency. I, However, elav>Ras85DRNAi/+ larvae display a significant increase in mEJP amplitude compared with Ras85DRNAi/+ controls, but not when compared with elav/+ controls. J, Quantal content is also significantly reduced in elav>Ras85DRNAi/+ larvae, but again, only when compared with the Ras85DRNAi/+ control line. K, L, Representative traces of EJPs and mEJPs, respectively, for each of the lines tested in G–J. M, N, There is no effect of Ras64B or Ras85D knock-down, respectively, on the likelihood of a larva exhibiting a nocifensive response following mechanical stimulation. All data are presented as mean ± SEM. In the graphs, control lines are depicted in blue, while experimental lines are depicted in gray. All statistical comparisons were made via a one-way ANOVA followed by Tukey's post hoc test.
Figure 11.
Figure 11.
Knock-down of DAT has no impact on synaptic transmission or tactile hypersensitivity in NF1P1 larvae. A, EJP amplitude was not significantly different between any of the lines tested. B, mEJP frequency in elav>DATRNAi/+;NF1P1 larvae (gray circles) remains significantly increased compared with both heterozygous control lines (blue circles), as is also the case for (C) mEJP amplitude. D, Quantal content remains significantly reduced in elav>DATRNAi/+;NF1P1 larvae compared with both heterozygous controls. There are no significant differences between the elav>DATRNAi/+;NF1P1 line and either homozygous mutant control (red circles) for any parameter examined. Furthermore, in panels B–D, both heterozygous controls were significantly different to both homozygous mutant controls, and there were no significant differences between either of the heterozygous controls or either of the homozygous mutant controls, respectively. E, F, Representative traces of EJPs and mEJPs, respectively, for each of the lines tested in A–D. G, Pan-neuronal expression of UAS-DATRNAi has no impact on the mean percentage of NF1P1 larvae responding to a mechanical stimulus. All data are presented as mean ± SEM. All statistical comparisons were made via one-way ANOVA followed by Tukey's multiple comparisons test.
Figure 12.
Figure 12.
NF1−/− larvae in HL3.1 saline with reduced (0.2 mm) Ca2+ exhibit a “milder” version of the phenotype observed in normal recording conditions. A, EJP amplitude is not significantly different between K33 and NF1P1 larvae in 0.2 mm HL3.1 saline, while (B) mEJP frequency is significantly increased in the NF1P1 line. C, NF1P1 larvae display a slight but not significantly different increase in mEJP amplitude. D, Quantal content is significantly reduced in the NF1P1 mutant. E, F, Representative traces of EJPs and mEJPs, respectively, for K33 and NF1P1 lines. G, EJP amplitude is not significantly different between w1118 and NF1E2 larvae, while (H) mEJP frequency and (I) mEJP amplitude are significantly increased in the NF1E2 line. J, In contrast, there is no longer a significant reduction in quantal content between w1118 and NF1E2 larvae. K, L, Representative traces of EJPs and mEJPs, respectively, for w1118 and NF1E2 lines. All data are presented as mean ± SEM. All statistical comparisons were made via unpaired, two-tailed Student's t test.

Similar articles

Cited by

References

    1. American Psychiatric Association (2013) Diagnostic and statistical manual of mental disorders, Ed 5. Arlington: American Psychiatric Association.
    1. Bai L, Sehgal A (2015) Anaplastic lymphoma kinase acts in the Drosophila mushroom body to negatively regulate sleep. Plos Genet 11:e1005611. 10.1371/journal.pgen.1005611 - DOI - PMC - PubMed
    1. Begum-Ali J, Kolesnik-Taylor A, Quiroz I, Mason L, Garg S, Green J, Johnson MH, Jones EJH; STAARS and EDEN Teams (2021) Early differences in auditory processing relate to autism spectrum disorder traits in infants with neurofibromatosis type I. J Neurodev Disord 13:22. 10.1186/s11689-021-09364-3 - DOI - PMC - PubMed
    1. Bellampalli SS, Khanna R (2019) Towards a neurobiological understanding of pain in neurofibromatosis type 1: mechanisms and implications for treatment. Pain 160:1007–1018. 10.1097/j.pain.0000000000001486 - DOI - PMC - PubMed
    1. Bergoug M, Doudeau M, Godin F, Mosrin C, Vallée B, Bénédetti H (2020) Neurofibromin structure, functions and regulation. Cells 9:2365. 10.3390/cells9112365 - DOI - PMC - PubMed

Publication types

Substances