. 2022 Nov 7;13(1):6710.
doi: 10.1038/s41467-022-34181-0.

Social interactions lead to motility-induced phase separation in fire ants

Affiliations

Social interactions lead to motility-induced phase separation in fire ants

Caleb Anderson et al. Nat Commun. .

Abstract

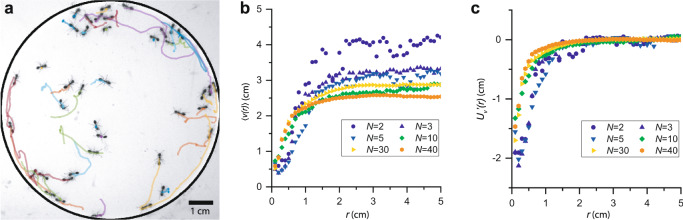
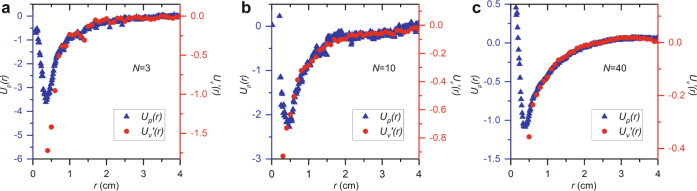
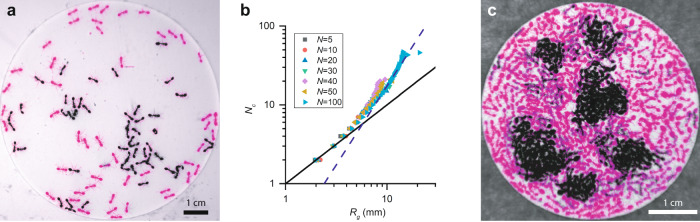
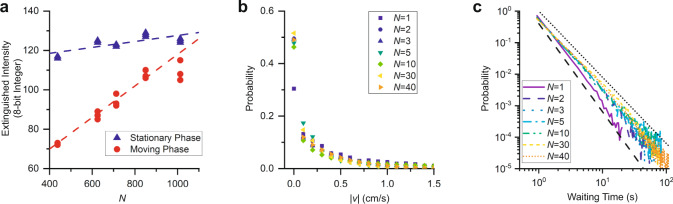
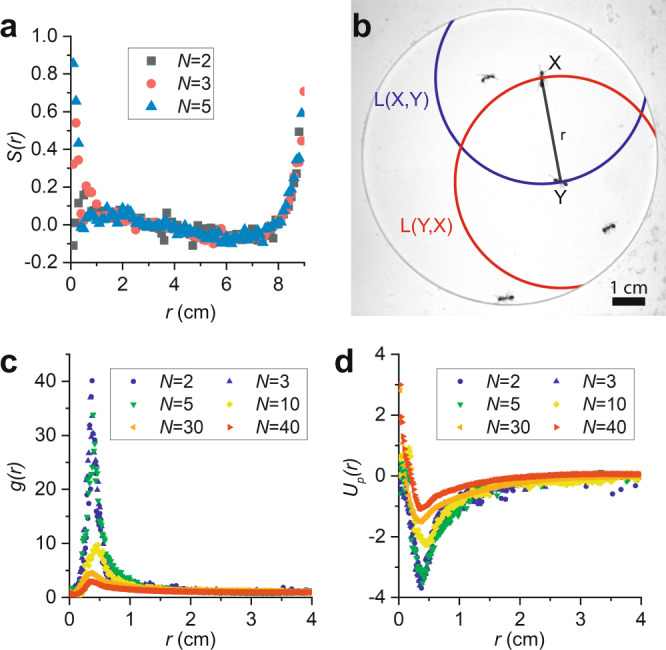
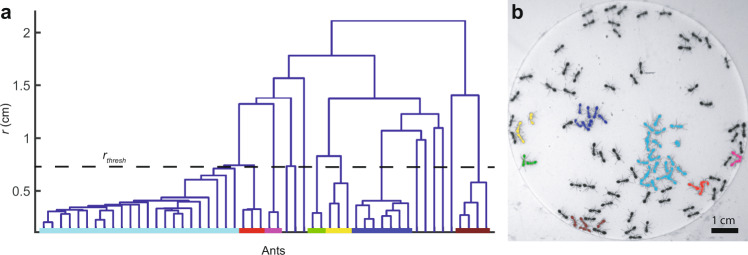
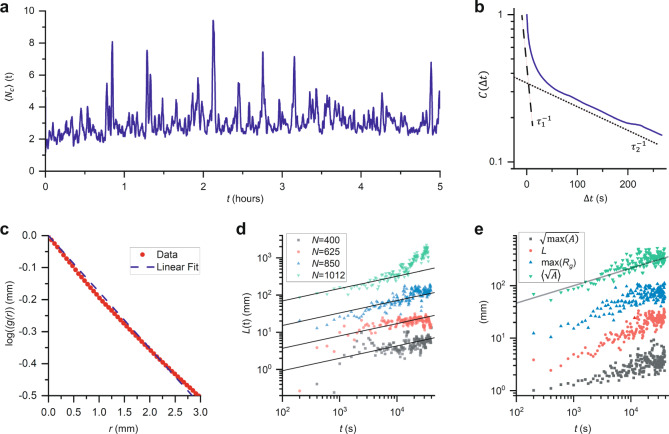
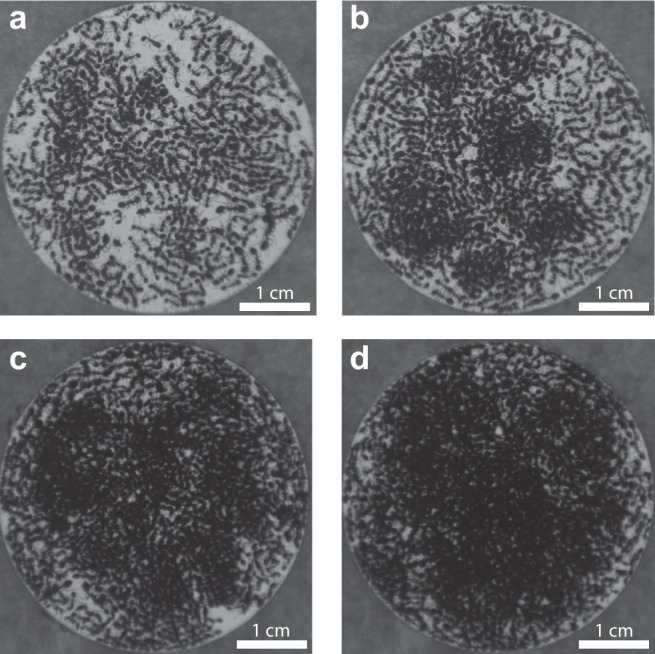
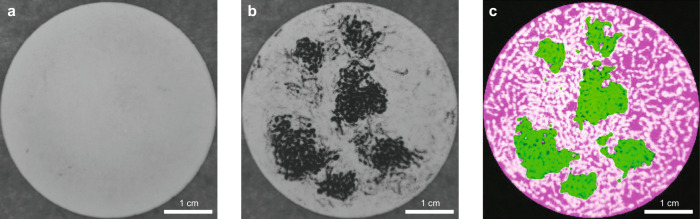
Collections of fire ants are a form of active matter, as the ants use their internal metabolism to self-propel. In the absence of aligning interactions, theory and simulations predict that active matter with spatially dependent motility can undergo motility-induced phase separation. However, so far in experiments, the motility effects that drive this process have come from either crowding or an external parameter. Though fire ants are social insects that communicate and cooperate in nontrivial ways, we show that the effect of their interactions can also be understood within the framework of motility-induced phase separation. In this context, the slowing down of ants when they approach each other results in an effective attraction that can lead to space-filling clusters and an eventual formation of dynamical heterogeneities. These results illustrate that motility-induced phase separation can provide a unifying framework to rationalize the behavior of a wide variety of active matter systems.


Conflict of interest statement

The authors declare no competing interests.

Figures

Fig. 1
Fig. 1. Motility-induced attraction between ants.
a Forty fire ants confined in a 2D cell with their tracked trajectories over the previous 3 s shown as colored lines. The edge of the cell is outlined in black for clarity. b Average speed of the ants as a function of their center-to-center distance. c Motility-induced effective potential between pairs of ants, calculated from the average velocities for a given center-to-center distance.
Fig. 2
Fig. 2. Comparison of effective potentials.
ac The PMF (left axis, blue triangles) and motility-induced effective potential (right axis, red circles) for trials with N = 3, 10, and 40 ants, respectively.
Fig. 3
Fig. 3. Clustering and phase separation.
a False color image of 100 ants in a cell with D = 9.00 cm. Stationary ants are shown in black and moving ants are shown in magenta. b Number of ants in a cluster versus its radius of gyration for various N. The black line shows NcRg and the blue dashed line shows NcRg2. c False color image of about 625 ants in a cell with D = 4.50 cm. Ants that remain stationary over thirty seconds are shown in black and ants that move over thirty seconds are shown in magenta.
Fig. 4
Fig. 4. Departure from equilibrium analogy.
a Measurements of the intensity of the light extinguished by the stationary clusters (blue triangles) and the actively moving phase (red circles) for various numbers of ants contained in D = 4.50 cm cells. The dashed lines are guides to the eye to show that both densities are increasing. b The speed distributions for various numbers of ants in D = 9.00 cm cells. After the addition of a second ant, further additions do not appreciably change the speed distributions. c The probability distributions of waiting times between ceasing and beginning motion. The distributions agree with power laws (dashed and dotted lines).
Fig. 5
Fig. 5. Alignment and pair correlations.
a Alignment between pairs of ants demonstrated by the order parameter for pairs at various distances. b Illustration of the available arc length. The red line shows the available arc length, L(Y,X), for ant Y to be found a distance r away from ant X and the blue line shows L(X,Y). c Calculated pair correlation function after using our geometric correction for different N. d Potentials of Mean Force for different N.
Fig. 6
Fig. 6. Cluster analysis.
a Dendrogram for one frame of an experiment with N = 100 ants. Clusters of ants correspond to branches that cross the rthresh line. Leaves that correspond to ants in a single cluster terminate on a line colored to match the cluster in Fig. 6b. Only clusters of more than 1 ant are shown. b Clusters of stationary ants divided using the previous dendrogram. The clusters have, in order of size, Nc = 22, 7, 4, 3, 3, 2, and 2 ants.
Fig. 7
Fig. 7. Cluster dynamics.
a Average size of the clusters measured in the experiment with N = 40 ants. The cluster sizes continually fluctuate. b Autocorrelation function for an experiment with N = 625 ants (solid navy line). We measure two timescales from this function, τ1 (dashed line) and τ2 (dotted line). c The spatial autocorrelation function of pixels associated to the stationary phase as a function of time for an experiment with N = 625. The dashed line is the best linear fit of log(g(r)), and its slope corresponds to 1/L. d Correlation length scale for the clusters measured in experiments with N ≥ 400. The data for each experiment has been offset vertically and lines representing L ∝ t1/3 have been added for clarity. e Different measurements of relevant lengths in the experiment with N = 850: Ai (gray squares), L (red circles), max(Rg) (blue upwards triangles),maxA (green downwards triangles). The solid gray line is Lt1/3.
Fig. 8
Fig. 8. Effects of increasing density.
ad Frames from experiments using N = 438, 625, 850, and 1012 ants, respectively. Notice that both the clusters and the background of moving ants become denser when the number of ants in the cell increases.
Fig. 9
Fig. 9. Density analysis.
a The maximum projection for each pixel over the course of an experiment with N = 625 ants. b The maximum projection for each pixel in the 30 s following the image shown in Fig. 8b. c A composite image showing the results of blurring and thresholding the difference between the previous two panels to isolate the moving (magenta) and stationary (green) phases. These phases are overlayed onto the inverted raw image.

Similar articles

Cited by

References

    1. Nagy M, Ákos Z, Biro D, Vicsek T. Hierarchical group dynamics in pigeon flocks. Nature. 2010;464:890–893. - PubMed
    1. Mora T, et al. Local equilibrium in bird flocks. Nat. Phys. 2016;12:1153–1157. - PMC - PubMed
    1. Wu Y, Kaiser AD, Jiang Y, Alber MS. Periodic reversal of direction allows Myxobacteria to swarm. Proc. Natl Acad. Sci. USA. 2009;106:1222–1227. - PMC - PubMed
    1. Sokolov A, Apodaca MM, Grzybowski BA, Aranson IS. Swimming bacteria power microscopic gears. Proc. Natl Acad. Sci. USA. 2010;107:969–974. - PMC - PubMed
    1. Tennenbaum M, Liu Z, Hu D, Fernandez-Nieves A. Mechanics of fire ant aggregations. Nat. Mater. 2016;15:54–59. - PubMed

Publication types

Substances