. 2022 Nov 7;13(1):6725.
doi: 10.1038/s41467-022-34407-1.

Connecting multiple microenvironment proteomes uncovers the biology in head and neck cancer

Affiliations

Connecting multiple microenvironment proteomes uncovers the biology in head and neck cancer

Ariane F Busso-Lopes et al. Nat Commun. .

Abstract

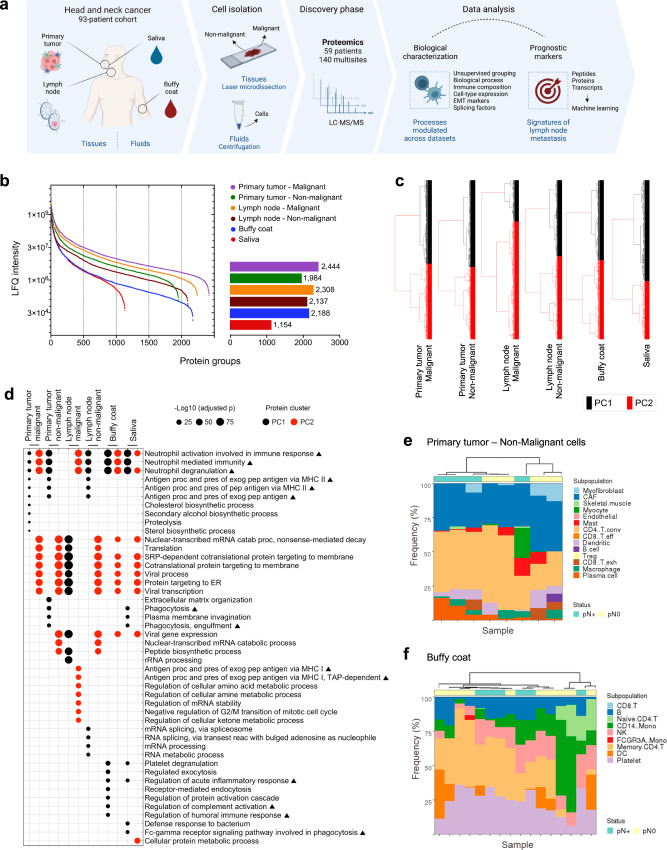
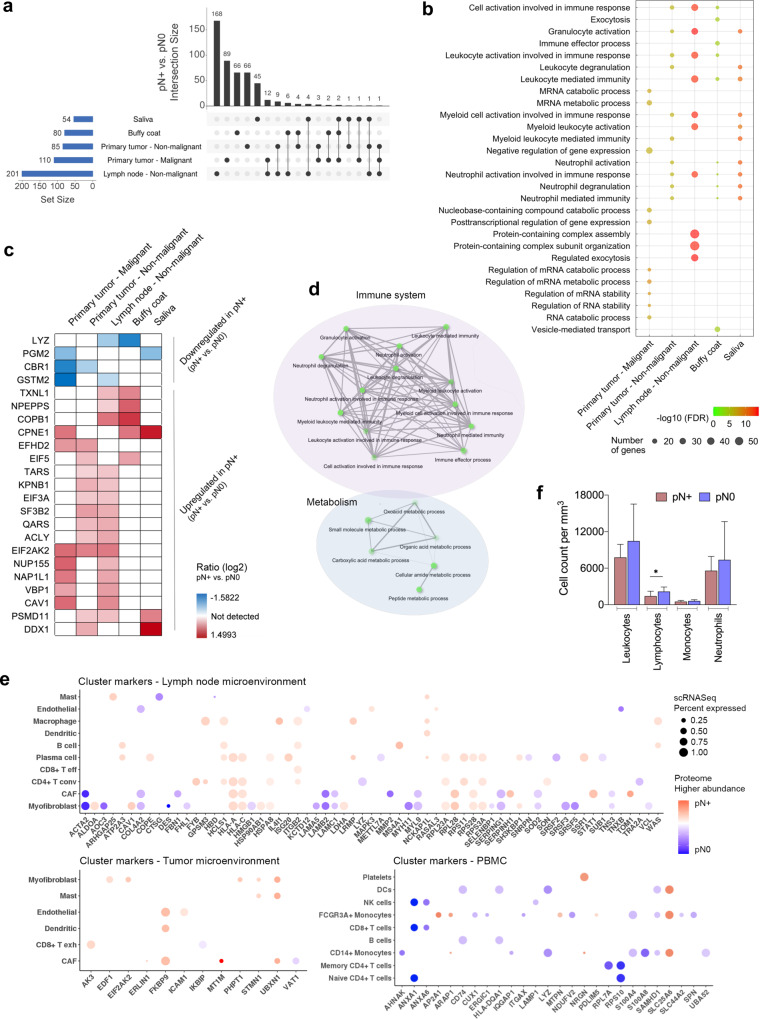
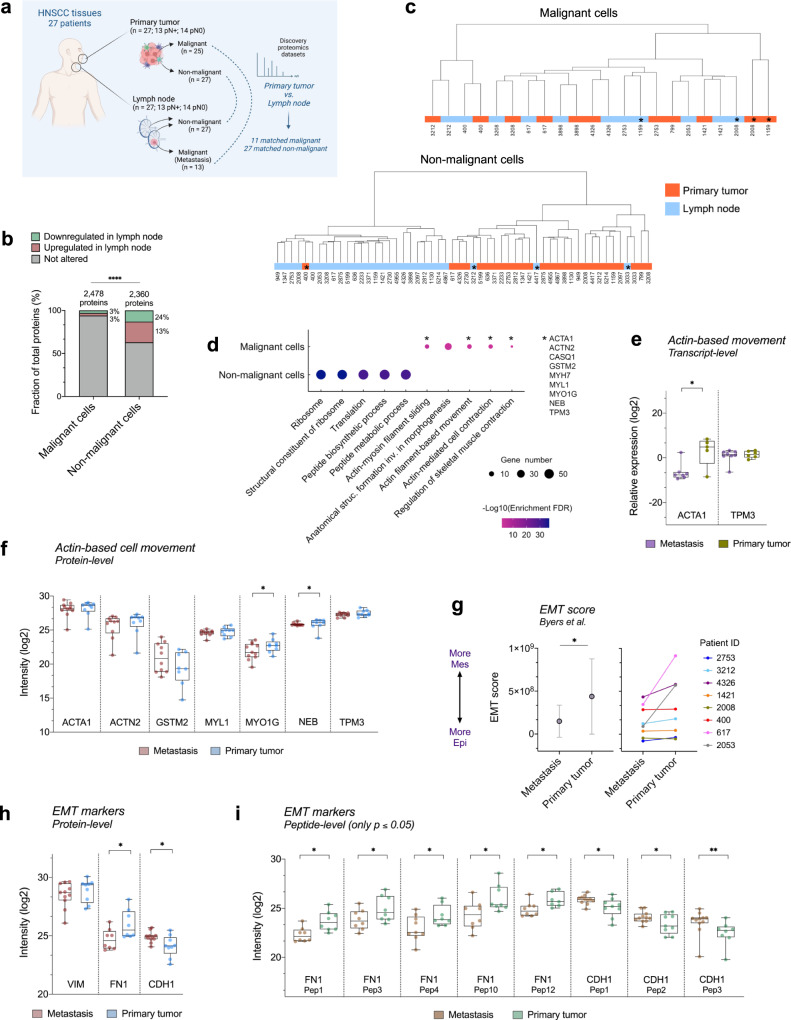
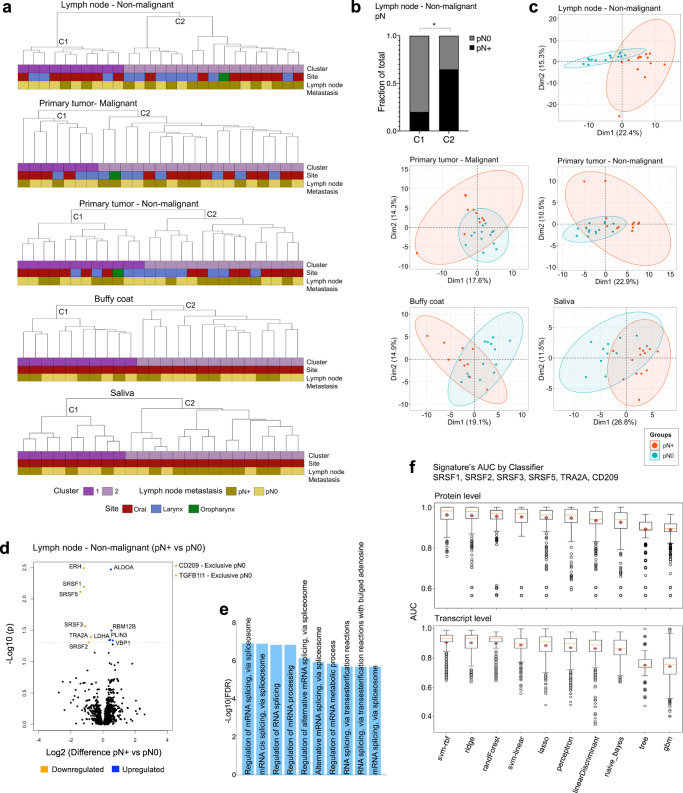
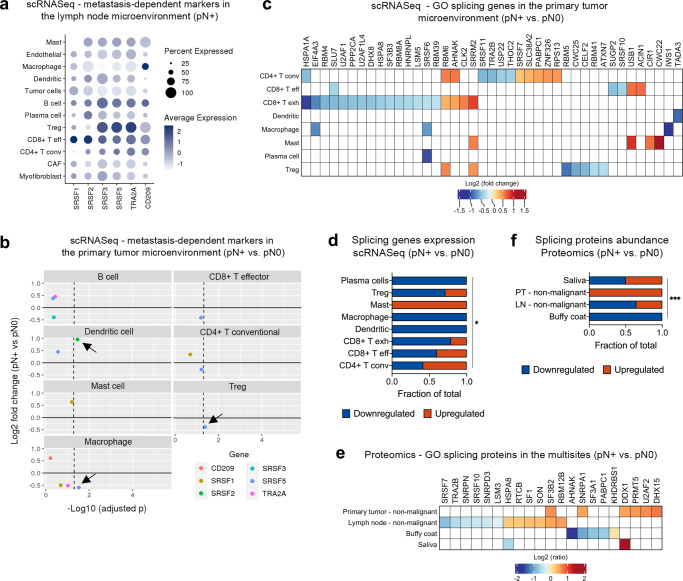
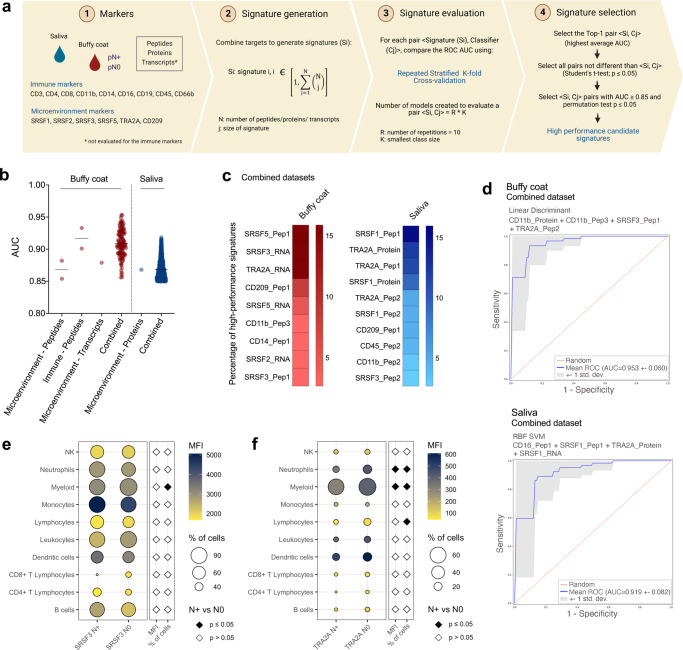
The poor prognosis of head and neck cancer (HNC) is associated with metastasis within the lymph nodes (LNs). Herein, the proteome of 140 multisite samples from a 59-HNC patient cohort, including primary and matched LN-negative or -positive tissues, saliva, and blood cells, reveals insights into the biology and potential metastasis biomarkers that may assist in clinical decision-making. Protein profiles are strictly associated with immune modulation across datasets, and this provides the basis for investigating immune markers associated with metastasis. The proteome of LN metastatic cells recapitulates the proteome of the primary tumor sites. Conversely, the LN microenvironment proteome highlights the candidate prognostic markers. By integrating prioritized peptide, protein, and transcript levels with machine learning models, we identify nodal metastasis signatures in blood and saliva. We present a proteomic characterization wiring multiple sites in HNC, thus providing a promising basis for understanding tumoral biology and identifying metastasis-associated signatures.


Conflict of interest statement

The authors declare no competing interests.

Figures

Fig. 1
Fig. 1. Proteomic profile of tissues and fluids in a 59-HNSCC patient cohort.
a Experimental design to uncover the biological aspects and prognostic markers in the proteomes from multiple HNSCC sites. Created with BioRender.com. b Dynamic range of proteomics quantitative data for primary tumor malignant (n = 25 samples) and non-malignant (n = 27 samples) cells, lymph node malignant (n = 13 samples) and non-malignant (n = 27 samples) cells, buffy coat (n = 24 samples) and saliva cells (n = 24 samples). The bar sizes and respective numbers in the right-sided graph indicate the total number of proteins identified per site. c Groups identified by clustering of the protein datasets for the multisites using the Ward’s method based on Bray-Curtis distance (primary tumor – malignant: 2444 proteins; primary tumor – non-malignant: 1984 proteins; lymph node – malignant: 2308 proteins; lymph node – non-malignant: 2137 proteins; buffy coat: 2188 proteins; saliva: 1154 proteins). d Top-10 significant GO biological processes enriched for the PC groups of the global proteomes (adjusted p ≤ 0.05; two-sided Fisher’s exact test followed by Benjamini-Hochberg correction). Immune-related processes are labeled with a triangle. Predicted composition of immune populations based on proteomic data of non-malignant cells from primary tumors (e) and buffy coat (f) samples using CIBERSORTx version 1.0. Samples were clustered using the Euclidean method and Ward.D distance, and the pN status was annotated. EMT Epithelial-mesenchymal transition, HNSCC head and neck squamous cell carcinoma, LC-MS/MS liquid Chromatography with tandem mass spectrometry. Source data are provided as a Source Data file.
Fig. 2
Fig. 2. Protein profile and immune characterization of markers associated with lymph node metastasis.
a Upset plot presenting the intersection of differentially abundant proteins associated with lymph node metastasis in the multiple sites (pN+ vs. pN0; p ≤ 0.05; two-sided unpaired Student’s t-test or proteins detected exclusively in one group; primary tumor – malignant: n = 11 pN+, 14 pN0 patients; primary tumor and lymph node – non-malignant: n = 13 pN+, 14 pN0; buffy coat: n = 11 pN+, 13 pN0; saliva cells: n = 13 pN+, 11 pN0). b Combined view of the top-10 GO biological processes overrepresented for tissues and fluids considering differentially abundant proteins between pN+ and pN0 from a (Enrichment FDR ≤ 0.01; hypergeometric test followed by FDR correction). c Abundance of 23 proteins significantly associated with lymph node metastasis in multiple sites (pN+ vs. pN0; p ≤ 0.05; two-sided unpaired Student’s t-test or proteins detected exclusively in one group). d Relationship between GO biological processes significantly enriched for the 23 common proteins listed in c (Enrichment FDR ≤ 0.05; hypergeometric test followed by FDR correction). Darker nodes are more significantly enriched gene sets, bigger nodes represent larger gene sets and thicker edges represent more overlapped genes. e Differentially abundant proteins from proteomics data identified as cluster markers of cells from the lymph node microenvironment (upper), the tumor microenvironment (bottom left), and PBMC (bottom right). The size of the circles indicates the percentage of cells expressing the clusters markers in the scRNASeq external dataset. Colors represent the LFQ intensity of the metastasis-associated proteins herein evidenced from the proteomes of lymph nodes or primary tumor non-malignant cells or buffy coat. Higher LFQ levels in pN+ are represented in red and higher LFQ levels in pN0 are in blue. f Immune cell count/mm3 from 9 pN+ and 16 pN0 HNSCC patients. Lymphocyte cell count/mm3 was significantly associated with lymph node metastasis (pN+ vs. pN0; p = 0.0261; two-sided unpaired Student’s t-test). The results obtained for basophils and eosinophils were not plotted to improve visualization (low cell count), and the values were not statistically different between pN+ and pN0 samples. Data are expressed as mean ± standard deviation. *p ≤ 0.05. Source data are provided as a Source Data file.
Fig. 3
Fig. 3. Comparative proteomics analysis of primary tumor and lymph node sites for malignant and non-malignant cells.
a Experimental design to define the differential protein profile of the malignant and non-malignant populations between the tumors and lymph nodes (matched malignant samples from primary tumor and lymph nodes, n = 11 samples per site; matched non-malignant samples from primary tumor and lymph nodes, n = 27 samples per site). Created with BioRender.com. b Frequency of downregulated or upregulated proteins between tumors and lymph nodes in malignant and non-malignant populations (malignant vs. non-malignant; p ≤ 0.0001; two-sided Chi-square test). ****p ≤ 0.0001. c Hierarchical clustering when considering the proteomic profile of malignant and non-malignant cells from primary tumor and lymph nodes (n = 2478 and 2360 proteins, respectively). Clustering was performed using the Ward method with Euclidean distance. *Samples that do not follow the main clustering pattern. d Top-5 GO biological processes enriched for proteins that were differentially abundant between lymph nodes and primary sites in malignant and non-malignant samples (Enrichment FDR ≤ 0.05; hypergeometric test followed by FDR correction). *Actin-based cell movement processes modulated in malignant cells through the deregulation of nine proteins. These proteins were selected for verification. Box plots representing the abundance of transcripts and proteins that are involved in actin-based cell movement using RT-qPCR (e) and PRM-MS (f), respectively (primary tumor malignant samples, n = 9 vs. lymph node matched malignant samples, n = 9; two-sided Wilcoxon signed-rank test for PRM-MS and two-sided Mann-Whitney test for RT-qPCR). The boxplots depict the 25–75% interquartile range (IQR) (box limits), with the median shown as a central line; whiskers indicate the minimum and maximum values. *p ≤ 0.05. g EMT scores of HNSCC malignant cells considering the 76-gene signature proposed by Byers et al. in the discovery datasets (primary tumor malignant samples, n = 11 vs. lymph node (metastasis) matched malignant samples, n = 11; p = 0.0391; two-sided Wilcoxon signed-rank test). *p ≤ 0.05. The left-sided data are mean ± standard deviation and the right image represent individual samples. Box plots representing the abundance of EMT markers at protein- (h) and peptide-levels (i) in malignant cells using PRM-MS (primary tumor malignant samples, n = 9 vs. lymph node matched malignant samples, n = 9; two-sided Wilcoxon signed-rank test or two-sided paired Student’s t-test). Only statistically significant results are shown for peptides. Boxplots depict the 25–75% interquartile range (IQR) (box limits), with the median shown as a central line; whiskers indicate the minimum and maximum values. *p ≤ 0.05; **p ≤ 0.01. HNSCC head and neck squamous cell carcinoma, EMT epithelial-mesenchymal transition. Source data are provided as a Source Data file.
Fig. 4
Fig. 4. Proteome-grouping pattern associated with nodal metastasis and refinement of targets for ML analysis.
a Clustering of tissues and fluids based on the global proteomic profile (C1 and C2 clusters) (n = 59 patients). C1 and C2 groups were generated using Complete Canberra (25 primary tumor – malignant samples: 2444 proteins), and Ward Chebyshev (27 primary tumor – non-malignant: 1984 proteins, 27 lymph node – non-malignant: 2137 proteins, 24 buffy coat: 2188 proteins; 24 saliva samples: 1154 proteins). b Association between lymph node metastasis and patient clustering for non-malignant cells from the lymph node (p = 0.046; two-sided Fisher’s exact test). *p ≤ 0.05. c PCA plots presenting clusters of samples based on the abundance of proteins that were differentially abundant between pN+ and pN0 (p ≤ 0.05; two-sided unpaired Student’s t-test or proteins detected exclusively in one group; 201, 110, 85, 80, 54 proteins from non-malignant cells from lymph nodes, malignant cells from primary tumor, non-malignant cells from primary tumor, buffy coat samples, and saliva samples, respectively). d Volcano plot for the differential protein abundance between pN+ and pN0 non-malignant cells from lymph nodes. Differentially abundant proteins are presented as blue and orange dots (pN+ vs pN0; q ≤ 0.05; two-sided unpaired Student’s t-test followed by Benjamini-Hochberg test or proteins detected exclusively in one group in at least 50% of samples). e Top-10 GO biological processes that were significantly enriched for the 13 proteins associated with lymph node metastasis from d (Enrichment FDR ≤ 0.05; hypergeometric test followed by FDR correction). f AUC distribution per classifier using ML analysis of SRSF1, SRSF2, SRSF3, SRSF5, TRA2A, and CD209 proteins (upper panel) and transcripts (lower panel). Details about the AUCs plotted for each classifier are available within Supplementary Data 5-2 and 5-3. Boxplots show the median (central line), the 25–75% interquartile range (IQR) (box limits), and the ±1.5×IQR (whiskers). Source data are provided as a Source Data file.
Fig. 5
Fig. 5. Molecular patterns of splicing factors in immune cell-type-specific gene expression or multisite proteomes and their relationship with metastasis.
a Expression of the six selected targets (SRSF1, SRSF2, SRSF3, SRSF5, TRA2A, and CD209) in immune populations from HNSCC that were identified by scRNASeq public data in lymph node pN+ microenvironment. b Average fold change (y axis) and adjusted p (x axis) between pN+ and pN0 tumor microenvironments for the six targets evaluated in individual immune populations (two-sided Wilcoxon test followed by Benjamini-Hochberg correction). The dashed lines represent a p threshold of 0.05 and significant results are indicated by arrows. The differences could not be tested for plasma and CD8+ T exhausted cells because there were not enough cells for comparison. c Heat-map representing the average fold change for GO splicing genes differentially expressed between pN+ and pN0 immune populations from tumor microenvironments (pN+ vs. pN0; adjusted p ≤ 0.05; two-sided Wilcoxon test followed by Benjamini-Hochberg correction). Blank cells indicate transcripts without difference between pN+ and pN0. d Proportion of up- and downregulated genes from (c) that are expressed by the immune cells. Gene expression (up- and downregulation in pN+ when compared to pN0) was significantly associated with the immune cell types (p = 0.0210; two-sided Fisher’s exact test). *p ≤ 0.05. e Heat-map representing the average ratio for GO splicing proteins differentially expressed between pN+ and pN0 multisites (pN+ vs. pN0; p ≤ 0.05; two-sided unpaired Student’s t-test). The log2 LFQ ratios are shown for the statistically significant proteins. Blank cells indicate proteins that were not differentially abundant between pN+ and pN0. f Proportion of up- and downregulated proteins from (e) expressed in the multisites. Protein abundance (up- and downregulation in pN+ when compared to pN0) was significantly associated with the environments (p = 0.0008; two-sided Fisher’s exact test). LN: lymph node; PT: primary tumor. ***p ≤ 0.001. Source data are provided as a Source Data file.
Fig. 6
Fig. 6. Definition of the best prognostic signatures in liquid biopsies according to machine learning.
a Design used to determine the signatures of lymph node metastasis with the best performance according to ML. Created with BioRender.com. b High-performance signatures determined for buffy coat and saliva individual and combined datasets after filtering for ROC AUC ≥ 0.85 and permutation p ≤ 0.05. The solid line represents the means for each dataset. c Percentage of markers among the buffy coat (left panel) and saliva (right panel) signatures that exhibited high performance in regard to discriminating pN+ and pN0 patients. Combined datasets containing peptide, protein, and transcript data for the 15 markers were considered. d ROC curves indicating the top-1 pairs <Si, Cj> in buffy coat (upper panel) and saliva (lower panel) samples that discriminated HNSCC patients based on lymph node metastasis status (AUC > 0.919). Shaded region indicates 95% confidence interval for the AUC. Combined datasets containing peptide, protein, and transcript data for the 15 markers were considered. Mean fluorescence intensity (MFI) and percentage of immune cells expressing the proteins SRSF3 (e) and TRA2A (f) in 10 N+ and 10 N0 buffy coat samples. Significant differences between groups are represented as black diamonds (two-sided unpaired Student’s t-test or two-sided Mann-Whitney test; p ≤ 0.05). AUC area under the curve. Source data are provided as a Source Data file.

Similar articles

Cited by

References

    1. Sung H, et al. Global cancer statistics 2020: GLOBOCAN estimates of incidence and mortality worldwide for 36 cancers in 185 countries. CA Cancer J. Clin. 2021 doi: 10.3322/caac.21660. - DOI - PubMed
    1. Ho AS, et al. Metastatic Lymph Node Burden and Survival in Oral Cavity Cancer. J. Clin. Oncol. 2017;35:3601–3609. - PMC - PubMed
    1. Kowalski LP, Sanabria A. Elective neck dissection in oral carcinoma: a critical review of the evidence. Acta Otorhinolaryngol. Ital. 2007;27:113–117. - PMC - PubMed
    1. Carnielli CM, et al. Combining discovery and targeted proteomics reveals a prognostic signature in oral cancer. Nat. Commun. 2018;9:3598. - PMC - PubMed
    1. Puram SV, et al. Single-Cell Transcriptomic Analysis of Primary and Metastatic Tumor Ecosystems in Head and Neck Cancer. Cell. 2017;171:1611–1624.e1624. - PMC - PubMed

Publication types