. 2022 Nov 7;13(1):6536.
doi: 10.1038/s41467-022-34201-z.

Hippocampal astrocytes modulate anxiety-like behavior

Affiliations

Hippocampal astrocytes modulate anxiety-like behavior

Woo-Hyun Cho et al. Nat Commun. .

Abstract

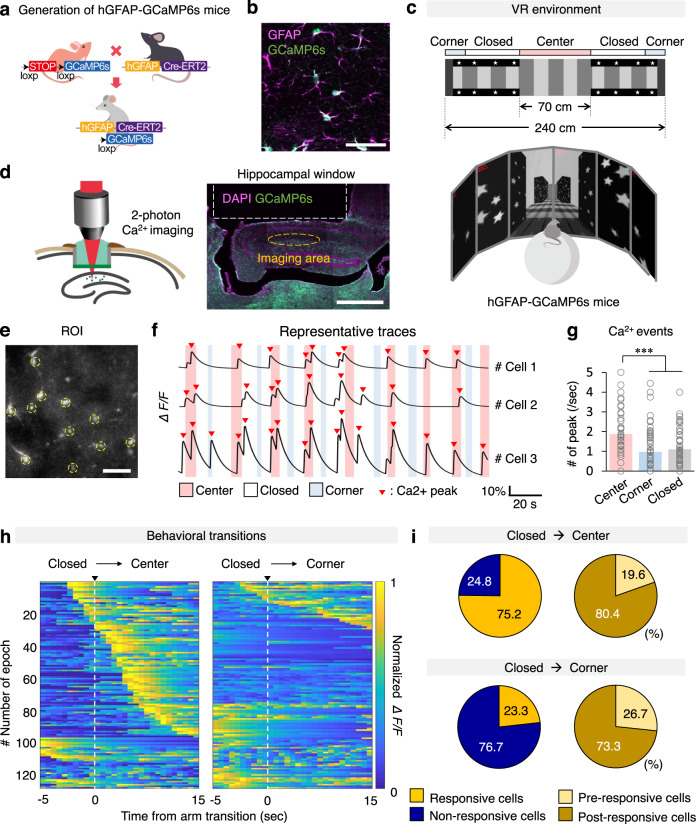
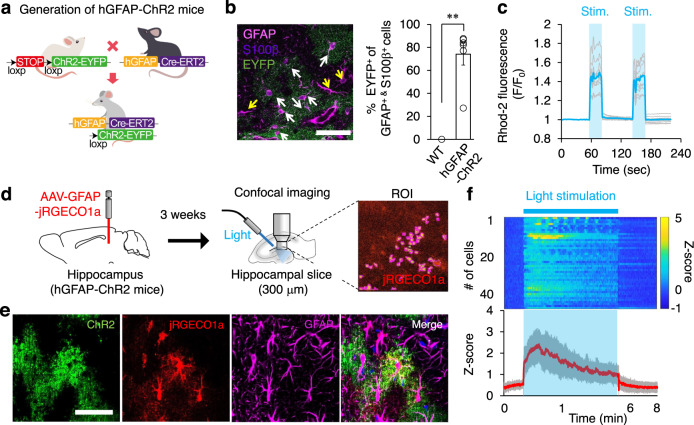
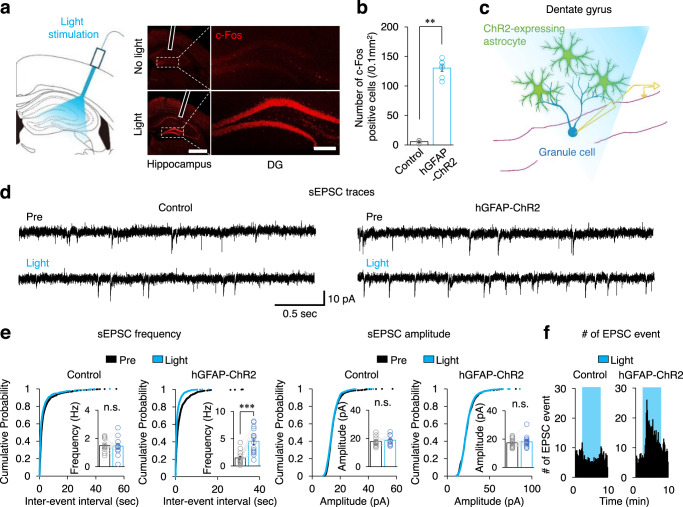
Astrocytes can affect animal behavior by regulating tripartite synaptic transmission, yet their influence on affective behavior remains largely unclear. Here we showed that hippocampal astrocyte calcium activity reflects mouse affective state during virtual elevated plus maze test using two-photon calcium imaging in vivo. Furthermore, optogenetic hippocampal astrocyte activation elevating intracellular calcium induced anxiolytic behaviors in astrocyte-specific channelrhodopsin 2 (ChR2) transgenic mice (hGFAP-ChR2 mice). As underlying mechanisms, we found ATP released from the activated hippocampal astrocytes increased excitatory synaptic transmission in dentate gyrus (DG) granule cells, which exerted anxiolytic effects. Our data uncover a role of hippocampal astrocytes in modulating mice anxiety-like behaviors by regulating ATP-mediated synaptic homeostasis in hippocampal DG granule cells. Thus, manipulating hippocampal astrocytes activity can be a therapeutic strategy to treat anxiety.


Conflict of interest statement

The authors declare no competing interests.

Figures

Fig. 1
Fig. 1. Hippocampal astrocytes respond to anxiogenic environment by intracellular calcium elevation.
a Schematic illustration showing hGFAP-GCaMP6s generation by breeding hGFAP-CreERT2 and floxed-stop-GCaMP6s transgenic mice. b Representative confocal image showing GCaMP6s (green) colocalization in astrocytes (GFAP+, purple). Scale bar, 50 μm. Experiment was repeated five-times independently. c Design of VR environment; a 2D image (upper) and 3D image (bottom) as seen by the mouse. d Schematic representation of two-photon imaging (left) and the hippocampal window (right) indicating the imaging area. Scale bar, 1 mm. e Example region of interest (ROI) of calcium signal recording. Yellow circle: recorded cells. Scale bar, 50 μm. Experiment was repeated five-times independently. f Representative Ca2+ traces during exploration in VR condition. Pink, blue and white bar indicates center, corner and closed corridor in VR. Red triangles indicate Ca2+ peaks. g Number of Ca2+ peak per second when mouse explored the VR center, corner, and closed area (n = 87 cells). One-way ANOVA (p = 0.000) followed by post-hoc analysis LSD (p = 0.000 (center vs corner), p = 0.000 (center vs closed), p = 0.492 (corner vs closed)). h Heat map trace of normalized astrocytic GCaMP6 signals when mice enter the center (left) or the corner (right) from the closed corridor (n = 129 events). i Categories and percentages of hippocampal astrocytes according to activity patterns when mice enter the center (upper) or the corner (lower) from the closed area. Black arrow: Direction of movement. The bar graphs depict the mean ± SEM. ***p < 0.001. See Supplementary Data for detailed statistics. Source data are provided as a Source Data file.
Fig. 2
Fig. 2. Optogenetic astrocyte activation induces intracellular Ca2+ signal.
a Schematic illustration showing hGFAP-ChR2 generation by breeding hGFAP-CreERT2 and floxed-stop-ChR2-EYFP transgenic mice. b Left, representative confocal image showing ChR2 (green: EYFP+) colocalization in astrocytes (pink: GFAP+, purple: S100ß+). Yellow arrow, GFAP+/S100ß+/EYFP cells (n = 412 cells); white arrow, GFAP+/S100ß+/EYFP+ cells (n = 1206 cells). Scale bar, 50 μm. Right, percentage of ChR2-expressing astrocytes between wild-type control (n = 5) and hGFAP-ChR2 (n = 9). Two-tailed Mann−Whitney U-test (p= 0.002). Experiment was repeated three-times independently. c Ca2+ level in ChR2-expressing primary astrocytes with or without light stimulation (blue: mean trace, gray: individual activities). d Schematic illustration of experiment for astrocytic Ca2+ imaging in acute hippocampal slice. Right image, ROI for jRGECO1a-positive astrocytes. e Expression of ChR2 (green), jRGECO1a (red), and GFAP (pink) in hippocampus. Scale bar, 50 μm. f Heatmap representation and averaged trace of hippocampal astrocyte Ca2+ activities while delivering continuous light stimulation for 5 min (n = 46 cells, red: average, gray: standard error). Representative data from three independent experiments. **p < 0.01. See Supplementary Data for detailed statistics. Source data are provided as a Source Data file.
Fig. 3
Fig. 3. Optogenetic astrocyte activation induces anxiolytic effects and increases exploratory drive.
a–e EPM test with light stimulation of dorsal hippocampal astrocytes between control and hGFAP-ChR2 (n = 8 mice in each group). Time in open arm/center, and speed are analyzed from this experiment. a Schematic illustration of optical fiber implantation in dorsal hippocampus (upper) and light stimulation (lower). b Representative traces of control and hGFAP-ChR2 mice in EPM. Blue color represents light-on epoch. c Time spent in the open arm by control and hGFAP-ChR2 mice. Two-way repeated ANOVA (p= 0.000), followed by two-tailed Mann−Whitney U-test (p= 0.817 (first light-off), p= 0.001 (light-on), p= 0.003(last light-off)). d,Time spent in the center by control and hGFAP-ChR2, two-way repeated ANOVA (p = 0.002), followed by two-tailed Mann−Whitney U-test (p= 0.832 (first light-off), p= 0.046 (light-on), p= 0.001(last light-off)). e Travel speed by control and hGFAP-ChR2. Two-way repeated ANOVA (p= 0.002), followed by two-tailed Mann−Whitney U-test (p= 0.674 (first light-off), p= 0.010 (light-on), p= 0.001(last light-off)). f–i OFT test with light stimulation of dorsal hippocampal astrocytes between control (n = 5 mice) and hGFAP-ChR2 (n = 6 mice). Total distance and differences are analyzed from this experiment. f Representative traces of control and hGFAP-ChR2 mice during OFT. g Total distance traveled by control and hGFAP-ChR2. Two-way repeated ANOVA (p= 0.007), followed by two-tailed Mann−Whitney U-test (p = 0.361 (first light-off), p= 0.018 (light-on), p= 0.006 (last light-off)). h Difference of distance traveled in OFT of control and hGFAP-ChR2. Left, during light-on and first light-off epoch. Right, during last light-off and first light-off epoch. Two-tailed Mann–Whitney U-test (p=0.006). i Total distance traveled by control and hGFAP-ChR2 mice upon 5-min light stimulation measured for 1 h. Two-tailed Mann−Whitney U-test (p= 0.018 (5–10 min), p= 0.006 (10–15 min)). The bar graphs depict data as mean ± SEM. *p < 0.05; **p < 0.01. n.s., not significant. See Supplementary Data for detailed statistics. Source data are provided as a Source Data file.
Fig. 4
Fig. 4. Optogenetic astrocyte stimulation enhances hippocampal neuronal activity by increasing sEPSC frequency.
a Left, schematic illustration of optical fiber implantation and light stimulation in the hippocampus. Right, light stimulation increased c-Fos (red) expression in the hippocampus of hGFAP-ChR2 mice. White lines, track of implantation. Scale bars, 1 mm (left), 200 μm (right). b Quantification of the number of c-Fos positive cells in DG between control (n = 4) and hGFAP-ChR2 (n = 7). Two-tailed Mann–Whitney U-test (p = 0.008). c Schematic illustration of whole-cell voltage clamp recording of DG granule cells while optically stimulating nearby astrocytes. d Representative sEPSC traces measured from control and hGFAP-ChR2 hippocampus before (Pre) and during (Light) stimulation. Scale bar, 0.5 s and 10 pA. e sEPSC frequency and amplitude in control (n = 12 cells) and hGFAP-ChR2 (n = 15 cells). sEPSC frequency was compared using Paired t-test (p = 0.879 (Pre vs Light in control group) and p = 0.000 (Pre vs Light in hGFAP-ChR2)). Cumulative probabilities were measured by two sample Kolmogorov-Smirnov test (p = 0.813 (pre vs light in control group), and p = 0.000 (pre vs light in hGFAP-ChR2)). sEPSC amplitude was compared using Paired t-test. (p= 0.436 (pre vs light in control group), and p= 0.566 (Pre vs Light in hGFAP-ChR2)). Cumulative probabilities were measured by two sample Kolmogorov−Smirnov test (p= 0.813 (Pre vs Light in control group), and p= 0.171 (Pre vs Light in hGFAP-ChR2)). f Number of sEPSC events was increased by light stimulation. Blue box, period of light stimulation (5 min). The bar graphs depict data as mean ± SEM. **p < 0.01; ***p < 0.001. n.s. not significant. See Supplementary Data for detailed statistics. Source data are provided as a Source Data file.
Fig. 5
Fig. 5. ATP released from activated astrocyte increases hippocampal sEPSC.
a ATP release from primary astrocyte cells of wild-type control and hGFAP-ChR2 mice (n = 8 mice in each group). Two-tailed Mann-Whitney U-test, p = 0.001. b ATP release from hippocampal slices of control (n = 7 mice) and hGFAP-ChR2 (n = 11 mice). Two-tailed Mann-Whitney U-test, p = 0.044. HC, hippocampus. c Representative sEPSC traces measured from hippocampal DG granule cells before (Pre), 100 μM of ATP, and after (Post) treatment. Scale bar, 1 s and 10 pA. d sEPSC frequency (left) and amplitude (right) of hippocampal DG granule cells (n = 12 cells) upon ATP treatment. One-way ANOVA for sEPSC frequency (p = 0.004), followed by Bonferroni post hoc analysis (p = 0.007 (Pre vs ATP), p = 1.000 (Pre vs Post), p = 0.017 (ATP vs Post)). One-way ANOVA for sEPSC amplitude (p = 0.485). e Representative sEPSC traces measured from hGFAP-ChR2 hippocampus during treatment of vehicle or PPADS before (light-off), during (light-on), and after (light-off) light stimulation. Scale bar, 0.1 s and 10 pA. f sEPSC frequency and amplitude of DG granule cells between vehicle group (n = 18 cells) and PPADS (n = 15 cells). sEPSC frequencies were compared using two-tailed Mann-Whitney U-test (p=0.828 (first light-off), p = 0.021 (light-on), p = 0.347 (last light-off)). sEPSC amplitudes were compared using two-tailed Mann-Whitney U-test (p = 0.691 (first light-off), p = 0.942 (light-on), p = 0.664 (last light-off)). *p < 0.05; **p < 0.01. n.s., not significant. See Supplementary Data for detailed statistics. Source data are provided as a Source Data file.
Fig. 6
Fig. 6. Optogenetic astrocyte activation induces anxiolytic behavior by ATP release.
a Illustration of PPADS administration and optical stimulation in dorsal hippocampus (left) and the experimental scheme (right). b–e EPM test with light stimulation of hippocampal astrocytes while PPADS treatment between control and hGFAP-ChR2 (n = 5 mice in each group). Time in open arm/center, and speed are analyzed from this experiment. b Representative traces in the EPM. c Time spent in open arms during Pre, PPADS, and Post treatment and light stimulations. One-way ANOVA for Pre treatment (p = 0.012) followed by post hoc analysis LSD (p = 0.008 (first light-off vs light-on), p = 0.009 (light-on vs last light-off)); One-way ANOVA for light epochs in PPADS treatment, and post-treatment. d, Time in the center area during pre, PPADS and post treatments and light stimulations. One-way ANOVA for Pre treatment (p = 0.000) followed by LSD (p = 0.001 (first light-off vs light-on), p = 0.000 (first light-off vs last light-off)); One-way ANOVA for PPADS treatment (p = 0.000) followed by LSD (p = 0.000 (first light-off vs light-on), p = 0.026 (first light-off vs last light-off), p = 0.000 (light-on vs last light-off)); One-way ANOVA for Post treatment (p = 0.003) followed by LSD (p = 0.004 (first light-off vs light-on), p = 0.002 (first light-off vs last light-off)). e Speed of mice during Pre, PPADS and Post treatments and light stimulations. One-way ANOVA for Pre treatment (p = 0.001) followed by LSD (p = 0.003 (first light-off vs light-on), p = 0.000 (first light-off vs last light-off)); One-way ANOVA for PPADS treatment (p = 0.003) followed by LSD (p = 0.001 (first light-off vs light-on), p = 0.010 (light-on vs last light-off)); One-way ANOVA for Post treatment (p = 0.000) followed by LSD (p=0.001 (first light-off vs light-on), p = 0.000 (first light-off vs last light-off)). The bar graphs depict the mean ± SEM. *p < 0.05; **p < 0.01; ***p < 0.001. n.s., not significant. See Supplementary Data for detailed statistics. Source data are provided as a Source Data file.

References

    1. Perea G, Yang A, Boyden ES, Sur M. Optogenetic astrocyte activation modulates response selectivity of visual cortex neurons in vivo. Nat. Commun. 2014;5:3262. doi: 10.1038/ncomms4262. - DOI - PMC - PubMed
    1. Gourine AV, et al. Astrocytes control breathing through pH-dependent release of ATP. Science. 2010;329:571–575. doi: 10.1126/science.1190721. - DOI - PMC - PubMed
    1. Sasaki T, et al. Application of an optogenetic byway for perturbing neuronal activity via glial photostimulation. Proc. Natl Acad. Sci. 2012;109:20720–20725. doi: 10.1073/pnas.1213458109. - DOI - PMC - PubMed
    1. Adamsky A, et al. Astrocytic Activation Generates De Novo Neuronal Potentiation and Memory Enhancement. Cell. 2018;174:59–71 e14. doi: 10.1016/j.cell.2018.05.002. - DOI - PubMed
    1. Gomez JA, et al. Ventral tegmental area astrocytes orchestrate avoidance and approach behavior. Nat. Commun. 2019;10:1455. doi: 10.1038/s41467-019-09131-y. - DOI - PMC - PubMed

Publication types