. 2022 Nov 7;13(1):6704.
doi: 10.1038/s41467-022-34205-9.

Mitochondrial membrane proteins and VPS35 orchestrate selective removal of mtDNA

Affiliations

Mitochondrial membrane proteins and VPS35 orchestrate selective removal of mtDNA

Ayesha Sen et al. Nat Commun. .

Abstract

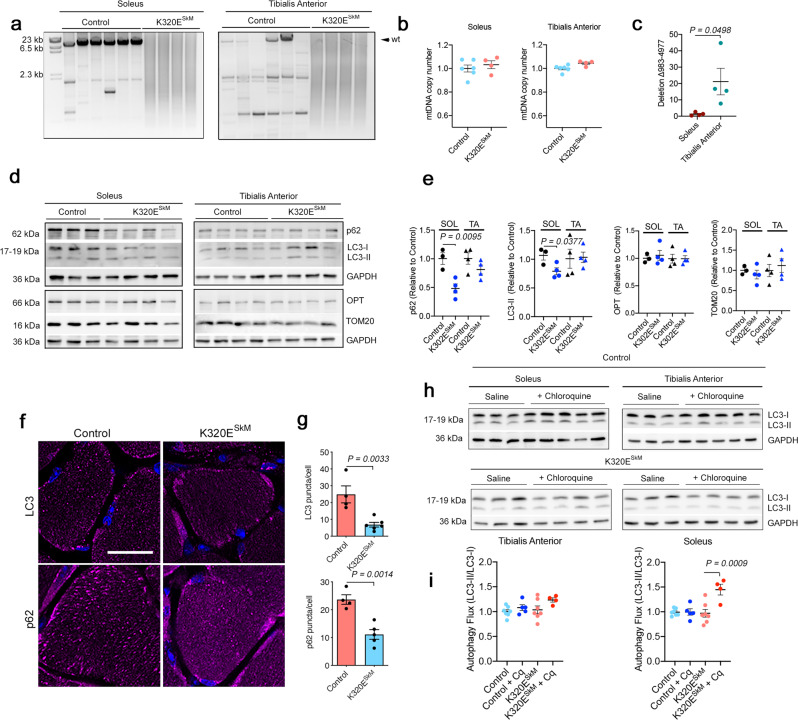
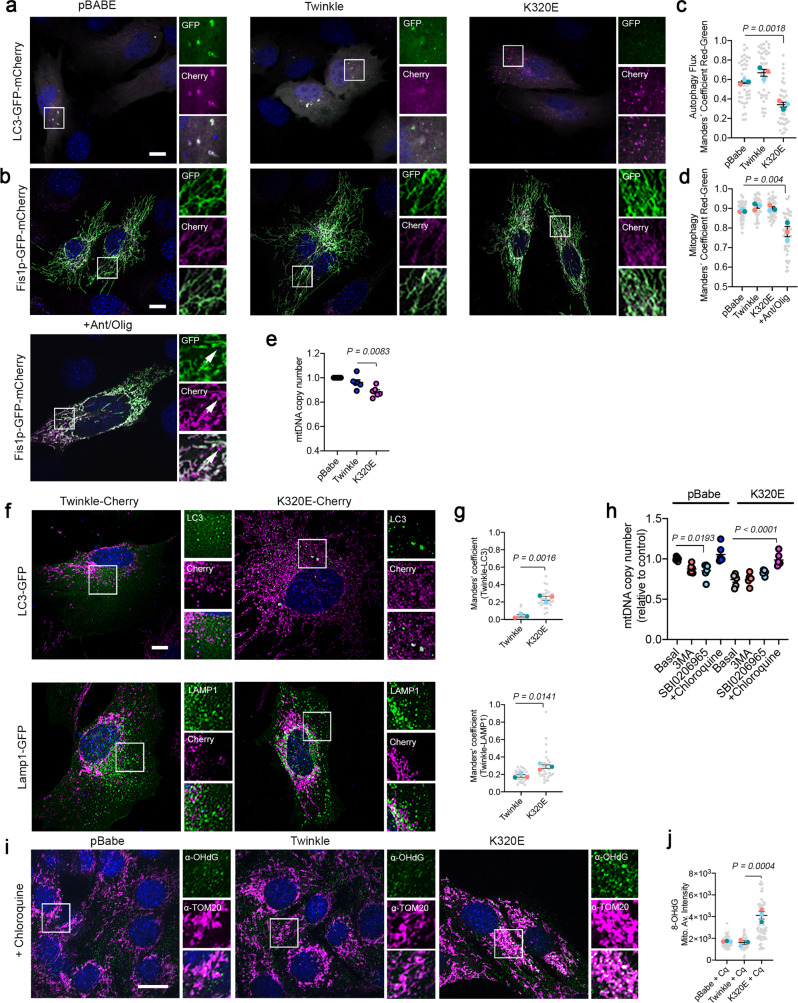
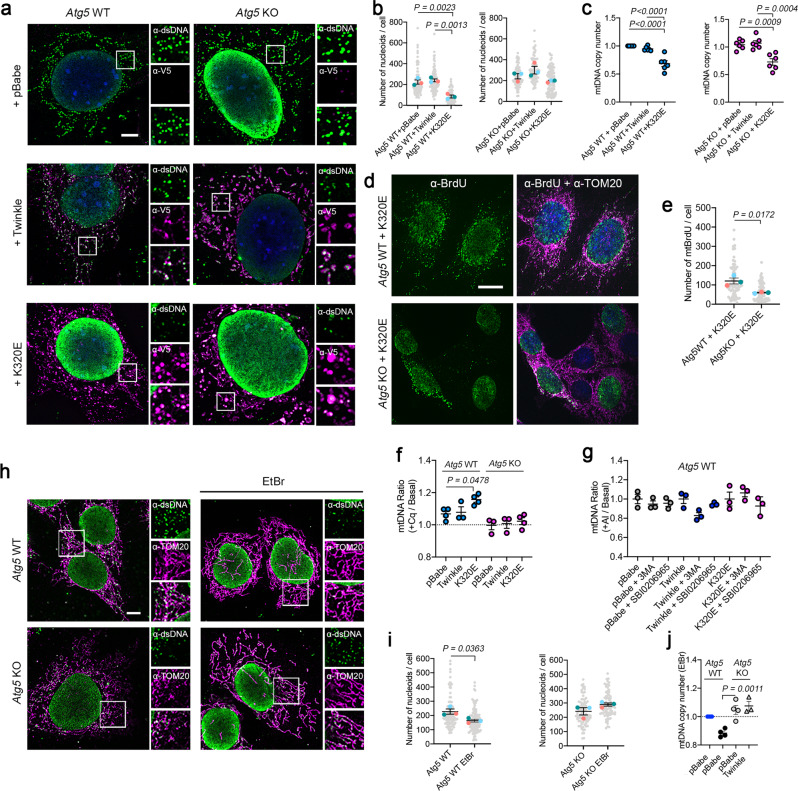
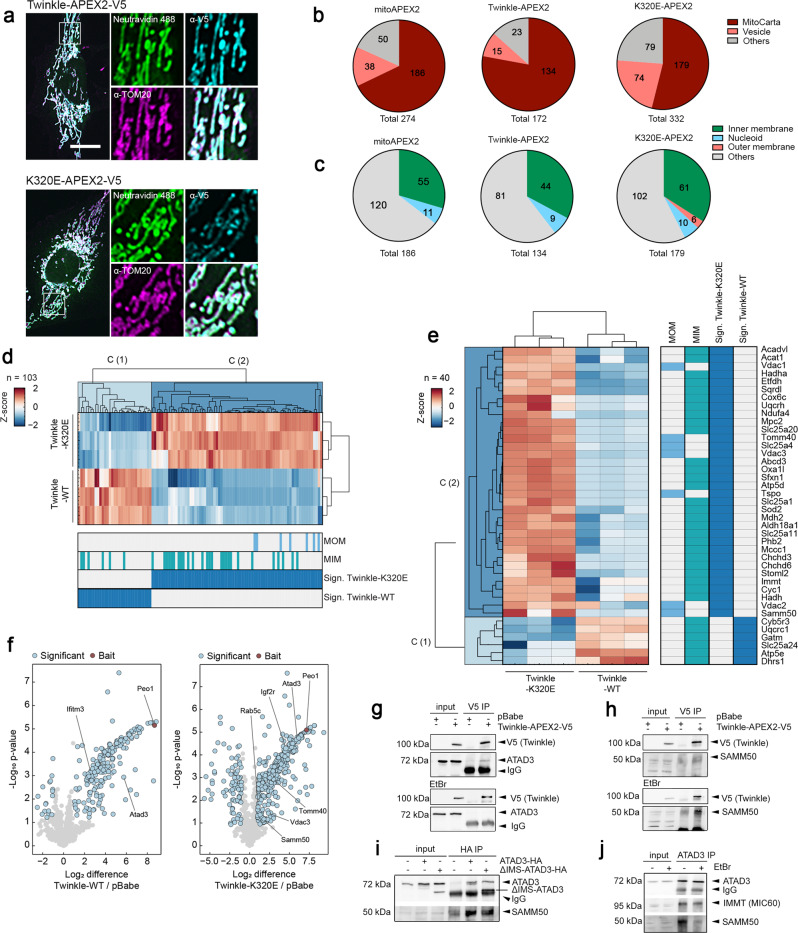
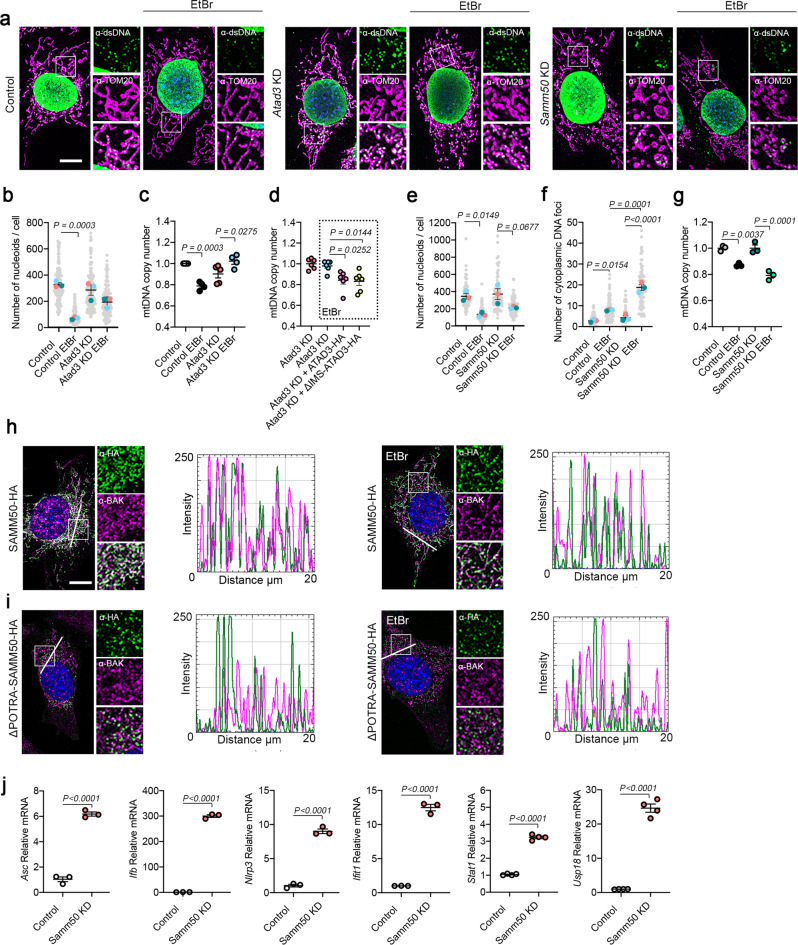
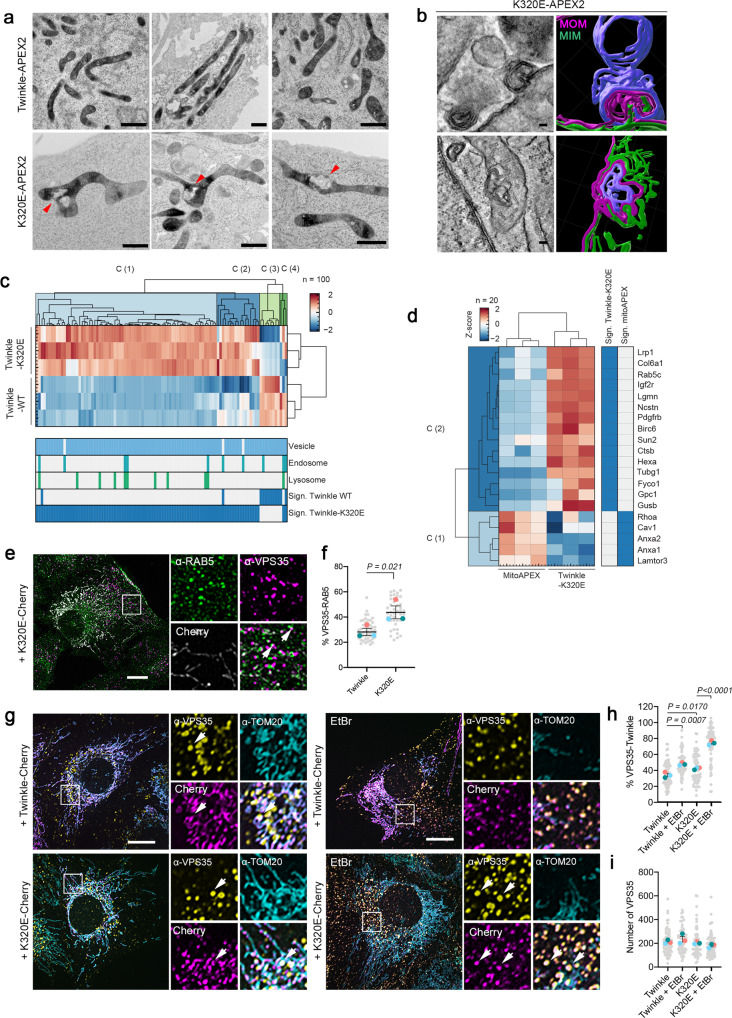
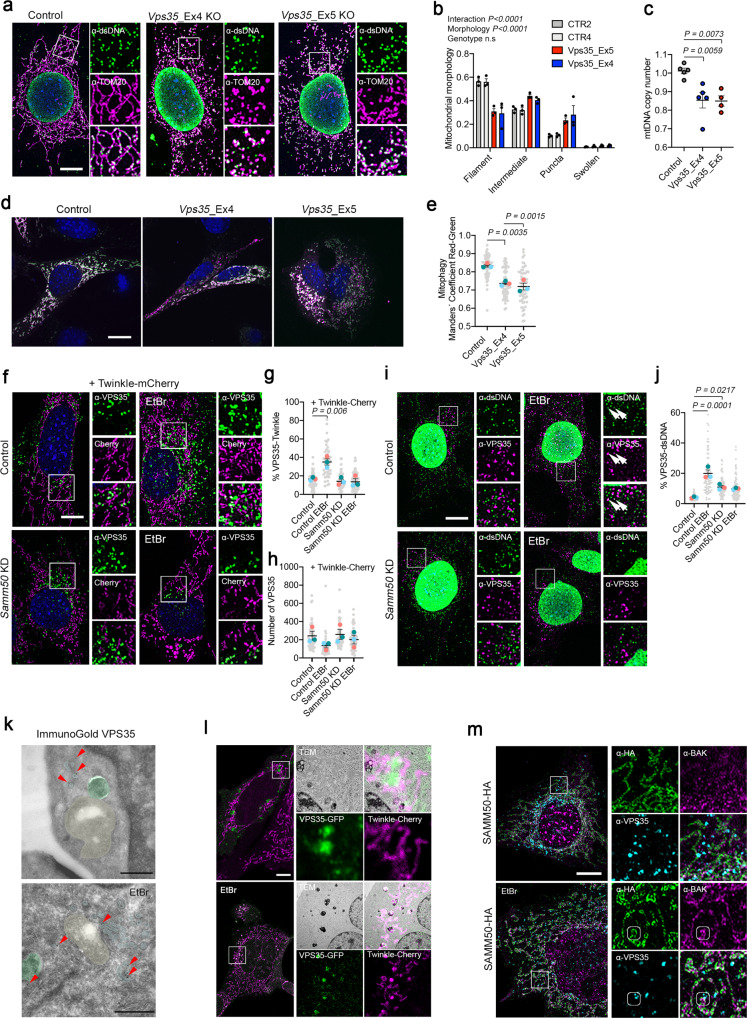
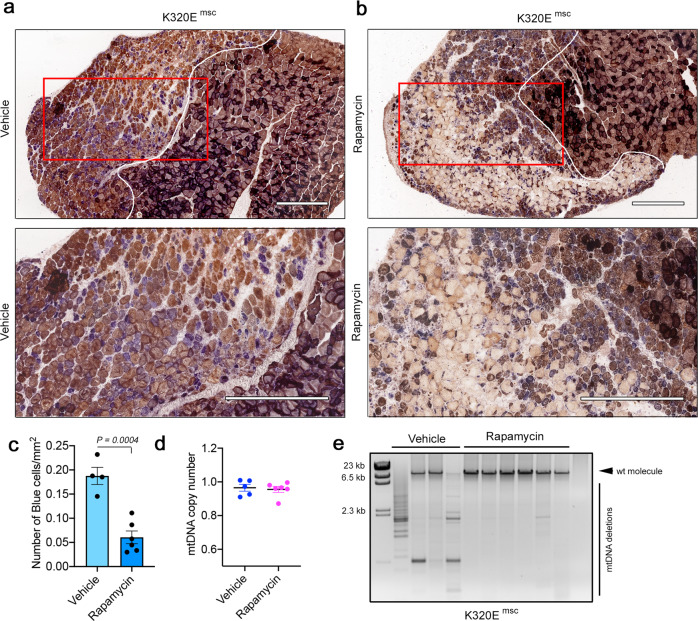
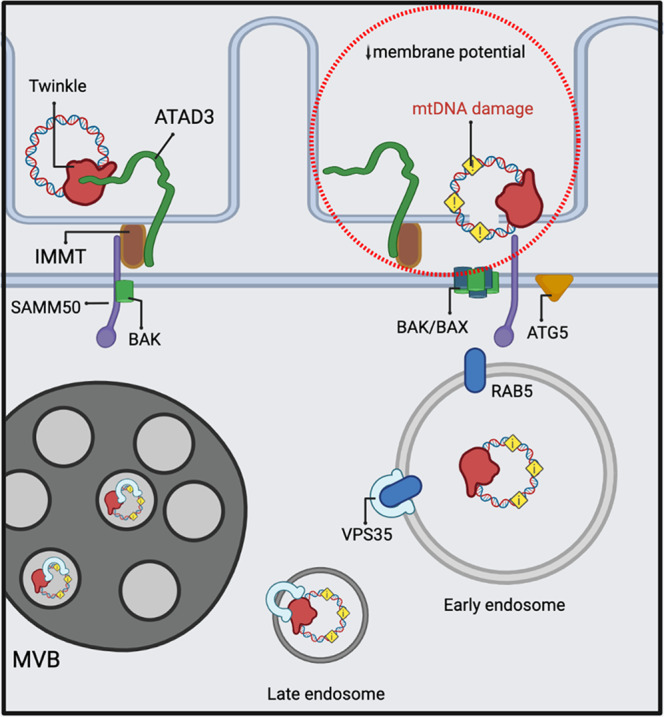
Understanding the mechanisms governing selective turnover of mutation-bearing mtDNA is fundamental to design therapeutic strategies against mtDNA diseases. Here, we show that specific mtDNA damage leads to an exacerbated mtDNA turnover, independent of canonical macroautophagy, but relying on lysosomal function and ATG5. Using proximity labeling and Twinkle as a nucleoid marker, we demonstrate that mtDNA damage induces membrane remodeling and endosomal recruitment in close proximity to mitochondrial nucleoid sub-compartments. Targeting of mitochondrial nucleoids is controlled by the ATAD3-SAMM50 axis, which is disrupted upon mtDNA damage. SAMM50 acts as a gatekeeper, influencing BAK clustering, controlling nucleoid release and facilitating transfer to endosomes. Here, VPS35 mediates maturation of early endosomes to late autophagy vesicles where degradation occurs. In addition, using a mouse model where mtDNA alterations cause impairment of muscle regeneration, we show that stimulation of lysosomal activity by rapamycin, selectively removes mtDNA deletions without affecting mtDNA copy number, ameliorating mitochondrial dysfunction. Taken together, our data demonstrates that upon mtDNA damage, mitochondrial nucleoids are eliminated outside the mitochondrial network through an endosomal-mitophagy pathway. With these results, we unveil the molecular players of a complex mechanism with multiple potential benefits to understand mtDNA related diseases, inherited, acquired or due to normal ageing.


Conflict of interest statement

The authors declare no competing interests.

Figures

Fig. 1
Fig. 1. In vivo expression of Twinkle-K320E induces differential accumulation of mtDNA alterations.
a Long range PCR analysis and b quantitation of mtDNA copy number in M. soleus and M. Tibialis anterior from 24 months old control and Twinkle-K320ESkM mice (control: n = 6; K320E: n = 4). c qPCR quantitation of deletion mtDNA-Δ983-4977 in M. soleus and M. Tibialis anterior from 2 years old mice (n = 4). d, e Western blot analysis and quantification of the indicated proteins in muscle extracts from these mice. (Soleus, control: n = 3; Twinkle-K320E: n = 4. M. TA, control: n = 4; Twinkle-K320E: n = 4). f, g In situ immunofluorescence and image quantification showing autophagic markers LC3 and p62 in cryosections of M. soleus. 5 random pictures with 4 fibers per plane were analyzed per animal to obtain averaged values (control: n = 4; K320E: n = 5). Scale bar, 20 µm. h, i Autophagic flux analysis (LC3-II/LC3-I ratio) in muscle extracts from mice treated with saline or 50 mg/kg chloroquine (Cq) 4 hours before euthanisation. (control, n = 7; control+Cq, n = 5; K320E, n = 7; K320E + Cq, n = 4). P values calculated using unpaired two-tailed Student’s t test (c, e), or One-way ANOVA with Tukey correction for multiple comparison (h). Data are presented as Mean  ±  SEM.
Fig. 2
Fig. 2. Twinkle-K320E triggers mtDNA damage and induces autolysosome accumulation independent of canonical mitophagy.
a C2C12 expressing untagged Twinkle constructs transiently expressing the autophagy reporter LC3-GFP-mCherry and b the mitophagy reporter Fis1p-GFP-mCherry. Red signal shows lysosomal localization. Arrows indicate mito-lysosomes. c, d Manders’ colocalization coefficient Red/Green quantification of transfected cells. A decrease in Manders’ coefficient indicates autolysosome or mito-lysosome accumulation. Cells treated overnight with 10 µM Antimycin/Oligomycin were used to induce canonical mitophagy (n = 3, 10–15 transfected cells per replicate). e mtDNA copy number in C2C12 cells stably expressing Twinkle and Twinkle-K320E (K320E), respectively, vs. empty vector (pBABE). (n = 6 independent cultures). f Confocal images and quantification of C2C12 expressing mCherry tagged Twinkle transfected with plasmids encoding the autophagosome marker LC3-GFP and lysosome marker Lamp1-GFP. g Manders’ colocalization coefficient was used to confirm Twinkle colocalization with autophagic organelles (n = 3, 10–15 transfected cells per replicate). h mtDNA copy number in cells treated with the autophagy inhibitor 3MA, SBI0206965, or the lysosomal inhibitor chloroquine for 24 h (n = 6 independent cultures). i mtDNA oxidative damage detected by immunofluorescence with α-OHdG and α-TOM20 antibodies in cells expressing Twinkle variants and treated with chloroquine for 24 h. j Relative intensity quantification of the α-OHdG signal inside the mitochondrial network. (n = 3, >20 cells per replicate). Scale bar, 10 µm. P values were calculated using unpaired two-tailed Student’s t test (g), or one-way ANOVA with Tukey correction for multiple comparison (c, d, e, h, and j). Data are presented as Mean ± SEM.
Fig. 3
Fig. 3. ATG5 is required for mtDNA clearance after mtDNA damage.
Atg5 WT and KO cells were transduced with Twinkle-APEX2-V5 plasmids. a α-DNA and α-V5-tag immunofluorescence confirming localization of Twinkle in mtDNA nucleoids. b Quantification of mtDNA foci number in Atg5 WT and Atg5 KO cells (n = 3, >25 cells per experiment). (c) Steady state mtDNA copy number in Atg5 cells (n = 6 independent cultures). d, e α-BrdU and α-TOM20 immunofluorescence and quantification of mtDNA replication foci detected by treating the cells for 6 h with 20 µM BrdU. (n = 3, >20 cells per replicate). f Quantification of mtDNA copy number in Atg5 cells treated with Chloroquine or g the autophagy inhibitors 3MA and SBI0206965 for 24 h (n = 3–4 independent cultures). Ratio between the treated and basal value was performed after normalization with internal controls. h, i α-DNA and α-TOM20 immunofluorescence and mtDNA foci quantification in steady state and in cells treated with 50 ng/ul EtBr for 7 days. (n = 3, >20 cells per replicate). j mtDNA copy number analysis for steady state and cells treated for 5 days with EtBr (n = 3–4 independent cultures). Scale bar 5 µm (a), or 10 µm (d and h). P values calculated using unpaired two-tailed Student’s t test (e and i), or One-way ANOVA with Tukey correction for multiple comparison (b, c, f, g, and j). Data are presented as Mean ± SEM.
Fig. 4
Fig. 4. Mitochondrial membranes reorganize upon mtDNA damage.
a Immunofluorescence of C2C12 cells expressing Twinkle-APEX2-V5 variants exposed to biotin-phenol crosslinking. Biotinylated proteins were detected with α-Neutravidin, mitochondria with α-TOM20 and α-V5 for Twinkle. Scale bar 10 µm. b Pie charts of significant hits detected by MS after biotin-phenol crosslink (significance = q-value <0.05 and absolute log2 difference >1). Groups were created according to MitoCarta and GOCC annotation. c Pie charts showing all significantly enriched MitoCarta annotated proteins and their mitochondrial sub-compartment. d Hierarchical clustering of Z-score-normalized protein targets. Enrichment of proteins annotated in MitoCarta and, e with proteins previously described to be located in the mitochondria inner (MIM) or outer membrane (MOM) for Twinkle and K320E. Targets were selected based on significant enrichments compared to mitoAPEX2 in the matrix (significance: q-value <0.05 and absolute log2 difference >1). f Volcano plots showing proteins enriched after crosslinking and purification of Twinkle and K320E-APEX2-V5. Differentially enriched proteins compared with cells transfected with empty vector pBabe (significant: q value < −0.05 and absolute log2 fold change >1) are highlighted in blue. Twinkle (Peo1) is highlighted in red. g Co-immunoprecipitation of V5-tagged Twinkle and ATAD3 or h SAMM50, in steady state or after EtBr treatment. i Co-immunoprecipitation of HA-tagged ATAD3 and ΔIMS-ATAD3 with SAMM50. j Co-immunoprecipitation of ATAD3, SAMM50 and IMMT/MIC60 in steady state or after EtBr treatment.
Fig. 5
Fig. 5. ATAD3 and SAMM50 coordinate for mitochondrial nucleoid extraction.
a α-TOM20 and α-dsDNA immunofluorescence in Atad3 and Samm50 KD MEFs in steady state and after EtBr treatment. b mtDNA foci quantification in Atad3 KD cells. Only the dsDNA signal in contact with the mitochondrial marker TOM20 was considered (n = 3, >40 cells per replicate). c mtDNA copy number quantification after Atad3 KD and d after transduction of ATAD3-HA or ΔIMS-ATAD3-HA and EtBr treatment (n = 6 independent cultures). e mtDNA foci quantification after Samm50 KD in steady state and after EtBr treatment inside the mitochondrial matrix and f located in the cytosol. (n = 3, >20 cells per replicate). g mtDNA copy number analysis for Samm50 KD cells (n = 3 independent cultures). h Representative images of α-BAK and α-HA immunofluorescence in cells transduced with SAMM50-HA and (i) ΔPOTRA-SAMM50-HA. Fluorescence intensity profiles were obtained for a 20 µm straight line crossing the cell body. j mRNA quantification of pro-inflammatory genes in Samm50 KD cells activated in response to cytosolic mtDNA. (n = 3–4 independent cultures). Scale bar, 10 µm. P values calculated using unpaired two-tailed Student’s t-test (j), or one-way ANOVA with Tukey correction for multiple comparison (b, c, d, e, f, and g). Data is presented as mean ± SEM.
Fig. 6
Fig. 6. VPS35 coordinates mtDNA removal upon mtDNA damage.
a Transmission Electron Microscope images of Twinkle-APEX2 cells contrasted with DAB to detect mitochondrial nucleoids. Arrows indicate mitochondrial membrane remodeling. b Electron tomography images and 3D reconstruction in cells expressing K320E-APEX2. 3D reconstruction was performed following membranes in 30–50 slices of a tomogram (distance of slices: 1.108 nm, n = 5). MIM, green; MOM, magenta; non mitochondrial membrane, blue. c Hierarchical clustering of Z-score-normalized protein targets enrichment of proteins related to vesicle trafficking, endosomes and lysosomes for Twinkle and K320E. Targets were selected based on significant enrichments compared to mitoAPEX2 (significance: q-value <0.05 and absolute log2 difference >1). d Hierarchical clustering of Z-score-normalized protein targets enrichment of proteins related to endosomes and lysosomes for K320E. e C2C12 cells expressing K320E-mCherry and labeled with α-RAB5 and α-VPS35 antibodies. Arrows indicate colocalization points. f Quantification of VPS35 particles in contact RAB5 (n = 3, >14 cells per replicate). g C2C12 cells expressing Twinkle-mCherry variants labeled with α-VPS35 and α -TOM20 antibodies and grown in basal medium or treated for 5 days with 50 ng/ml EtBr. Arrows indicate colocalization. h, i Quantification of VPS35 particles in contact with Twinkle (n = 3, >18 cells per replicate). Scale bar, 1 µm (a), 100 nm (b) or 10 µm (e, g). P values calculated using paired two-tailed Student’s t-test (f), or One-way ANOVA with Tukey correction for multiple comparison (h and i). Data is presented as Mean ± SEM.
Fig. 7
Fig. 7. SAMM50 and VPS35 are required for nucleoid and specific mtDNA elimination.
a α-TOM20 and α-dsDNA immunofluorescence of Vps35 KO MEFs and b Mitochondrial morphology quantification (n = 3, >30 cells per replicate). c mtDNA copy number of Vps35 KO cells (n = 5 independent cultures). d Control and Vps35 KO cells transfected with Fis1p-GFP-mCherry plasmid to detect canonical mitophagy. Red signal represents mito-lysosomes. e Manders’ coefficient quantification of transfected cells. A decrease in Manders’ coefficient indicates canonical mitophagy activation (n = 3, >20 cells per replicate). f α-VPS35 labeling in control and Samm50 KD cells transduced with Twinkle-mCherry and treated with EtBr. g Quantification of VPS35 contact site with Twinkle and h number of VPS35 foci per cell (n = 3, >15 cells per replicate). i α-VPS35 and α-dsDNA immunofluorescence in control and Samm50 KD cells. j Quantification of dsDNA foci in contact with VPS35 endosomes (n = 3, >20 cells per replicate). k Immunogold labeling of VPS35 in steady state and EtBr treated cells. Gold particles are signalized by red arrows. Mitochondria were colored in yellow, endosomes in cyan and late autophagy organelles in green. l Correlative Light-Electron microscopy in cells expressing Twinkle-Cherry and transiently transfected with VPS35-GFP, in steady state and after EtBr treatment. (n = 5 transfected cells). m Representative images of Airy Scan Super-Resolution microscopy of cells transduced with SAMM50-HA and labeled with α-HA, α-VPS35 and α-BAK, in steady state and upon EtBr treatment. Small frames mark colocalization of three proteins (marked in three channels). Scale bar, 10 µm (a, d, f, i, l, and m) and 500 nm (k). P values calculated using One-way ANOVA with Tukey correction for multiple comparison (c, e, g, h, and j) and Two-way ANOVA for Genotype and Morphology interaction (n.s = no significative). Data is presented as mean ± SEM.
Fig. 8
Fig. 8. Rapamycin eliminates mtDNA deletions without affecting copy number in vivo.
COX-SDH staining of regenerated TA muscle from Pax7-K320E mice (K320Emsc). After cardiotoxin-induced injury, mice were injected for 5 days either with a vehicle or b 2 mg/kg Rapamycin. c Quantification of COX-negative cells (blue) in the injured area. d mtDNA quantification by qPCR or e Long-range PCR in regenerated muscle from K320Emsc mice treated with vehicle or with Rapamycin. (Vehicle, n = 4; Rapamycin, n = 6). Scale bar, 500 µm. P values were calculated using the Unpaired Student’s t test. Data are presented as Mean  ±  SEM.
Fig. 9
Fig. 9. Proposed model for mitochondrial nucleoid extraction upon mtDNA damage.
MtDNA damage induces local changes in membrane potential and cristae remodeling. ATAD3 and SAMM50 coordinate to extract mitochondrial nucleoids probably through BAK/BAX pores. Mitochondrial nucleoids containing mtDNA are engulfed or transferred to early endosomes. VPS35 mediates the maturation of these vesicles to late autophagy structures. The image was generated with full licensed BioRender.com.

Comment in

References

    1. Lopez-Otin C, Blasco MA, Partridge L, Serrano M, Kroemer G. The hallmarks of aging. Cell. 2013;153:1194–1217. - PMC - PubMed
    1. Stewart, J. B. & Chinnery, P. F. Extreme heterogeneity of human mitochondrial DNA from organelles to populations. Nat. Rev. Genet.10.1038/s41576-020-00284-x (2020). - PubMed
    1. Pickles S, Vigie P, Youle RJ. Mitophagy and quality control mechanisms in mitochondrial maintenance. Curr. Biol. 2018;28:R170–R185. - PMC - PubMed
    1. Chen HC, et al. Mitochondrial fusion is required for mtDNA stability in skeletal muscle and tolerance of mtDNA mutations. Cell. 2010;141:280–289. - PMC - PubMed
    1. Sugiura A, McLelland GL, Fon EA, McBride HM. A new pathway for mitochondrial quality control: mitochondrial-derived vesicles. EMBO J. 2014;33:2142–2156. - PMC - PubMed

Publication types

MeSH terms