

A multi-marker integrative analysis reveals benefits and risks of bariatric surgery
- PMID: 36344536
- PMCID: PMC9640526
- DOI: 10.1038/s41598-022-23241-6
A multi-marker integrative analysis reveals benefits and risks of bariatric surgery
Abstract
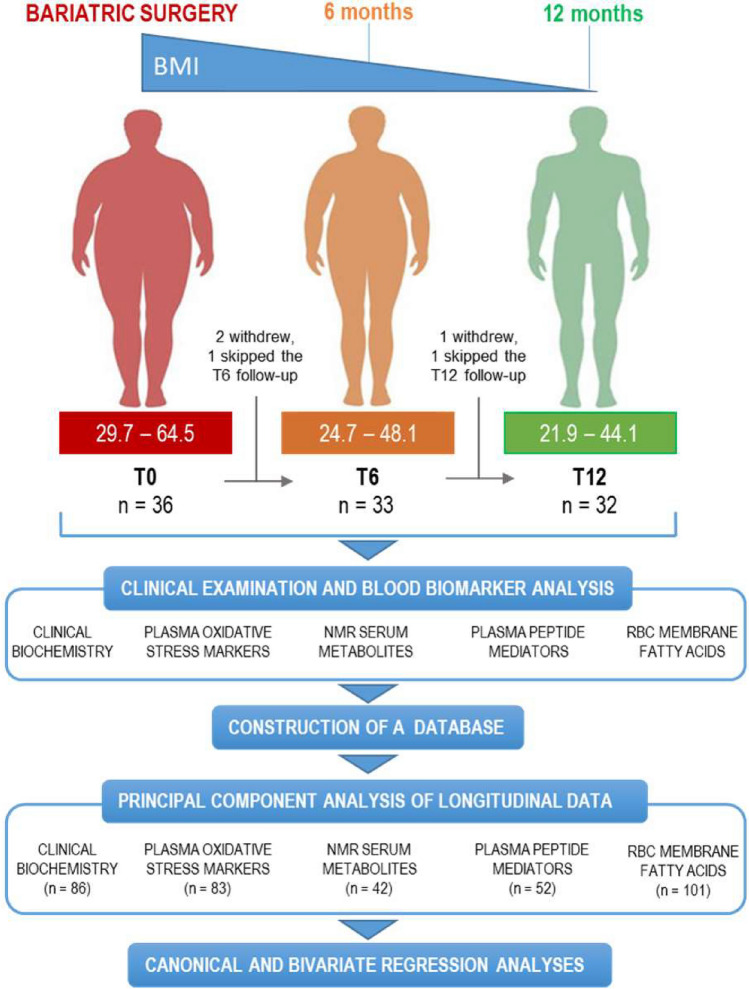
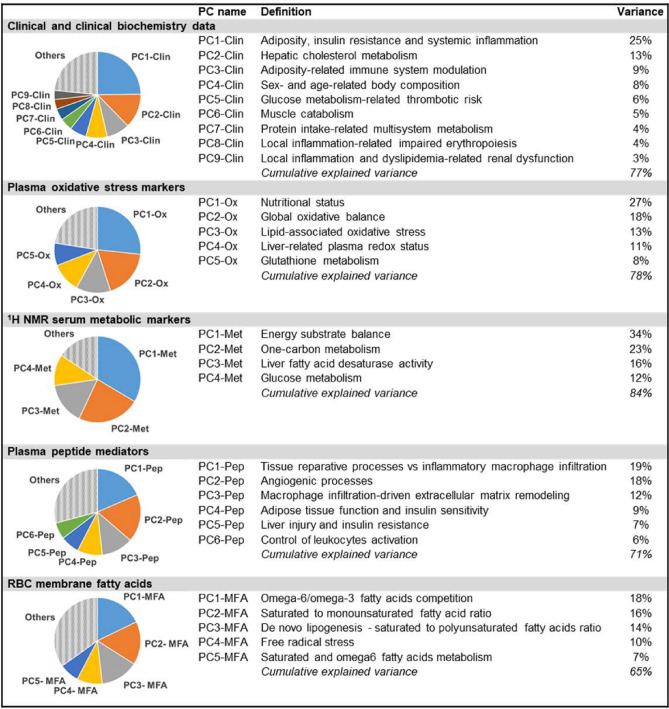
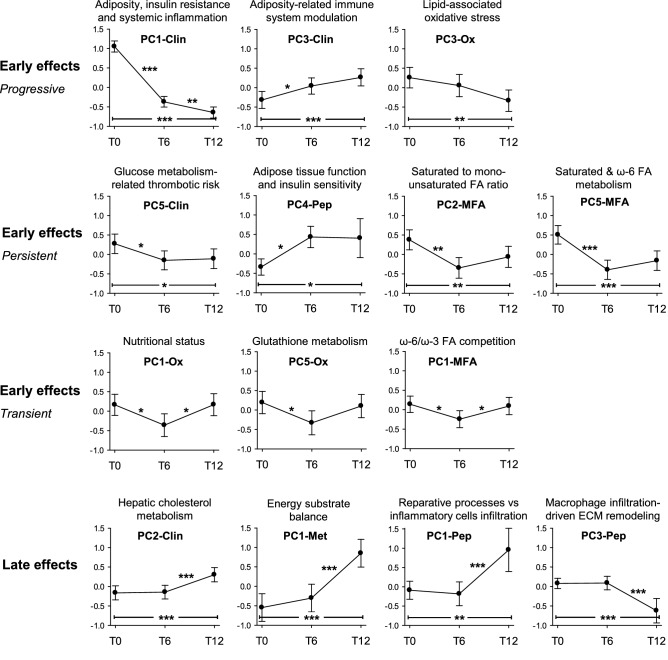
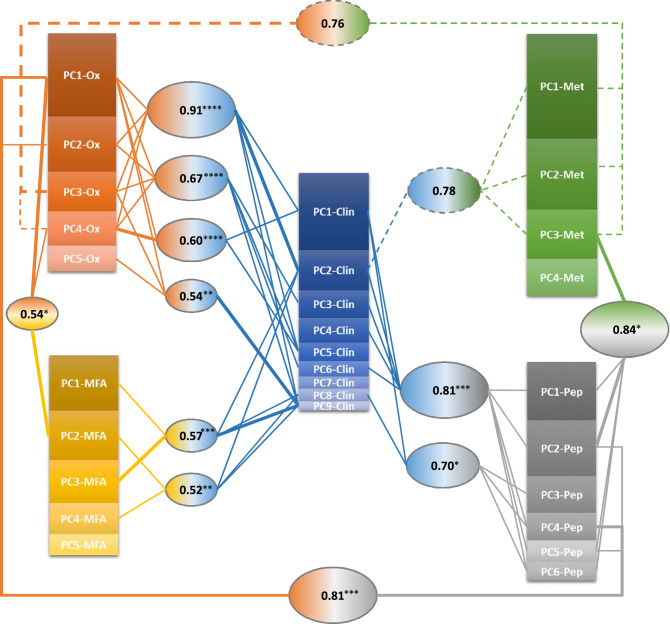
Bariatric surgery (BS) is an effective intervention for severe obesity and associated comorbidities. Although several studies have addressed the clinical and metabolic effects of BS, an integrative analysis of the complex body response to surgery is still lacking. We conducted a longitudinal data study with 36 patients with severe obesity who were tested before, 6 and 12 months after restrictive BS for more than one hundred blood biomarkers, including clinical, oxidative stress and metabolic markers, peptide mediators and red blood cell membrane lipids. By using a synthetic data-driven modeling based on principal component and correlation analyses, we provided evidence that, besides the early, well-known glucose metabolism- and weight loss-associated beneficial effects of BS, a tardive, weight-independent increase of the hepatic cholesterol metabolism occurs that is associated with potentially detrimental inflammatory and metabolic effects. Canonical correlation analysis indicated that oxidative stress is the most predictive feature of the BS-induced changes of both glucose and lipids metabolism. Our results show the power of multi-level correlation analysis to uncover the network of biological pathways affected by BS. This approach highlighted potential health risks of restrictive BS that are disregarded with the current practice to use weight loss as surrogate of BS success.
© 2022. The Author(s).
Conflict of interest statement
FDN receives her salary from Lipinutragen srl. Lipinutrigen srl, as well as the funding sources, had no role in the study design, collection, analysis, and interpretation of data, writing of the report or decision to submit the manuscript. The other authors declare no potential conflict of interest.
Figures
References
-
- Eurostat. Overweight and obesity—BMI statistics. European health interview survey 2019, 1–10. https://ec.europa.eu/eurostat/statistics-explained/index.php?title=Overw... (2021).
-
- WHO European Childhood Obesity Surveillance Initiative (COSI): Report on the fourth round of data collection, 2015–2017. Licence: CC BY-NC-SA 3.0 IGO (WHO Regional Office for Europe, 2021).
-
- Haslam DW, James WPT. Obesity. Lancet. 2005;366:1197–1209. - PubMed
-
- Yamato M, et al. Fatty acids increase the circulating levels of oxidative stress factors in mice with diet-induced obesity via redox changes of albumin. FEBS J. 2007;274:3855–3863. - PubMed
Publication types
MeSH terms
Grants and funding
LinkOut - more resources
Full Text Sources
Medical
