. 2022 Nov 7;8(1):150.
doi: 10.1038/s41531-022-00409-5.

Machine learning-based prediction of cognitive outcomes in de novo Parkinson's disease

Affiliations

Machine learning-based prediction of cognitive outcomes in de novo Parkinson's disease

Joshua Harvey et al. NPJ Parkinsons Dis. .

Abstract

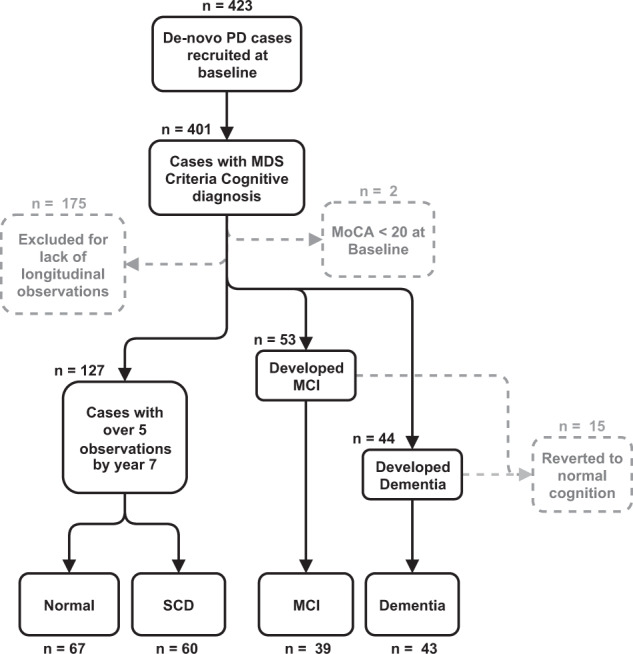
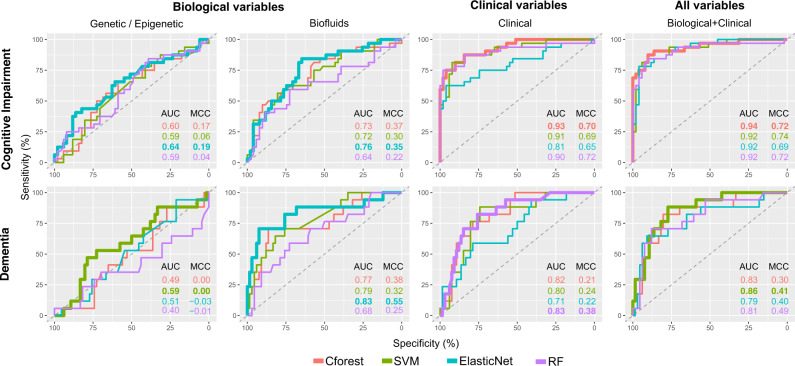
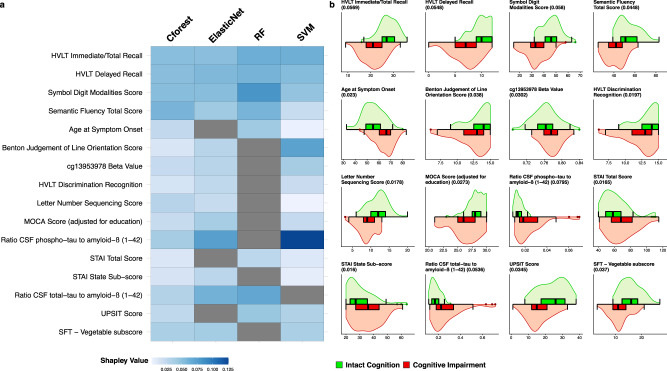
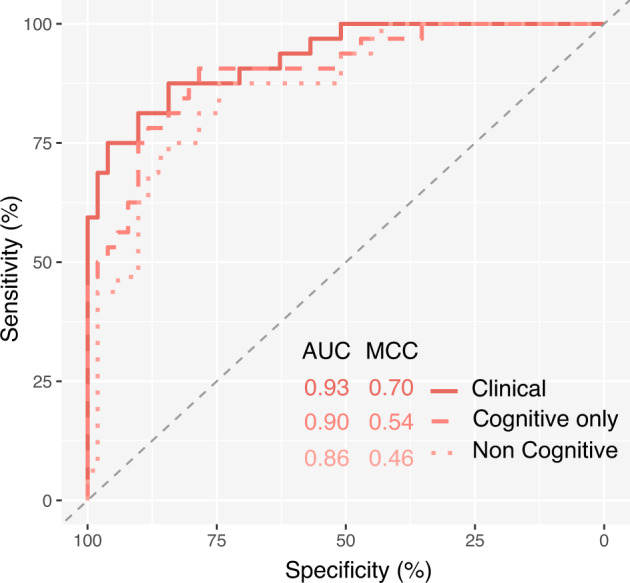
Cognitive impairment is a debilitating symptom in Parkinson's disease (PD). We aimed to establish an accurate multivariate machine learning (ML) model to predict cognitive outcome in newly diagnosed PD cases from the Parkinson's Progression Markers Initiative (PPMI). Annual cognitive assessments over an 8-year time span were used to define two cognitive outcomes of (i) cognitive impairment, and (ii) dementia conversion. Selected baseline variables were organized into three subsets of clinical, biofluid and genetic/epigenetic measures and tested using four different ML algorithms. Irrespective of the ML algorithm used, the models consisting of the clinical variables performed best and showed better prediction of cognitive impairment outcome over dementia conversion. We observed a marginal improvement in the prediction performance when clinical, biofluid, and epigenetic/genetic variables were all included in one model. Several cerebrospinal fluid measures and an epigenetic marker showed high predictive weighting in multiple models when included alongside clinical variables.


Conflict of interest statement

The authors declare no competing interests.

Figures

Fig. 1
Fig. 1. Flow diagram of case subsetting criteria.
Samples retained in each stage are shown as black lines between boxes, samples excluded shown as dotted gray lines and boxes. Case numbers for each selection stage are shown overlaid on each plot. Final subset groups (Normal, SCD, MCI, and Dementia) are shown at the bottom of the flow diagram. MDS Movement Disorder Society, MoCA Montreal Cognitive Assessment, MCI Mild Cognitive Impairment, SCD Subjective Cognitive Decline.
Fig. 2
Fig. 2. Receiver operating characteristic plots for predicting cognitive impairment and dementia using selected clinical, genetic/epigenetic, and biofluid variables.
ROC curves displayed in grid with rows as cognitive outcome and columns as variable subset. Colored by ML algorithm with the highest AUC for each outcome and variable set displayed as a thicker line. AUC and MCC metrics displayed as text for each plot. ROC receiver operating characteristic AUC area under the curve, MCC Matthews Correlation Coefficient, ML machine learning, SVM Support Vector Machines, Cforest Conditional Inference Random Forest, RF Random Forest.
Fig. 3
Fig. 3. Variable importance in predicting cognitive impairment outcome.
Variables included across three or more ML models for prediction of the cognitive impairment outcome using combined clinical and biological variables. a A heatmap of global Shapley importance. Darker blue reflects higher Shapley value and more important variables in the model. Variables not included in a particular model are shown in gray. b Dual violin and box plots of raw values of each variable between groups. Average global Shapley value importance for each variable is shown in brackets next to each variable name. Boxes represent median, Q1 and Q3 of the interquartile range (IQR) and whiskers display 1.5× IQR below and above Q1 and Q3, respectively. HVLT Hopkins Verbal Learning Test, MOCA Montreal Cognitive Assessment, CSF cerebrospinal fluid, STAI State-Trait Anxiety Inventory, UPSIT University of Pennsylvania Smell Identification Test, SFT semantic fluency test, ML machine learning.
Fig. 4
Fig. 4. Sensitivity analysis of cognitive variables.
ROC showing prediction of the cognitive impairment outcome using Cforest applied on clinical subsets. Noncognitive variables: dotted line, cognitive variables: dashed line, all clinical variables: solid line. Summary of AUC and MCC metrics for each subset shown in plot text. AUC area under the curve, MCC Matthews Correlation Coefficient, Cforest Conditional Inference Random Forest, ROC receiver operating characteristic.

References

    1. Svenningsson P, Westman E, Ballard C, Aarsland D. Cognitive impairment in patients with Parkinson’s disease: diagnosis, biomarkers, and treatment. Lancet Neurol. 2012;11:697–707. - PubMed
    1. Aarsland D, Zaccai J, Brayne C. A systematic review of prevalence studies of dementia in Parkinson’s disease. Mov. Disord. 2005;20:1255–1263. - PubMed
    1. Aarsland D, et al. Cognitive impairment in incident, untreated Parkinson disease The Norwegian ParkWest Study. Neurology. 2009;72:1121–1126. - PubMed
    1. Aarsland D, et al. Cognitive decline in Parkinson disease. Nat. Rev. Neurol. 2017;13:217–231. - PMC - PubMed
    1. Williams-Gray CH, et al. The CamPaIGN study of Parkinson’s disease: 10-year outlook in an incident population-based cohort. J. Neurol. Neurosurg. Psychiatry. 2013;84:1258–1264. - PubMed