

An epifluidic electronic patch with spiking sweat clearance for event-driven perspiration monitoring
- PMID: 36344563
- PMCID: PMC9640696
- DOI: 10.1038/s41467-022-34442-y
An epifluidic electronic patch with spiking sweat clearance for event-driven perspiration monitoring
Abstract
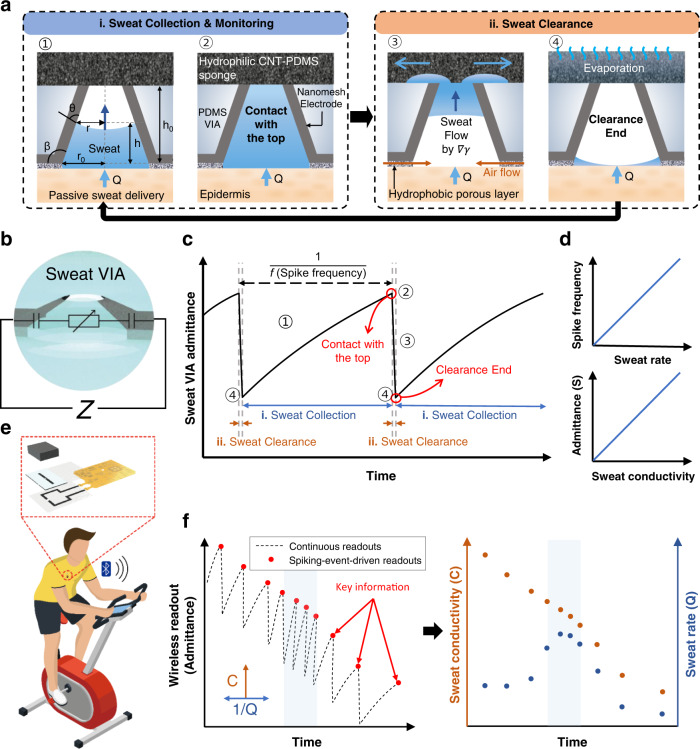
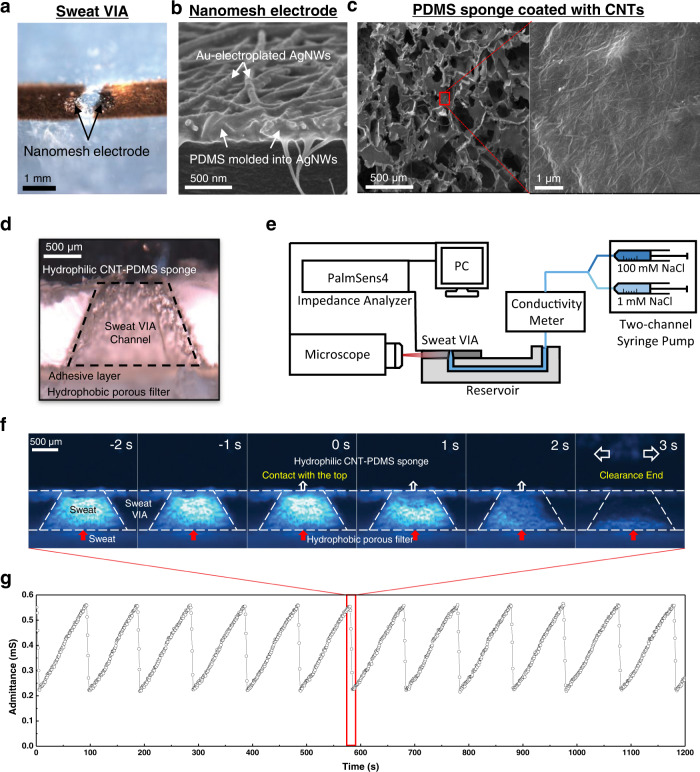
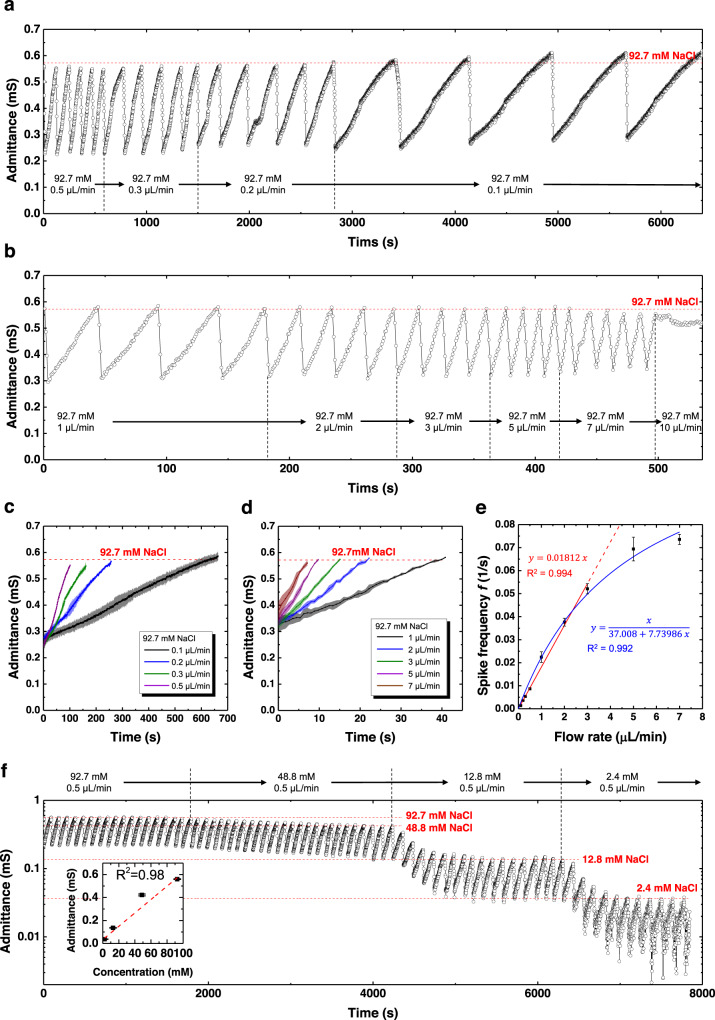
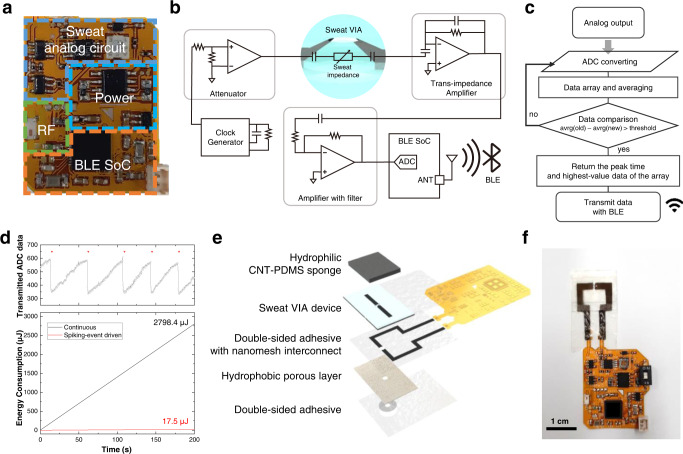
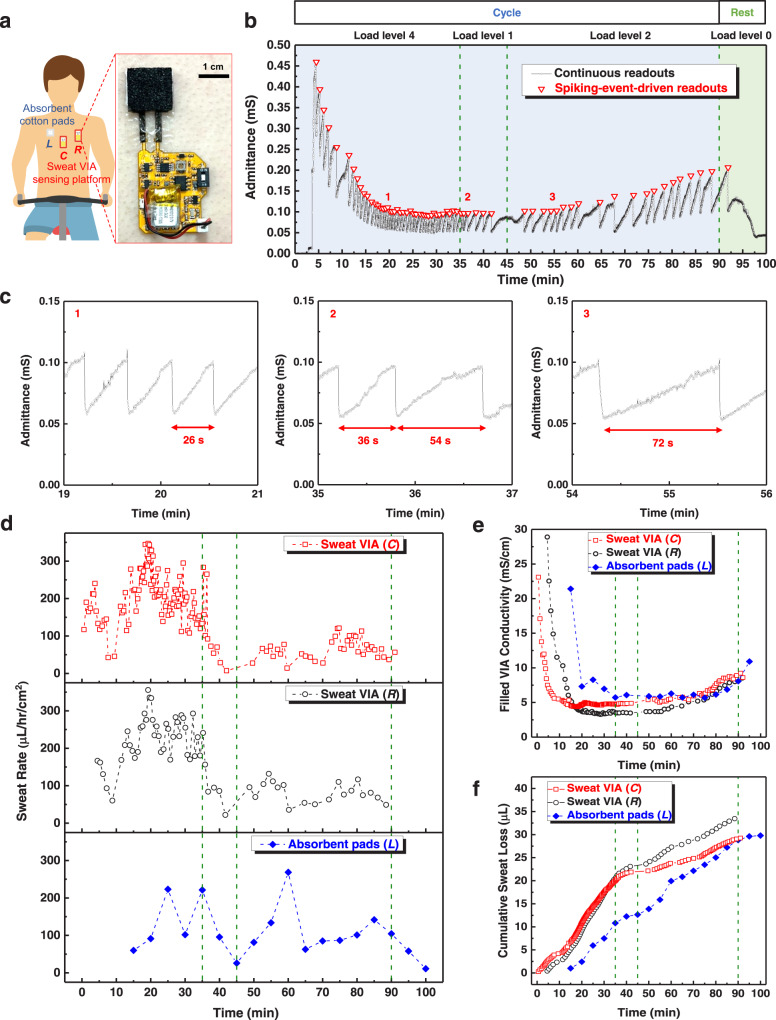
Sensory neurons generate spike patterns upon receiving external stimuli and encode key information to the spike patterns, enabling energy-efficient external information processing. Herein, we report an epifluidic electronic patch with spiking sweat clearance using a sensor containing a vertical sweat-collecting channel for event-driven, energy-efficient, long-term wireless monitoring of epidermal perspiration dynamics. Our sweat sensor contains nanomesh electrodes on its inner wall of the channel and unique sweat-clearing structures. During perspiration, repeated filling and abrupt emptying of the vertical sweat-collecting channel generate electrical spike patterns with the sweat rate and ionic conductivity proportional to the spike frequency and amplitude over a wide dynamic range and long time (> 8 h). With such 'spiking' sweat clearance and corresponding electronic spike patterns, the epifluidic wireless patch successfully decodes epidermal perspiration dynamics in an event-driven manner at different skin locations during exercise, consuming less than 0.6% of the energy required for continuous data transmission. Our patch could integrate various on-skin sensors and emerging edge computing technologies for energy-efficient, intelligent digital healthcare.
© 2022. The Author(s).
Conflict of interest statement
The authors declare the following competing interests: S.K., S.P., J.C., W.H., H.Y., and R.K. are inventors of patents related to this work (application no. 10-2021-0091860 (KR), 10-2021-0093604 (KR), 17/471,165 (US), and 17/465,977 (US)). S.K., J.C., I.-S.C., S.K., H.Y., and R.K. are inventors of patents related to this work (application no. 10-2018-0173912 (KR) and 16/691,006 (US)).
Figures

Similar articles
-
Epidermal tattoo potentiometric sodium sensors with wireless signal transduction for continuous non-invasive sweat monitoring.Biosens Bioelectron. 2014 Apr 15;54:603-9. doi: 10.1016/j.bios.2013.11.039. Epub 2013 Nov 20. Biosens Bioelectron. 2014. PMID: 24333582
-
Wearable Potentiometric Ion Patch for On-Body Electrolyte Monitoring in Sweat: Toward a Validation Strategy to Ensure Physiological Relevance.Anal Chem. 2019 Jul 2;91(13):8644-8651. doi: 10.1021/acs.analchem.9b02126. Epub 2019 Jun 13. Anal Chem. 2019. PMID: 31194514
-
Adaptively resettable microfluidic patch for sweat rate and electrolytes detection.Biosens Bioelectron. 2024 Aug 1;257:116299. doi: 10.1016/j.bios.2024.116299. Epub 2024 Apr 16. Biosens Bioelectron. 2024. PMID: 38636318
-
Flexible Electronics toward Wearable Sensing.Acc Chem Res. 2019 Mar 19;52(3):523-533. doi: 10.1021/acs.accounts.8b00500. Epub 2019 Feb 15. Acc Chem Res. 2019. PMID: 30767497 Review.
-
Skin-Interfaced Wearable Sweat Sensors for Precision Medicine.Chem Rev. 2023 Apr 26;123(8):5049-5138. doi: 10.1021/acs.chemrev.2c00823. Epub 2023 Mar 27. Chem Rev. 2023. PMID: 36971504 Free PMC article. Review.
Cited by
-
Bionic artificial skin with a fully implantable wireless tactile sensory system for wound healing and restoring skin tactile function.Nat Commun. 2024 Jan 2;15(1):10. doi: 10.1038/s41467-023-44064-7. Nat Commun. 2024. PMID: 38169465 Free PMC article.
-
Noninvasive On-Skin Biosensors for Monitoring Diabetes Mellitus.Nanomicro Lett. 2025 Jul 31;18(1):16. doi: 10.1007/s40820-025-01843-9. Nanomicro Lett. 2025. PMID: 40742490 Free PMC article. Review.
-
Full-Cut Manufacture of Skin-Interfaced Microfluidic Patch with Copper Electrode for In Situ Admittance Sensing of Sweat Rate.Biosensors (Basel). 2022 Dec 31;13(1):67. doi: 10.3390/bios13010067. Biosensors (Basel). 2022. PMID: 36671902 Free PMC article.
-
Review of biomimetic ordered microstructures in advancing synergistic integration of adhesion and microfluidics.RSC Adv. 2024 Apr 10;14(17):11643-11658. doi: 10.1039/d3ra07698a. eCollection 2024 Apr 10. RSC Adv. 2024. PMID: 38605897 Free PMC article. Review.
-
A Dual-Function Wearable Electrochemical Sensor for Uric Acid and Glucose Sensing in Sweat.Biosensors (Basel). 2023 Jan 6;13(1):105. doi: 10.3390/bios13010105. Biosensors (Basel). 2023. PMID: 36671938 Free PMC article.
References
-
- Bariya M, Nyein HYY, Javey A. Wearable sweat sensors. Nat. Electron. 2018;1:160–171.
-
- Yu Y, Nyein HYY, Gao W, Javey A. Flexible electrochemical bioelectronics: the rise of in situ bioanalysis. Adv. Mater. 2020;32:1902083. - PubMed
-
- Sunwoo S-H, Ha K-H, Lee S, Lu N, Kim D-H. Wearable and implantable soft bioelectronics: device designs and material strategies. Annu. Rev. Chem. Biomol. Eng. 2021;12:359–391. - PubMed
-
- Legner C, Kalwa U, Patel V, Chesmore A, Pandey S. Sweat sensing in the smart wearables era: Towards integrative, multifunctional and body-compliant perspiration analysis. Sens. Actuators A Phys. 2019;296:200–221.
Publication types
MeSH terms
Substances
LinkOut - more resources
Full Text Sources
Medical
